ISSN 2286-4822 www.euacademic.org
Impact Factor: 3.4546 (UIF) DRJI Value: 5.9 (B+)
Multidimensional data analysis (MDA) with Excel
pivot table as a research decision support system - a
conceptual note
JOSEPH KIM-KEUNG HO Independent Trainer Hong Kong, China
Abstract:
Though the topic of multidimensional data analysis and the Excel pivot table function have been much examined in the computer science and the Management Information Systems fields, it has been neglected as a research topic in the Research Methods field. This article examines the underlying rationale and value of multidimensional data analysis with Excel pivot table; it points to its flexibility and relative conceptual simplicity as a research method technique. Also, this article offers some illustration on how it is used to study a data set from a 2015 Facebook-based questionnaire survey conducted by the writer on perceptions of literature review practices and concerns in Hong Kong.
Key words: Excel pivot table, executive information systems (EIS), information user, multidimensional data analysis (MDA), literature review, online analytical processing (OLAP), research decision support system.
INTRODUCTION
From an academic standpoint, MDA is very often treated as a topic of study in the computer science field, notably on the topic of online analytical processing (OLAP) (Pilotsoftware.com, 2002; Forsman, 1997). Related to that, in the Management Information Systems (MIS) field (Haag and Cummings, 2013), the Excel pivot function to study a company's statistics, especially as related to key performance indicators, in a multidimensional way has long been known as a useful feature of an executive information system (EIS) (Partanen and Savolanien, 1995; Nord and Nord, 1995). Thus, the value of multidimensional data analysis, which the Excel pivot table function supports, for studying a structured data set with multiple fields (i.e., as dimensions and values for analysis), is renowned in the computer science and MIS fields. However, until now, the value of MDA as a quantitative research method technique has been downplayed. Often, in the Research Methods field, this Excel function of pivot tables is merely treated as a presentation tool for producing table-form descriptive statistics in the analysis section of a dissertation report. This is reflected in the very few academic articles found on the multidimensional data analysis with the Excel pivot table function in academic journal publisher websites, especially in the Research Methods field. In this respect, Ho (2018) is a pioneering article on the Excel pivot table for research. In the same vein, in an attempt to address this research deficiency on this MDA topic, this article takes up the task of discussing conceptually the value of multidimensional data analysis with the Excel pivot table function as a research method analysis technique, or more tersely termed as a research decision support system (Ho, 2018).
Multidimensional data analysis with Excel pivot table as a research Decision Support system
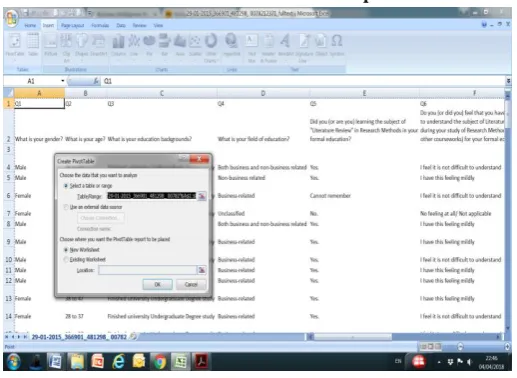
dimensions and values). In the context of research methods practice, more often than not, such a structured file is one on survey questionnaire response records, with the survey very often done online. Subsequently, the survey data are exported to an Excel file. After some data cleansing, the survey data file can be analysed with the Excel pivot table function. This is illustrated in Exhibit 1 as follows:
Exhibit 1: a structured data file and the Excel pivot table function
The location of the Excel pivot table function is in Insert, then PivotTable. Field names (i.e., dimensions) can be chosen as rows or columns for the pivot table while the value field(s) are the ones to be averaged or summed up, etc., in the pivot table. When studying a pivot table, the researcher could examine the following figures in a set of constructed pivot tables, with different combinations of fields (i.e., dimensions and value fields):
a. Row and column subtotals in a pivot table on a chosen value field
b. Specific cell values1 of a value field in a pivot table
c. Cross comparison of cell values of a value field in a pivot table or between pivot tables
d. Extreme, average and blank values in various cells of a value field
An illustration of using multidimensional data analysis (MDA) with Excel pivot table to study survey questionnaire data
An MDA on a Facebook-based survey data set covering perceptions on literature review practices and concerns in Hong Kong is provided in this section. The question survey was conducted in January 2015 and reported in Ho (2015). Two major pivot table analyses on the survey data are reported as follows for illustration purpose on this research decision support system practice.
Pivot table analysis 1 on "perceived difficulty to study academic journal articles"
This analysis adopts the following coding scheme for the data analysis on survey question 7 (re: Appendix 1): Did you feel that academic journal articles were difficult to understand during your study for your formal education? Yes, I strongly feel so: 3
I have this feeling mildly: 2 I feel it is not difficult to understand, in general:
1
No feeling at all: Filtered; not used in the analysis
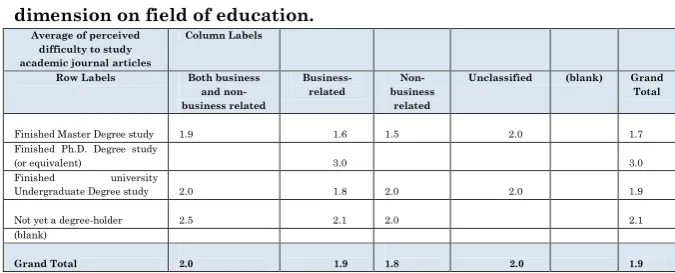
Table 1: perceived difficulty to study academic journal articles with the row dimension on education background and the column dimension on field of education.
Average of perceived difficulty to study academic journal articles
Column Labels
Row Labels Both business
and non-business related Business-related Non-business related
Unclassified (blank) Grand
Total
Finished Master Degree study
1.9 1.6
1.5 2.0
1.7 Finished Ph.D. Degree study
(or equivalent) 3.0
3.0 Finished university
Undergraduate Degree study
2.0 1.8
2.0 2.0
1.9
Not yet a degree-holder
2.5 2.1
2.0 2.1 (blank) Grand Total
2.0 1.9
1.8 2.0
Interpretations: On perceived difficulty to study academic journal articles, those with both business and non-business-related fields experienced more difficulty to study academic journal articles than others. Those with Ph.D. degrees also have more difficulty to study academic journal articles. It appears important to also take into consideration the numbers of respondents in each cell on interpreting this set of pivot table values.
Table 2: perceived difficulty to study academic journal articles with the row dimension on education background and the column dimension on age range.
Average of perceived difficulty to study academic journal articles
Column Labels
Row Labels 18 to 27 28 to 37 38 to 47 48 to 57 (blank) Grand
Total
Finished Master Degree study 2.2 1.6 1.0 1.7 Finished Ph.D. Degree study (or
equivalent) 3.0 3.0
Finished university Undergraduate
Degree study 2.0 1.9 1.8 1.8 1.9 Not yet a degree-holder 1.8 2.4 1.8 3.0 2.1
(blank)
Grand Total 1.8 2.1 1.7 2.1 1.9
Interpretations: On perceived difficulty to study academic
journal articles, those in the age ranges of 26-37 and 48-57 have more difficulty to study academic journal articles than others. Those in the age range of 48 to 57 with Ph.D. degrees and no degree yet also have more difficulty to study academic journal articles.
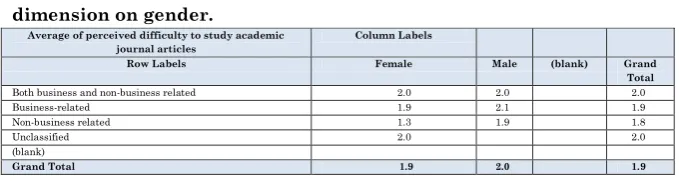
Table 3: perceived difficulty to study academic journal articles with the row dimension on education background and the column dimension on gender.
Average of perceived difficulty to study academic journal articles
Column Labels
Row Labels Female Male (blank) Grand
Total
Both business and non-business related 2.0 2.0 2.0 Business-related 1.9 2.1 1.9 Non-business related 1.3 1.9 1.8
Unclassified 2.0 2.0
(blank)
Grand Total 1.9 2.0 1.9
Interpretations: On perceived difficulty to study academic
academic journal articles than female respondents. This is especially the case for respondents with non-business related education background.
Pivot table analysis 2 on "perceived relevance of academic article study to professional competence improvement"
This analysis adopts the following coding scheme for the data analysis on survey question 10 (re: Appendix 1): Do you feel that reading academic journal articles is able to improve your professional competence?
Yes, I strongly feel so: 3
I have this feeling mildly: 2
I don't feel so 1
No idea filtered; not used in the analysis
Table 4: perceived relevance of academic article study to professional competence improvement with the row dimension on education background and the column dimension on field of education.
Average of perceived relevance of academic article study to professional competence
improvement
Column Labels
Row Labels Both business and non-business related
Business-related
Non-business related
Unclassified (blank) Grand Total Finished Master Degree study 2.2 3.0 2.2 2.0 2.4 Finished Ph.D. Degree study (or
equivalent) 2.0 2.0 Finished university Undergraduate
Degree study 2.5 2.3 2.2 2.3 Not yet a degree-holder 2.0 2.1 3.0 2.1
(blank)
Grand Total 2.3 2.3 2.3 2.0 2.3
Interpretations: On perceived relevance of academic article
Table 5: perceived relevance of academic article study to professional competence improvement with the row dimension on education background and the column dimension on age range.
Average of perceived relevance of academic article study to professional competence
improvement
Column Labels
Row Labels 18 to 27 28 to 37 38 to 47 48 to 57 (blank) Grand
Total
Finished Master Degree study 2.0 2.5 3.0 2.4 Finished Ph.D. Degree study (or
equivalent) 2.0 2.0
Finished university Undergraduate
Degree study 2.0 2.3 2.3 2.5 2.3 Not yet a degree-holder 2.2 2.4 1.7 2.0 2.1
(blank)
Grand Total 2.2 2.3 2.2 2.4 2.3
Interpretations: On perceived relevance of academic article
study to professional competence improvement, respondents in the age range of 48-57 perceive higher relevance of academic journal article study to professional competence development. Non-degree holders in the age range of 38-47 perceive the lowest relevance of academic journal article study to professional competence development.
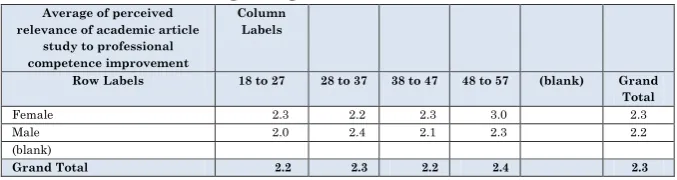
Table 6: perceived relevance of academic article study to professional competence improvement with the row dimension on gender and the column dimension on age range.
Average of perceived relevance of academic article
study to professional competence improvement
Column Labels
Row Labels 18 to 27 28 to 37 38 to 47 48 to 57 (blank) Grand Total
Female 2.3 2.2 2.3 3.0 2.3
Male 2.0 2.4 2.1 2.3 2.2
(blank)
Grand Total 2.2 2.3 2.2 2.4 2.3
Interpretations: On perceived relevance of academic article
In summary, the pivot table analysis as presented in this section reveals the relatively detailed patterns of result values on chosen value fields that, in turn, provide inputs for further inductive and deductive investigation. If the file size for multiple data analysis is large, it also becomes more feasible to consider more than one dimension in a pivot table row or column as an EIS drill-down exercise. The pivot table analysis enables further analytical stimulation to a researcher who then can generate additional research questions.
CONCLUDING REMARKS
REFERENCES
1. Forsman, S. 1997. "OLAP Council White Paper" OLAP
Council (url address:
http://www.symcorp.com/downloads/OLAP_CouncilWhit ePaper.pdf) [visited at April 5, 2018].
2. Haag, S. and M. Cummings. 2013. Management
Information Systems for the Information Age, 9th
Edition, McGraw-Hill.
3. Ho, J.K.K. 2015. "Examining Literature Review
Practices and Concerns Based on Managerial Intellectual Learning Thinking" International Journal of Interdisciplinary Research in Science Society and
Culture (IJIRSSC) 1(1): 1-13.
4. Ho, J.K.K. 2018. "Using the Excel pivot table (EPT) function as a research decision support system (DSS): a research note" European Academic Research 7(2) May: 637-655.
5. Inmon, W.H., C. Imhoff and R. Sousa. 2001. Corporate
Information Factory, 2 edition, Wiley.
6. Nord, J.H. and G.D. Nord. 1995. "Executive information systems: A study and comparative analysis"
Information & Management 29, Elsevier: 95-106.
7. Partanen, K. and V. Savolainen. 1995. "Perspectives on Executive Information Systems" Systems Practice 8(6): 551-575.
APPENDIX
Appendix 1: The Facebook-based survey questions (14 questions) dated January 23 to 30, 2015 and responses statistics (Ho, 2015). Survey questions Survey statistics
Question 1: What is your gender? Male: 57 (44.5%) Female: 71 (55.5%) Question 2: What is your age? 18 to 27: 6 (4.7%)
28 to 37: 60 (46.9%) 38 to 47: 52 (40.6%) 48 to 57: 10 (7.8%) 58 to 67: 0 (0.0%) 68 or above: 0 (0.0%) Question 3: What is your
education background?
Not yet a degree-holder: 34 (26.6%)
Finished University Undergraduate Degree study: 70 (54.7%)
Finished Master Degree study: 22 (17.2%) Finished Ph.D. Degree study (or equivalent): 2 (1.6%)
Question 4: What is your field of education?
Business related: 97 (75.8%) Non-business related: 14 (10.9%)
Both business and non-business related: 15 (11.7%)
Unclassified: 2 (1.6%) Question 5: Did you (or are you)
learn the subject of “Literature Review” in Research Methods in your formal education?
Yes: 86 (67.7%) No: 33 (26.0%)
Cannot remember: 8 (6.3%) Question 6: Do you (or did you) feel
that you have difficulty to understand the subject of Literature Review during your study of Research Methods (or other courses) for your formal education?
Yes, I strongly feel so: 24 (18.8%) I have this feeling mildly: 58 (45.3%)
I feel it is not difficult to understand: 30 (23.4%) No feeling at all/ Not applicable: 16 (12.5%)
Question 7: Do you (or did you) feel that academic journal articles are difficult to understand during your study for your formal education?
Yes, I strongly feel so: 26 (20.3%) I have this feeling mildly: 60 (46.9%)
I feel it is not difficult to understand, in general: 35 (27.3%)
No feeling at all: 7 (5.5%) Question 8: Do you (or did you) use
the University e-library to access academic journal articles to do your course assignments and dissertation projects?
Yes, I do: 93 (72.7%) No, I don’t: 31 (24.2%) Cannot remember: 4 (3.1%)
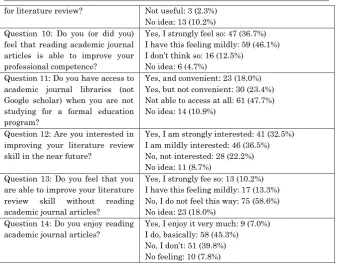
Question 9: Do you (or did you) feel that academic articles are useful
for literature review? Not useful: 3 (2.3%) No idea: 13 (10.2%) Question 10: Do you (or did you)
feel that reading academic journal articles is able to improve your professional competence?
Yes, I strongly feel so: 47 (36.7%) I have this feeling mildly: 59 (46.1%) I don’t think so: 16 (12.5%)
No idea: 6 (4.7%) Question 11: Do you have access to
academic journal libraries (not Google scholar) when you are not studying for a formal education program?
Yes, and convenient: 23 (18.0%) Yes, but not convenient: 30 (23.4%) Not able to access at all: 61 (47.7%) No idea: 14 (10.9%)
Question 12: Are you interested in improving your literature review skill in the near future?
Yes, I am strongly interested: 41 (32.5%) I am mildly interested: 46 (36.5%) No, not interested: 28 (22.2%) No idea: 11 (8.7%)
Question 13: Do you feel that you are able to improve your literature review skill without reading academic journal articles?
Yes, I strongly fee so: 13 (10.2%) I have this feeling mildly: 17 (13.3%) No, I do not feel this way: 75 (58.6%) No idea: 23 (18.0%)
Question 14: Do you enjoy reading academic journal articles?