APPLICATION OF CLUTTER SUPPRESSION METHODS TO A GEOSTATIONARY WEATHER RADAR CONCEPT
S. L. Durden and S. Tanelli
Jet Propulsion Laboratory
California Institute of Technology
4800 Oak Grove Dr., Pasadena, CA 91109, USA
Abstract—While a geostationary weather radar would enable unprecedented monitoring of hurricanes and other severe weather, surface clutter could seriously limit its performance. The large incidence angles necessary for wide-area coverage, combined with the footprint size could cause surface clutter to obscure atmospheric return up to several km above the surface. The authors describe a Doppler filtering approach to clutter suppression and show simulation results. They find that Doppler filtering can significantly reduce the surface return, bringing surface clutter to acceptable levels. The authors then consider this approach when a staggered pulse repetition frequency is used to improve the maximum unambiguous velocity. They find that a method previously developed for ground-based weather radars can be successfully applied.
1. INTRODUCTION
Spaceborne radar observation of clouds and precipitation began with the launch of the Tropical Rainfall Measuring Mission (TRMM) in 1997 [1] and has continued with the launch of CloudSat in 2006 [2]. A variety of follow-on missions have been planned or recommended, including a conceptual design of a geostationary weather radar, dubbed “NEXRAD-in-Space” (NIS) [3]. A weather radar in geostationary orbit is highly desirable owing to its unique ability to simultaneously provide vertical rainfall profiles, wide spatial coverage, and frequent observations (e.g., hourly or better); these characteristics make it well-suited to operational monitoring of hurricanes and severe storms. One
of the many challenges in implementing such a radar is clutter from the surface, particularly at the large incidence angles required for good areal coverage from geostationary orbit. In this letter we provide a brief summary of the NIS design and an analysis of the clutter problem. We then present a solution using Doppler filtering with a staggered pulse repetition frequency (PRF).
2. NIS OVERVIEW AND CLUTTER PROBLEM
The NIS instrument is designed to measure reflectivity and Doppler velocity at 35 GHz from geostationary orbit at an altitude of about 36,000 km [3]. Table 1 shows the instrument characteristics. The instrument uses a spherical reflector antenna and mechanically scanned feed system with spherical aberration correction [4]. The spherical design was chosen so that the beam quality does not degrade with scan angle, as would be the case for a parabolic shape. The beam is scanned from 0◦ to 4◦ off-nadir to provide full coverage of a 5200 km circular area on the earth’s surface. Because of the earth’s curvature, a look angle of 4◦ off nadir results in an incidence angle of 28◦ relative to the earth’s surface. With the planned 28-m aperture reflector (effective illuminated area for any given beam), the beam size is roughly 12 km. At 28◦ incidence the beam tilt results in an effective vertical resolution of nearly 6 km (12 sin 28◦). Hence, clutter from the earth’s surface return could potentially affect the first 6 km above the surface at the edge of the scan. Since most liquid water is in the first five km, this presents a serious challenge in monitoring the full coverage area. The vertical extent of the surface clutter effect is reduced towards the center of the scan to the limit given by the actual shape of the radar’s point
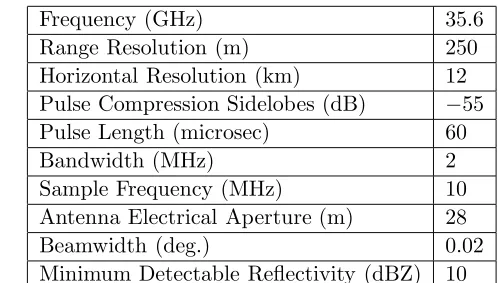
Table 1. Key NIS system parameters.
Frequency (GHz) 35.6
Range Resolution (m) 250
Horizontal Resolution (km) 12 Pulse Compression Sidelobes (dB) −55
Pulse Length (microsec) 60
Bandwidth (MHz) 2
Sample Frequency (MHz) 10
Antenna Electrical Aperture (m) 28
Beamwidth (deg.) 0.02
target response (roughly 200 m).
Using a model antenna pattern, a typical ocean backscatter at 28◦, and an expected system noise level, we find that the clutter at 1 km altitude could exceed the system noise by up to 45 dB, seriously limiting sensitivity. If a layer of rain were present, the attenuation at 35 GHz in the rain would reduce the surface clutter. For example, a 5-km thick layer of rain with 10-mm/h rain rate would have a round-trip attenuation of 25 dB, based on Mie scattering calculations. Even so, the surface return would still be 20 dB above the system noise; hence, clutter suppression is needed to enable the NIS concept.
3. CLUTTER SUPPRESSION METHOD
To reliably reduce clutter, we consider using Doppler clutter cancellation methods, as have been applied to ground-based weather radar [5]. These methods are not applicable to low-earth orbit precipitation radars because of the large platform motion. However, for NIS the geostationary platform motion (relative to the earth’s surface) is expected to be very small, so investigation of these techniques is reasonable. We assume that the mean motion of clutter is zero, with a velocity spread of 1 m/s due to random motions of the ocean surface and spacecraft. The ocean component is expected to dominate; if two-scale scattering theory (e.g., [6]) holds, the Doppler spectrum width should be determined by the wave orbital motions of the long wave spectrum. Measurements indicate that the ocean Doppler width should be less than about 1 m/s [7]. The expected precipitation spectrum has a maximum width of 4 m/s dominated by effects of varying fall velocities, turbulence, cross-beam effects, and non-uniform beam-filling [8, 9].
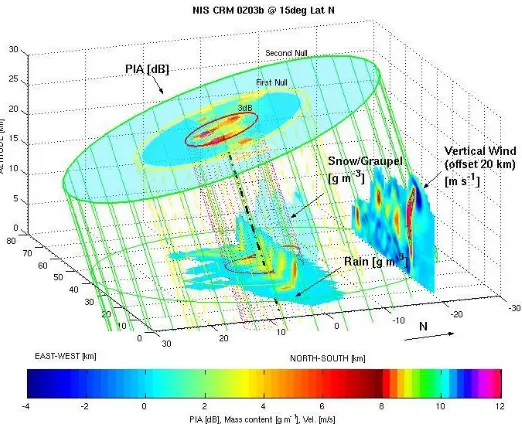
Figure 1. Geometry for Doppler clutter cancellation simulation. The NIS beam intersects a simulated mesoscale convective system (MCS).
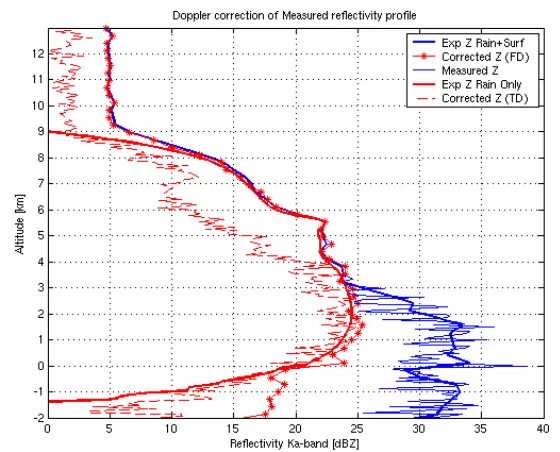
Figure 3. Reflectivity Z versus altitude. Blue solid thick line is the expectation of the measured reflectivity, and blue dashed line includes fading noise. Red solid thick curve is the ‘truth’, i.e., expectation of the rain reflectivity, without surface clutter. Red dashed is notch filtering in time domain (TD) and red with asterisk is notch filtering in frequency domain (FD), with additional processing described in text.
Also, a Gaussian assumption on the spectral characteristics of the rain can mitigate the ‘notching’ of any portion of the rain spectrum that is masked by ground clutter. The effectiveness of this approach relies on the fact that it is unlikely for the rain spectrum to be at the same time centered on the zero-Doppler line and have a spectral width smaller than that of the underlying surface. Application of the knowledge of both clutter location and rain spectral shape is conveniently done in the altitude-frequency domain (e.g., Fig. 2). First, a least mean square Gaussian fit is used with a fixed mean at zero-Doppler and free width and amplitude parameters; the resulting best fit is the surface clutter spectrum PSC which is removed from the observed spectrum POBS (notch filter). All portions of the residual spectrum
PR =POBS−PSC where PR> PSC are used for a second least mean square Gaussian fit (with all three parameters free). The resulting fit is the estimated rain spectrum, and its integral is the estimated rain contribution to the total reflectivity. The resulting profile of reflectivity (red with asterisk) is similar to the ‘truth’ profile, from the surface (0 km altitude) to the top of the observed profile indicating that the notch filtering has successfully removed clutter. In the example shown, clutter suppression is roughly 15 dB.
4. CLUTTER SUPPRESSION WITH A STAGGERED PRF
Simulations with various model precipitation systems indicate that Doppler filtering as discussed in the previous section can be used to significantly reduce clutter and improve sensitivity close to the surface. However, Doppler filtering is most easily applied to data with a constant pulse repetition frequency (PRF), (i.e., constantT, the pulse repetition interval PRI, the reciprocal of the PRF). In fact, a staggered PRF is likely needed for NIS to resolve ambiguities [5]. For a uniform PRF of 7 kHz the maximum unambiguous velocity λ/4T is 15 m/s; larger velocities will be folded into this interval and use of aliasing correction algorithms similar to those developed for ground based weather radars would be necessary. Use of larger PRFs is complicated by the need for unambiguously resolving the lower troposphere. For a staggered PRF, where an interval T1 is followed by an interval
T2, the maximum unambiguous velocity is λ/4(T1 −T2) [5]. The advantage is that the effective period isT1−T2substantially increasing the maximum unambiguous velocity without reducing the maximum unambiguous range. The disadvantage is that clutter filtering becomes much more challenging.
series to create a new time series with very high sample rate. This has the effect of creating additional clutter images at other frequencies in the spectrum, so that clutter filtering involves removing the clutter at zero and these other frequencies. We can do this by applying notch filters at zero and the other clutter frequencies or we can apply the frequency domain method of Sachidananda and Zrnic [10, 11] to remove clutter but leave signal. We choose the second approach, since it can be combined with the frequency domain method of the previous section to remove clutter while preserving the rain spectrum. Although the Sachidananda and Zrnic method was developed for S-band weather radar, it is applicable to our Ka-band radar concept.
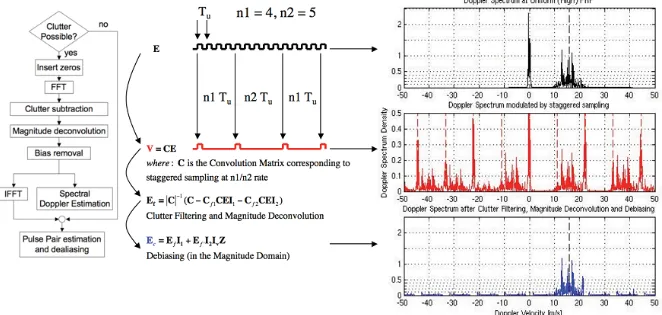
Given our desired maximum unambiguous velocityva, the required PRI for a uniform PRF is Tu = λ/4va. The PRIs for staggered operation are then derived as integers n1 and n2 times Tu. The received signal at the high rate (after inserting zeros) is a uniform series with spacing Tu modulated by a train of 1’s and 0’s. In the frequency domain the measured spectrum is the convolution of the true spectrum with the spectrum of the modulating sequence. The modulating spectrum consists of spikes of varying amplitudes spaced at n/(n1 +n2) frequency bins, where n is the number of samples at the high rate. This is illustrated in Fig. 4 for the case of n1 = 4 and
n2 = 5 and Tu corresponds to 18 kHz PRF; to the left of the frames are explanations of the steps for generating each frame. The top frame is the spectrum that would be observed if the PRF corresponding to
Tu is used. The spectrum for the staggered PRF sequence is shown in
the middle frame; it can be seen that the true spectrum is convolved with a sequence of spikes, giving replicas of the ground clutter at non-zero locations. The staggered PRF signal discrete Fourier Transform (DFT) is V = CE, where C is the modulation matrix and E is the DFT corresponding to the spectrum in the upper frame. The method of Sachidananda and Zrnic [10, 11] reconstructsEwith clutter removed by first subtracting a clutter estimate and then performing a magnitude deconvolution; this is followed by debiasing as shown in the description to the left of the frames. The lower frame shows the spectrum after using the Sachidananda and Zrnic method. In our implementation, the portion of spectrum thus removed is filled with values obtained by interpolating the residual portion of the spectrum. Alternatively the same Gaussian fit approach described in the previous section can be implemented. The resulting spectrum is similar to that for the hypothetical high PRF case; it can be used directly to obtain clutter-free estimates of reflectivity and mean Doppler velocity, or it can be inverse transformed to apply a staggered pulse-pair algorithm for the same purpose [5]. Both approaches were tested in this work and they produce generally comparable results with differences in performance dictated mainly by the specific scenarios and configurations. We tested other values of n1 and n2 besides 4 and 5. We found that 4 and 5 provide best results for NIS. Smaller numbers require PRFs that are too large, causing range ambiguities. Large numbers result in estimates that are too noisy, due to the small difference in PRFs.
simulated results show a surface clutter rejection of about 20 dB in case of 2-sigma separation (i.e., the centers of the two spectra are separated by more than twice the sum of their widths), decreasing to about 4 dB for 1-sigma separation. The most challenging scenarios are obviously those where rain and surface spectra are entirely overlapped; in this case useful performance seems achievable only for moderately broad rain spectra (i.e., 2 m/s or more). The main limitation of the method thus occurs when the rain spectrum is both narrow and centered at zero Doppler. Fortunately, this case requires light rain and a wind component of around 5 m/s in the radar look direction; this is an unlikely situation in the severe weather and hurricanes that would be targeted by NIS. Our results indicate that while clutter presents a significant challenge for NIS, Doppler filtering can significantly reduce its effects, even when using a staggered PRF.
ACKNOWLEDGMENT
This research was carried out at the Jet Propulsion Laboratory, California Institute of Technology, under a contract with the National Aeronautics and Space Administration. Support from the NASA Earth Science Technology Office is appreciated.
REFERENCES
1. Kozu, T., T. Kawanishi, H. Kuroiwa, M. Kojima, K. Oikawa, H. Kumagai, K. Okamoto, M. Okumura, H. Nakatsuka, and K. Nishikawa, “Development of Precipitation Radar onboard the Tropical Rainfall Measuring Mission (TRMM) satellite,” IEEE Trans. Geosci. Remote Sensing, Vol. 39, 102–116, 2001.
2. Tanelli, S., S. L. Durden, E. Im, K. Pak, D. Reinke, P. Partain, J. Haynes, and R. Marchand, “CloudSat’s Cloud Profiling Radar after two years in orbit: Performance, external calibration, and processing,”IEEE Trans. Geosci. Remote Sensing, Vol. 46, 3560– 3573, 2008.
3. Im, E., E. A. Smith, S. L. Durden, S. Tanelli, J. Huang, Y. Rahmat-Samii, and M. Lou, “Instrument concept of NEXRAD In Space (NIS) – A geostationary radar for hurricane studies,” Proc. Int. Geosci. Remote Sens. Symp, 2003.
5. Doviak, R. J. and D. S. Zrnic, Doppler Radar and Weather Observations, 2nd Edition, Academic Press, San Diego, 1993. 6. Wu, Z.-S., J.-P. Zhang, and L.-X. Guo. “An improved two-scale
model with volume scattering for the dynamic ocean surface,” Progress In Electromagnetics Research, PIER 89, 39–56, 2009. 7. Plant, W. J. and W. C. Keller, “Evidence of Bragg scattering
in microwave Doppler spectra of sea return,” J. Geophys. Res., Vol. 95, 16299–16310, 1990.
8. Meneghini, R. and T. Kozu, Spaceborne Weather Radar, Artech House, Boston, MA, 1990.
9. Amayenc, P., “Proposal for a spaceborne dual-beam rain radar with Doppler capability,” J. Atmos. Oceanic Technol., Vol. 10, 262–276, 1993.
10. Sachidananda, M., and D. S. Zrnic, “Clutter filtering and spectral moment estimation for Doppler weather radars using staggered pulse repetition time (PRT),”J. Atmos. Oceanic Technol., Vol. 17, 323–331, 2000.
11. Sachidananda, M., and D. S. Zrnic, “An improved clutter filtering and spectral moment estimation algorithm for staggered PRT sequences,”J. Atmos. Oceanic Technol., Vol. 19, 2009–2019, 2002. 12. Zrnic, D. S., “Simulation of weatherlike Doppler spectra and