Scholarship@Western
Scholarship@Western
Electronic Thesis and Dissertation Repository
8-27-2014 12:00 AM
Inter-relationships of functional status in children with cerebral
Inter-relationships of functional status in children with cerebral
palsy: An extension
palsy: An extension
Emily Dyszuk
The University of Western Ontario
Supervisor Doreen Bartlett
The University of Western Ontario
Graduate Program in Health and Rehabilitation Sciences
A thesis submitted in partial fulfillment of the requirements for the degree in Master of Science © Emily Dyszuk 2014
Follow this and additional works at: https://ir.lib.uwo.ca/etd
Part of the Rehabilitation and Therapy Commons
Recommended Citation Recommended Citation
Dyszuk, Emily, "Inter-relationships of functional status in children with cerebral palsy: An extension" (2014). Electronic Thesis and Dissertation Repository. 2390.
https://ir.lib.uwo.ca/etd/2390
This Dissertation/Thesis is brought to you for free and open access by Scholarship@Western. It has been accepted for inclusion in Electronic Thesis and Dissertation Repository by an authorized administrator of
(Thesis format: Monograph)
by
Emily Dyszuk
Health and Rehabilitation Sciences
A thesis submitted in partial fulfillment of the requirements for the degree of
Master of Science
The School of Graduate and Postdoctoral Studies The University of Western Ontario
London, Ontario, Canada
ii
Abstract
The primary aim of this study was to establish functional profiles for children with cerebral palsy (CP), by determining the relationships between three classification systems (the Gross Motor Function Classification System, the Manual Ability Classification System, and the Communication Function Classification System). The secondary aim of this study was to investigate the number and impact of associated health conditions in the most prevalent clusters. Data were analyzed on 222 children with CP with an average age of 6.1 years, from several locations across North America. A total of 56 out of 125 possible combinations were recorded; four most prevalent cell combinations arose. The number and impact of associated health conditions increased incrementally as functional ability decreased. The use of these three functional systems, combined with data on associated health conditions, provides a holistic picture of CP to be used for practical and clinical purposes.
Keywords
iii
Acknowledgments
iv
Table of Contents
Abstract ... ii
Acknowledgments ... iii
Table of Contents ... iv
List of Tables ... vi
List of Appendices ... vii
List of Abbreviations ... viii
Chapter 1 Introduction ... 1
Chapter 2 Literature Review ... 2
2.1 Population of Interest: Cerebral Palsy ... 2
2.2 Non-Functional Classification Systems and Groupings ... 3
2.3 The International Classification of Functioning, Disability and Health and Cerebral Palsy .. 4
2.4 Functionality ... 5
2.5 Functional Classification Systems ... 6
2.5.1 Gross Motor Function Classification System ... 6
2.5.2 Manual Ability Classification System ... 7
2.5.3 Communication Function Classification System ... 8
2.6 Relationships among Functional Classification Systems ... 9
2.7 Associated Health Conditions ... 11
2.8 Summary of Literature Review ... 13
Chapter 3 Objectives ... 14
Chapter 4 Methods ... 15
4.1 Study Design ... 15
4.2 Sample ... 15
v
4.4 Data Collection Procedures ... 18
4.5 Data Analysis ... 19
Chapter 5 Results ... 21
5.1 Bivariate Correlations ... 21
5.1.1 Gross Motor Function Classification System – Manual Ability Classification System ... 21
5.1.2 Manual Ability Classification System – Communication Function Classification System ... 21
5.1.3 Gross Motor Function Classification System – Communication Function Classification System ... 21
5.2 Relationship among all Three Functional Classifications ... 21
5.3 Prevalence and Impact of Associated Health Conditions ... 23
Chapter 6 Discussion... 26
6.1 Summary of the Results ... 26
6.2 Comparison of Results to Existing Literature ... 27
6.3 Clinical Significance ... 29
6.4 Limitations ... 31
6.5 Future Research ... 31
6.6 Conclusions ... 31
References ... 33
Appendices ... 40
vi List of Tables
Table 1: Child Demographics ... 16
Table 2: Parent Demographics ... 17
Table 3: Inter-relationships of all Three Functional Classifications ... 22
Table 4: Average Number and Impact of Prevalent Associated Health Conditions ... 24
Table 5: Proportion of Each Associated Health Condition in the Four Most Prevalent Groups ... 25
vii
List of Appendices
Appendix A: Western’s Ethics Approval ... 40
Appendix B: Consent and Assent Forms ... 43
Appendix C: Gross Motor Function Classification System ... 52
Appendix D: Manual Ability Classification System ... 56
Appendix E: Communication Function Classification System ... 59
Appendix F: Child Health Conditions Questionnaire ... 63
Appendix G: Family Information Form ... 69
Appendix H: Parents’ Classifications and Booklet Instructions ... 77
Appendix I: Assessors’ Classifications and Booklet Instructions... 91
viii
List of Abbreviations
ASD: Autism Spectrum Disorder
CFCS: Communication Function Classification System
CP: Cerebral palsy
GMFM: Gross Motor Function Measure
GMFCS: Gross Motor Function Classification System
GMFCS – E&R: Gross Motor Function Classification System: Expanded and Revised
ICF: The International Classification of Functioning, Disability and Health
ICF-CY: The International Classification of Functioning, Disability and Health for Children and Youth
ICIDH: International Classification of Impairment, Disabilities and Handicap
MACS: Manual Ability Classification System
MRI: Magnetic Resonance Image
rs: Spearman’s correlation coefficient
SCPE: Surveillance of Cerebral Palsy in Europe
Chapter 1
Introduction
International consensus was achieved to establish the current definition for cerebral palsy (CP) by Rosenbaum, Paneth, Leviton, Goldstein, and Bax, “as a group of permanent disorders of the development of movement and posture, causing activity limitation, that are attributed to non-progressive disturbances that occurred in the developing fetal or infant brain. The motor disorders of cerebral palsy are often accompanied by disturbances of sensation, perception, cognition, communication and behaviour, by epilepsy, and by secondary musculoskeletal problems.” (1, pg. 9)
CP is the most common physical disability in children occurring in 2 to 2.5 per 1,000 live births. (2)
CP is a heterogeneous condition in which every child presents with a variety of different
characteristics. Much like the definition of CP was redefined to take into account recent advances in brain development and to improve the lines of communication between families and health professionals, (1) there is a need for meaningful classification systems. Classification systems
allow for children to be categorized into various groups for description, prediction, and comparison purposes. (1)
The International Classification of Functioning, Disability and Health (ICF) (3) framework has been
adopted by clinicians and researchers who work with children with CP. The ICF has changed how children with CP are classified as it places emphasis on the child’s functional abilities and typical performance rather than their health condition. (3,4) Classification tools have been developed to
describe and assess how a child functions in daily activities, (5) like walking, (6) handling objects, (7)
and everyday communication. (8) Functional activities in a child’s life can be assessed by using
valid and reliable tools such as the Gross Motor Classification System (GMFCS), (6) the Manual
Ability Classification System (MACS), (7) and the Communication Function Classification System
(CFCS). (8)
Chapter 2
Literature Review
Understanding the definition and diagnosis of CP is an important concept for individuals with CP, their families, and health care professionals to grasp, as it is a diverse health condition. Several classification schemes for CP have been adopted in general practice to aid in this process. There are two general types of classification systems that individuals should be aware of: non-functional and functional. The next section provides a more complete understanding of these two types of classification systems, focusing primarily on the benefits and relationships among functional classification systems. The next section begins with a further description of cerebral palsy and elaborates upon the utility of the ICF with respect to a focus on function.
2.1
Population of Interest: Cerebral Palsy
CP is a lifelong disability that is most noticeably characterized by a motor disorder, as is it defined as a group of non-progressive, non-contagious motor conditions that cause physical disability in human development, mainly in areas of body movement. (1) As previously mentioned, CP is the
most prevalent physical disability occurring in children, (2) more frequently occurring in males due
to intrinsic differences in chromosomal complements. (9) A diagnosis of CP is typically given in the
early years of life when its effects are manifested. (10) CP was recognized more than 150 years
ago (11) and since then several revisions have been made to the definition and various
classification systems have been developed to provide a more conclusive understanding of this complex condition.
There is no common cause of CP, making the diagnosis difficult at times because CP is an umbrella term for several brain anomalies. (1,12) Factors like genetics, disease, brain injury,
infections, and anoxic injuries to the developing brain can cause CP. (13) Subtypes of CP can be
detected in some cases from a Magnetic Resonance Imaging (MRI) scan that identifies the location and type of brain injury. (14,15) Children who are diagnosed with CP can then be placed into
subgroups based on different classification criteria. Various classification systems serve different purposes as they emphasize specific characteristics of CP, (1) often broken down into
2.2
Non-Functional Classification Systems and Groupings
There are three primary methods to classify children with CP from a non-functional perspective: 1. causation and neuroimaging 2.type of motor disorder; 3. distribution of involvement. Etiologic classification is not as popular and has not been found to be successful in addressing the primary goal of prevention. (16)
Currently there is no singular and definite explanation for the causation of CP, just potential risk factors and associations that by themselves or in conjunction with each other may cause CP. (17)
Previously it was thought that the main cause of CP could be linked to an interruption in oxygen supply to the brain of the fetus. (18) However, more recent research indicates that asphyxial birth is
a small contributor to the cause of CP and disturbances such as malformations, arterial ischemic strokes, and/or exposure to in utero infections and inflammation, in term and near-term infants are more predominant causes. (19,20)
Classifying children by neuro-imaging findings is something that is anticipated to happen in the future, when it becomes more feasible. (13) Neuro-imaging is currently useful in determining
structural or functional relationships with children with CP (21,22) and aids in the understanding of
the etiology and pathologies of CP. (23) Neuroimaging through the use of an MRI or computed
tomography detects abnormal neuroradiological findings in 80 to 83% of children with CP, depending on the study. These abnormal neuroradiological findings show that white matter damage is the most common abnormality. (15,23,24) In a large population-based study investigating
term and near-term infants, 32% displayed acute brain injury that occurred around the time of birth, including acute perinatal focal arterial infraction, hypoxic-ischemic brain injury, and intracranial hemorrhage. (25) A similar study supports these neuroimaging findings, linking the experience of a
perinatal or neonatal event to the development of CP (36%). (26) In the future, it is anticipated that
neuroimaging will continue to assist in increasing understanding of brain abnormalities and further allow establishment of the timing and possible caustions of these brain abnormalities present in children with CP. (15,27)
The Surveillance of Cerebral Palsy in Europe (SCPE) classifies children with CP in a hierarchical manner based on their predominant medical disability. (28) The SCPE formed a network in Europe
classification system for describing children with CP for population-based registers. (29) Children
with CP can be classified into two main physiologic groups: pyramidal and extrapyramidal.
Pyramidal refers to CP in which spasticity is the predominant sign. The extrapyramidal subgroup is associated with the type of motor disorder referring to ataxia and dyskinetic, the latter of which is further subdivided into choreo-athetosis and dystonia. (30) This method has been adopted in
Europe to classify children with CP, sometimes adding in a final group of “mixed” or other. (29)
Healthcare providers in Europe and Australia further classify individuals with CP based on their predominant limb distribution: quadriplegia, triplegia, diplegia, and hemiplegia adding more detail to the classification. (29) In a surveillance study conducted in Europe, traditional clinical terminology
for describing the subtypes of CP referred to the child’s limb distribution or motor impairment, (29)
however this method of classification is viewed as unreliable. (31)
Generally, physiologic and topographic classifications like the ones previously mentioned have poor reliability and validity and do not incorporate functional abilities, focusing primarily on impairments of the condition. (32) These classification systems provide limited assistance in
therapeutic decision making and do not provide a clear and concise understanding of how a child with CP functions in daily life.
2.3
The International Classification of Functioning, Disability and Health
and Cerebral Palsy
The International Classification of Impairment, Disabilities and Handicap (ICIDH) was a model of disablement focusing on the negative aspects of the disability and how it limited an individual or handicapped them. (33) The World Health Organization (WHO) redefined the ICIDH and developed
the ICF to provide a common and universal language and terminology for classifying individuals based on body functions and structures, activity and participation, and environmental and personal factors. New to the ICF is the incorporation of two contextual factors: environmental and personal.
(3) The International Classification of Functioning, Disability and Health for Children and Youth
The focus of the ICF shifted from the negative aspects of the associated health conditions, to looking at the functional potential in individuals and replacing the word ‘disability’ with activity limitation and ‘handicap’ with participation restriction. (3) The ICF has both a conceptual framework
and a coding system. The ICF conceptual framework can be useful because it demonstrates the nonlinear connection between the associated health conditions (e.g. CP) and body functions and structures, activities and participation, and environmental and personal factors. (35) The coding
system, although extensive, lacks the ability to classify children by their developmental functional abilities. (36,37)
The ICF plays a prominent role in the definition and rehabilitative goals of CP (35). As previously
indicated, activity limitation involving motor function is a defining feature of CP. (1) Children with
CP generally have lower levels and less intensity of participation compared to children developing typically, partially due to their limitations in functional abilities. (38,39) The promotion and emphasis
placed on the significance of the ICF concepts activity and participation is an important outcome for children with CP because it helps develop friendships, personal interests, and identities and enhances skills of competencies. (35,40) Focusing on children’s functional abilities can help to
enhance participation at school, as a positive relationship was observed between increased levels of participation and Intelligence Quotient levels, as well as increased levels of daily communication.
(40,41) The ICF has established this by changing the perspective of CP from a child with a disease
to focus on the child’s functional ability. (4)
2.4
Functionality
Functional skills refer to activities that are performed in day-to-day life, like walking, sitting, eating, dressing, and communicating which allow individuals to participate in life situations. (42) As
previously indicated, assessing and emphasizing a child’s capabilities rather than their limitations is a key concept of the ICF, playing an integral role in the definition of CP. (3) There is a greater
emphasis on the promotion of functional skills in children with CP than there has been in the past.
(43,44) Researchers are advocating that rehabilitative goals should focus more on children
mastering activities of daily living instead of focusing on the movement impairments. (45)
Functional profiles can be used to help improve communication between families and health care professionals and helpful in a clinical setting for rehabilitation purposes. (46) Functional profiles, like
a more holistic picture about the relationships among domains such as mobility, handling objects, and communication.
2.5
Functional Classification Systems
Functional classification systems focus on a child’s functional abilities and what they can do instead of grouping them by their impairments. Functional classifications allow for children with CP to be classified into categories or levels based on similar abilities. (5,47) In this study, three
functional classification systems, the GMFCS, MACS, and CFCS, when combined are proposed to establish a holistic picture of a child’s everyday life.
2.5.1 Gross Motor Function Classification System
The GMFCS is a functional classification system that takes into consideration a child’s self-initiated movement, with emphasis on sitting, transfers, and mobility, providing a standardized system to measure the ‘severity of movement disability’. (5) The expanded and revised Gross Motor Function
Classification System (GMFCS – E&R) was developed to expand the inclusion age for children up to the age of 18 years and to incorporate the ICF’s environmental and personal factors into the classification system. (6)
There are 5 levels (I to V) that make up the system and form an ordinal scale. Children, between 6 and 12 years of age, in level I can walk without limitations on all surfaces. Children in level II walk with some limitations, often when walking on uneven surfaces outdoors. Children in level III
require a hand-held mobility device indoors and may require the use of a wheeled device outdoors. Children in level IV generally have self-mobility with limitations, control of their head, and may use a powered mobility device. Children in level V typically require a manual wheelchair to move and have severe limitations with head and neck control. Each level is broken down into 5 age bands: before the age of 2, between the ages of 2 to 4 years, 4 to 6 years, 6 to 12 years, and between the age of 12 and 18 years. (6) The differences between each level are based on variations in
functional limitations. Although GMFCS levels provide a good understanding of the child’s walking abilities, gross motor function is not the only defining feature of children with CP.
children between 2 and 12 years of age. (5) Higher interrater reliability between therapists, of a
Kappa coefficient of 0.98, was examined in a smaller sample of children with CP and
periventricular white matter injury. (48) Excellent construct validity was established for GMFCS
levels, byPalisano and colleagues by observing the correlations between GMFCS levels and Gross Motor Function Measure (GMFM) (49) scores (r = - 0.91). (50) Content validity has been
established for the GMFCS – E&R through Delphi survey (6) and interrater reliability for the older
age group of 12 to 18 years of age has been established for the Turkish, Portuguese-Brazil, and Chinese versions of the GMFCS – E&R. (51,52,53) The GMFCS is used internationally and is
available in several different languages. (54) Predictions of the average development of GMFCS
levels have been constructed and support the validity of the classification system. The Ontario Motor Growth curves relate the Gross Motor Function Measure – 66 (GMFM-66) (49) score to age
and display the differences among the GMFCS levels and reveal that children reach 90% of their motor function by 5 years of age. (55) The system has achieved its original purpose and is used as
a simple and well-recognized method to classify children with CP and has demonstrated increased use in clinical and family-centered practice. (56) As mentioned earlier, the GMFCS- E&R
incorporated the ICF concepts and examined the environmental and personal factors impact on a child’s functional performance. (6)
2.5.2 Manual Ability Classification System
The MACS parallels the general concept of the GMFCS, in that it observes the child’s usual performance in everyday life; however, it focuses on the child’s fine motor movement, classifying what a child regularly does with his or her hands in daily life rather than an individual’s best capacity. To ensure that this concept of the child’s regular performance is captured in the classification, a parent or caregiver is involved in the classification process, as they witness the child’s hand behaviour in daily routines in natural environments. (7)
The design structure of the MACS is similar to that of the GMFCS, in that there are five levels (I to V) which make up an ordinal scale. In Level I, the child easily handles objects independently with no ability restrictions. In level II, the child is able to handle most objects, but may struggle
selection of easily managed objects in adapted situations and require monitoring to ensure continued success with adaptations. In level V, the child requires full assistance to handle an object. Unlike the GMFCS, there are no age bands included in the classification system. Instead, age appropriate objects and activities are taken into consideration when classifying at how a child performs bilateral hand movements. (7)
The MACS is a valid, reliable, and stable classification system for children between the ages of 4 to 18 years. (57,58) Reliability for children aged 2 to 5 was found to be good in one study with a
weighted Kappa of 0.67; however, further development of the validly and reliability for using MACS on children under the age of 4 is suggested. (59) High interrater reliability was established between
therapists with an intraclass correlation coefficient (ICC) of 0.97 and between parents and therapists with an ICC of 0.96. (7) In another study a slightly higher interrater reliability was
observed between therapists with a Kappa coefficient of 1.0. (48) The reliability of using the MACS
was reaffirmed with ICC values ranging from 0.66 to 1.0 among professionals and 0.73 to 0.85 between parents and health professionals. (57) The GMFCS and the MACS focus on the child’s
gross and fine motor ability; however, it is important to look at all aspects of children’s lives, including how they communicate with others.
2.5.3 Communication Function Classification System
The third functional classification system, the CFCS, classifies children with CP according to their everyday communication performance. (8) Five levels (I to V) form the ordinal scale for children
between the ages of 4 and 18 years. A child with level I is effective at communicating with
unfamiliar and familiar partners at a typical conversational pace. In level II, the child communicates with unfamiliar and familiar partners with a slower pace. A child with level III communicates
effectively with people that he or she is familiar with, but not with people who are unfamiliar. A child with level IV demonstrates inconsistent communication with familiar partners. A child with level V rarely demonstrates effective communication with familiar partners. (8) Similar to the MACS, the
level is determined by a parent or caregiver who is familiar with the child’s daily communication abilities and a health professional and distinct age bands have not been incorporated.
using a weighted Kappa. Among professionals it was 0.66 and improved to 0.77 when used on children 5 years of age and older. Interrater reliability was moderate between parents and health professionals with a weighted Kappa of 0.49 and decreased to 0.42 for children who were 5 years of age and older. (8) A strong interrater reliability between therapists was examined in children with
CP and periventricular white matter injury, with a Kappa coefficient of 0.98. A possible explanation for this higher interrater reliability is due to a small sample and narrow variance between raters. (48)
Test-retest reliability for professionals was strong with a weighted Kappa of 0.82. (8,48)
The GMFCS, MACS, and CFCS all have a similar parallel structure in their design concepts. All three classification systems focus on the child’s functional ability examining their everyday performance, have 5 levels on an ordinal scale, and are designed for children with CP. However, unlike the GMFCS and MACS which focus primarily on the individual’s motor function, the CFCS focuses more on the individual’s participation in communication, providing a more complete description of all aspects of the functional abilities of a child with CP.
2.6
Relationships among Functional Classification Systems
Understanding the relationship among different classification systems is receiving more attention as this understanding provides clinicians, researchers, and families with a greater appreciation of the functional abilities of children with CP. More research has been conducted on the relationships between the GMFCS and the MACS, compared to the CFCS, because the MACS was established prior to the CFCS. One study found an overall poor association between the GMFCS and the MACS with a Kappa value of 0.32. (60) However, it was noted that the relationship between the
GMFCS and MACS classification systems were complementary to each other providing a more complete description of the functional abilities of a child with CP, (4,60,61)as they are constructed
from the same ICF concepts and focus on the child’s usual abilities in the home, school, and community. (60,62) The GMFCS and MACS was used to assess upper limb function in individuals
with spastic CP, comparing unilateral and bilateral hand movement. Common profiles were not observed in Park and colleague’s research, as 53.5% of the study exhibited different levels of GMFCS and MACS with a weighted Kappa of 0.55 between systems. Correlations between GMFCS and MACS for children with unilateral hand movement were lower (rs = 0.60) compared to
variation in bimanual activities and gross motor function in children with CP and further research should be conducted on a population-based sample to support the evidence.
The GMFCS, MACS, and CFCS provide complementary systems for health professionals and researchers to describe the functional abilities of children with CP. To date, only one paper has described the functional relationships among the GMFCS, MACS, and CFCS. (46) However, one
paper observed the relationship among the CFCS, CP subtype, gross motor function, manual ability, cognitive function and neuroimaging findings. (64) This study found that communication
profiles existed and could be derived from the CFCS because it correlated to gross motor, fine motor, and cognitive functions. (64) Although this study found functional communication profiles it
did not report the relationship among all three classification systems providing an overall functional profile. It reported associations of the CFCS to the GMFCS and the CFCS to the MACS. A strong correlation with both the GMFCS and MACS was found according to Spearman’s correlation coefficient of 0.78 and 0.80, respectively. This study provided a more in-depth understanding of the communication abilities of children with CP and their association to CP subtype, gross and fine motor function, and cognitive function.
Hidecker and colleagues established functional profiles for children with CP by combining these three classification systems. (46) In terms of the bivariate relationships, the GMFCS and the MACS
were strongly correlated (rs = 0.69), the MACS and the CFCS were moderately correlated (rs =
0.54), and the GMFCS and the CFCS were moderately correlated (rs = 0.47). Of the 125 possible
cell combinations, 62 cells were filled. (46) They found that the functional profile of all level I was
most frequently observed in 10% of the sample, followed by GMFS level II, MACS level I, and CFCS level I, and of GMFCS level II, MACS level II, and CFCS level I, both profiles combined representing 5% of the sample. (46) Limitations with the Hidecker study were the relatively small
2.7
Associated Health Conditions
Every child with CP displays different characteristics at varying levels, making each diagnosis unique. This is due to the fact that CP is, “…often accompanied by other disturbances of sensation, perception, cognition, communication, and behaviour; by epilepsy, and by secondary musculoskeletal problems.” (1) Although CP is a non-progressive brain injury, as individuals with
CP age, their quality of life is influenced by co-occurring impairments, diseases, and functional limitations. (65) It is important to understand the health conditions associated with CP, because
they can potentially have impact on the individual and the family. (66)
A population-based systematic review on associated health conditions, diseases, and functional limitations found that among children with CP 3 in 4 were in pain; 1 in 2 had an intellectual disability; 1 in 3 could not walk; 1 in 3 had a hip displacement; 1 in 4 could not talk; 1 in 4 had epilepsy; 1 in 4 had a behavior disorder; 1 in 4 had bladder control problems; 1 in 5 had a sleep disorder; 1 in 5 dribbled; 1 in 10 were blind; 1 in 15 were tube-fed; and 1 in 25 were deaf. (67) This
study was limited in that only articles published in English were used and the data were subject to publication biases. In contrast, a North American population-based study investigating children with CP under the age of 5 years, found that the burden of comorbidities occurred in less than 25% of the study sample. (68) The most frequently occuring comorbidities in the study sample were:
non-verbal (22.2%), active afebrile seizure disorder (16.9%), severe auditory impairment (11.5%), cortical blindness (9.5%), and gavage feeding requirement (7.8%). The increased burden
experienced by the child and family, with these co-occurring comorbidites, was more frequent in children with ataxic-hypotonic, spastic quadriplegic, and dykinetic CP compared to children with spastic diplegia. (68) Both of these population-based studies clearly demonstrate the wide range
and extent of associated health conditions that can affect a child’s life.
Wong and colleagues supported these findings and compared the prevalence and impact of associated health conditions of pre-school children with and without CP. (69) They established that
impact experienced by the child and family from the co-occurring comorbidities was also observed in a population-based study. (68) Similar findings indicate that children with lower levels of
functioning who present with more than one health condition are more likely to have a poorer overall health status. (70) However in this study, the prevalence and impact of associated health
conditions was experienced among children with CP in all levels of GMFCS and the correlations between gross motor function and health status as reported by parents found that health was not a valid indicator of the child’s functional abilities. (70)
A multicenter population-based cross sectional study of 235 children found that children with CP required more medication than a typically developing child. (71) Liptak and colleagues also found
that children who required the use of feeding tubes experienced more burdens, as they were typically at a lower functional ability, had increased medication usage, and experienced respiratory problems. (71) There is a wide range of behavioural issues that is five times more likely to be
present in children with CP as reported by their parents in a national survey. (72) Behavioural
problems are seen as problematic for children with CP and affect their daily lives, (69) specifically
behaviours of dependency, being headstrong, and hyperactive. (72) It should be recognized how
each different combination of associated health conditions affects and reflects the child’s overall health status.
As previously mentioned in the definition of CP by Rosenbaum and colleagues, (1) epilepsy is often
associated with with CP, occurring in approximately 30 to 35% of children with CP. (73-75) A study
conducted in the United States reported the proportion of children with CP who were also diagnosed with Autism Spectrum Disorder (ASD), epilepsy, or both and found opposite
relationships between the two associated health conditions. The proportion of children with CP and epilepsy increased in relationship to the child’s decreasing walking ability. Opposite to epilepsy, ASD was found to be more common among children with CP who could walk independently. (73)
programs. Understanding how other associated health conditions can impact a child’s development will contribute to providing a more complete functional profile.
2.8
Summary of Literature Review
Chapter 3
Objectives
The primary objective was to establish functional profiles for children with CP by examining the relationships among the GMFCS, MACS, and CFCS levels in children with CP. Specific objectives included:
1. Determining the bivariate correlations between the GMFCS and the MACS, the GMFCS and the CFCS, and the MACS and the CFCS.
2. Determining the total number of combinations that arise from the 125 possible profile cells. 3. Determining the proportion of the same level in all three classification systems.
4. Determining the most frequent combinations.
The secondary objective was to describe the prevalence and impact of associated health conditions in the most frequent functional profiles for children with CP and to determine any significant differences among the groups.
Chapter 4
Methods
4.1
Study Design
This is a descriptive study to describe the possible combinations of the GMFCS, MACS, and CFCS among children with CP and the prevalence and impact of associated health conditions of the most frequently occurring clusters. This study is part of a five-year prospective cohort study,
Developmental Trajectories of Impairments, Associated Health Conditions and Participation of Children with CP: The On Track Study (CHIR MOP# 119276). Ethical approval for this research was granted by The University of Western Ontario (Appendix A), as well as participating
universities and sites in the United States of America and Canada.
4.2
Sample
Eligible participants in this study must have been diagnosed with CP or were suspected to have CP at the time of recruitment. Children participating in the On Track study were between the ages of 18 months and 10 years at the time of recruitment. The inclusion criteria for setting the minimum age to 18 months allows for a more complete data set to be taken from the earliest age at which it is possible to assess children in other measures in the On Track Study. Although in many parts of the world a diagnosis is not given until a much older age, eighteen months of age allows for a fairly confident diagnosis of CP to be given to children. (74) The minimum age was also selected
because by the time the study is complete the youngest children (18 months) will be older than 2 years and a firm diagnosis of CP or a significant gross motor delay can be established by a physician. This minimum inclusion age range was also chosen because GMFCS levels are valid and reliable for children starting at the age of 2 years. (5) In this report only children over two years
of age are included. The maximum age restriction of 10 years allowed data to be collected for preschool and elementary school-aged children, as the oldest child would be 12 years of age, at the end of the one-year study period for each child. Families were excluded from the study if they did not speak English, French, or Spanish.
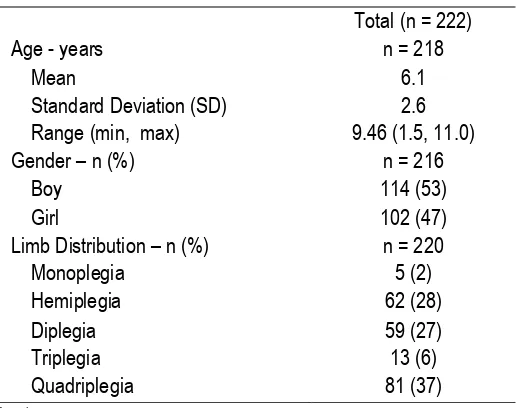
families were first approached either by mail or in person with a recruitment pamphlet followed by a letter of information. All parents provided signed consent on behalf of themselves and their children and children over 7 years provided signed assent (Appendix B). A targeted sample size of 875 children for the study aimed to achieve the goal of 175 children in each GMFCS level for the On Track study. For the purpose of this study an analysis of all of the children in the data set by April 30, 2014 who were over two years of age were included. Child participant demographics (n=222) are presented in Table 1.
Table 1: Child Demographics
Total (n = 222)
Age - years n = 218
Mean 6.1
Standard Deviation (SD) 2.6 Range (min, max) 9.46 (1.5, 11.0)
Gender – n (%) n = 216
Boy 114 (53)
Girl 102 (47)
Limb Distribution – n (%) n = 220
Monoplegia 5 (2)
Hemiplegia 62 (28)
Diplegia 59 (27)
Triplegia 13 (6)
Quadriplegia 81 (37)
*note
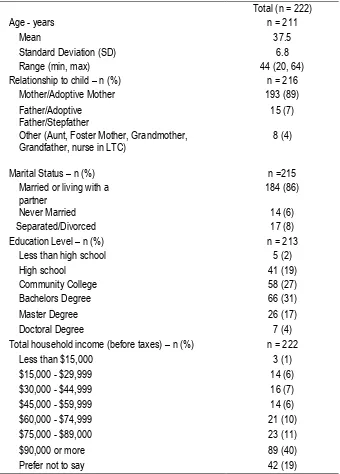
Parent demographics are described in Table 2.
Table 2: Parent Demographics
Total (n = 222)
Age - years n = 211
Mean 37.5
Standard Deviation (SD) 6.8
Range (min, max) 44 (20, 64)
Relationship to child – n (%) n = 216
Mother/Adoptive Mother 193 (89)
Father/Adoptive
Father/Stepfather 15 (7)
Other (Aunt, Foster Mother, Grandmother, Grandfather, nurse in LTC)
8 (4)
Marital Status – n (%) n =215
Married or living with a
partner 184 (86)
Never Married 14 (6)
Separated/Divorced 17 (8)
Education Level – n (%) n = 213
Less than high school 5 (2)
High school 41 (19)
Community College 58 (27)
Bachelors Degree 66 (31)
Master Degree 26 (17)
Doctoral Degree 7 (4)
Total household income (before taxes) – n (%) n = 222
Less than $15,000 3 (1)
$15,000 - $29,999 14 (6)
$30,000 - $44,999 16 (7)
$45,000 - $59,999 14 (6)
$60,000 - $74,999 21 (10)
$75,000 - $89,000 23 (11)
$90,000 or more 89 (40)
Prefer not to say 42 (19)
*note
SD = Standard Deviation LTC = Long Term Care
4.3
Data Collection Tools
The GMFCS, (5,6) MACS, (7) and CFCS (8) classification tools were used to determine an
There are five distinct levels (level I to level V) in each of the three classification systems that form an ordinal scale. The GMFCS assesses a child’s self-initiated movement, from the age of 2 years to 18 years (Appendix C). (5,6) The MACS tool was designed to assess how a child handles
objects in daily life for children between the ages of 4 to 18 years (Appendix D). (7) The CFCS
observes the child’s everyday communication performances and is valid for children between the ages of 4 and 18 years (Appendix E). (8) As described previously, all classification systems have
evidence of reliability and validity.
Each child’s associated health conditions were measured using the Child Health Conditions Questionnaire (Appendix F). (69) The questionnaire consists of 16 items pertaining to various health
problems, for example seeing, digestion, breathing, skin, communication, heart, pain, and sleeping. Each item is rated on a 7-point Likert scale to determine the extent to which the problem affects the child’s daily activities, from 1 “not at all” to 7 “to a very great extent”. These 16 health items were developed based on a functioning aspect of components similar to body functions in the ICF. The Child Health Conditions Questionnaire demonstrated good test-retest reliability with an ICC of greater than 0.80 for both number and impact of associated health conditions. (69) Both the
number of associated health conditions and the average impact were used to describe the health status of the most frequent clusters. In addition, parents completed a demographic questionnaire (Appendix G). These data (in addition to distribution of limb involvement) were used to describe the sample.
4.4
Data Collection Procedures
Data collection on the classification levels was completed by the parent or caregiver and by the assessing therapist. Parents recorded what they perceived to be their child’s level using the “Questions about your child’s usual abilities at home, school and in the community” form in the Parent Booklet: Time 1 Assessment (Appendix H). During the one-hour assessment the assessor also classified the children into the level that they felt was appropriate for the GMFCS, MACS, and CFCS, using the “Classification Systems” form in the Assessor Booklet: Time 1 Assessment (Appendix I). Consensus for GMFCS, MACS, and CFCS levels must have been reached between parent or caregiver and the assessing therapist. If consensus agreement on the three
was not met. Decision algorithms and flow charts to help with the determination of the various levels were provided in all study kits to aid in the consensus process and decisions between levels (refer to previous GMFCS (Appendix C), MACS (Appendix D), and CFCS (Appendix E)
classification appendices). In the portion of the Assessor Booklet Collecting data on classification (Appendix I) there were three columns for entry data. The three columns recorded data on if initial consensus was achieved by both the parent and the assessor (first column), if either the parent or therapist revised their classification based on discussion and came to consensus on the level (second column), or if the classification remained different between the parent and the assessor (third column). For the purpose of this study, data recorded in the first two columns were used to identify each child’s level. Participants for whom consensus was not obtained were excluded.
Parents or caregivers had the option of completing a hard copy or an online version of the data collection booklet. All therapists completed a hard copy of the assessor data collection booklet. Completed hard copies of the data collection booklets were couriered to the team at Western University and entered into the Empower database for analysis.
4.5
Data Analysis
Data were analyzed using SPSS version 22 after being downloaded from the Empower Database. Spearman’s rho (with 95% confidence intervals) was calculated to determine the bivariate
correlations between the GMFCS and the MACS, the GMFCS and the CFCS, and the MACS and the CFCS. A coefficient of greater than 0.75 was considered to be a good to excellent relationship, 0.50 to 0.75 to be a moderate to good relationship, 0.25 to .50 to be a fair relationship, and 0.00 to 0.25 to represent little or no relationship. (75) Inter-relationships of classifications among children
with CP were examined using nested cross-tabulation. Nested cross-tabulation tabulates the results of one data item, GMFCS, against the other two data items, MACS and CFCS, to show patterns of interaction. (76) Nested cross-tabulation of the GMFCS, MACS, and CFCS produces
125 possible cell combinations to determine the child’s functional status. Total numbers and frequency counts were used to determine the total possible combinations out of 125 cells, to determine the proportion of children who were reported to be the same level in all three
Chapter 5
Results
5.1
Bivariate Correlations
5.1.1
Gross Motor Function Classification System – Manual Ability Classification
System
According to Portney and Watkins (75) there was a moderate to good relationship between the
GMFCS and the MACS (rs = 0.71, 95% confidence interval (CI) 0.64 – 0.78).
5.1.2
Manual Ability Classification System – Communication Function
Classification System
The relationship between the MACS and the CFCS was considered to be moderate to good (rs =
0.65, CI = 0.55-0.72).
5.1.3
Gross Motor Function Classification System – Communication Function
Classification System
The GMFCS was not as strongly correlated with the CFCS as the previous two correlations. However, it was still considered to represent a moderate to a good relationship (rs= 0.50, CI =
0.39-0.61).
5.2
Relationship among all Three Functional Classifications
Table 3: Inter-relationships of all Three Functional Classifications
GMFCS level I (n = 89) Row totals
CFCS level I II III IV V
MACS level I 30 3 1 1 2 37
II 28 5 20 4 0 47
III 0 1 2 1 0 4
IV 0 0 0 1 0 1
V 0 0 0 0 0 0
Column totals 58 9 13 7 2 89
GMFCS level II (n = 43) Row totals
CFCS level I II III IV V
MACS level I 9 2 1 1 0 13
II 10 7 3 3 0 23
III 0 1 2 2 0 5
IV 0 1 0 1 0 2
V 0 0 0 0 0 0
Column totals 19 11 6 7 0 43
GMFCS level III (n = 25) Row totals
CFCS level I II III IV V
MACS level I 4 0 0 0 0 4
II 8 3 2 0 0 13
III 2 2 1 0 1 6
IV 0 0 1 1 0 2
V 0 0 0 0 0 0
Column totals 14 5 4 1 1 25
GMFCS level IV (n = 35) Row totals
CFCS level I II III IV V
MACS level I 1 0 0 0 0 1
II 3 0 1 0 0 4
III 2 6 4 3 1 16
IV 0 1 6 6 0 13
V 0 0 1 1 0 1
Column totals 6 7 11 10 1 35
GMFCS level V (n = 30) Row totals
CFCS level I II III IV V
MACS level I 0 0 0 0 0 0
II 0 0 0 0 0 0
III 0 0 0 0 0 0
IV 0 1 3 6 5 15
V 1 0 2 2 10 15
Column totals 1 1 5 8 15 30
*note
GMFCS = Gross Motor Function Classification System MACS = Manual Ability Classification System
From Table 3 the frequency of the occurrence of the same level of classification in all three systems was determined. Of the 222 children 49 (23%) were found to be the same level in all three classification systems. The most common same level classification was GMFCS level I, MACS level I, and CFCS level I (n = 30, 14%). Sequentially all level IIs represent 3% (n = 7), all level IIIs 1% (n = 1), all level IVs 3% (n = 6), and all level Vs 2% (n = 5).
The most prevalent functional profiles were considered to be those that represented 5% or more of the 222 participants. The most prevalent functional cell combination was (I, I, I) representing 14% of the total sample, closely followed by (I, II, I) representing 13% with (II, II, I) and (I, II, III)
representing 5% each. The most prevalent functional cell combinations accounted for 37% of the total sample.
5.3
Prevalence and Impact of Associated Health Conditions
Table 4: Average Number and Impact of Prevalent Associated Health Conditions
(GMFCS, MACS,
CFCS) levels Number of Associated Health Conditions - mean (SD) range (min, max) X (SD) M (IQR)(25,75) Impact of Associated Health Conditions – (I, I, I) 1.6 (1.5) 1.0 (0.0, 1.0) 0.5 (0.8) 0.2 (0.0, 0.5)
(I, II, I) 2.7 (2.0) 1.6 (0.0, 1.6) 1.0 (1.2) 0.3(0.1, 0.8) (II, II, I) 4.5 (2.9) 2.6 (0.0, 2.6) 1.8 (1.3) 0.8 (0.5, 1.1) (I, II, III) 4.6 (3.6) 2.7 (0.0, 2.7) 2.1 (1.4) 0.8 (0.3, 1.3)
*note
GMFCS = Gross Motor Function Classification System MACS = Manual Ability Classification System
CFCS = Communication Function Classification System X = Mean
M = Median
The number and proportion of associated health conditions in each of the most prevalent functional profiles are recorded in Table 5. Chi Square tests were non-significant across groups except for ‘speaking and communicating’ and ‘seizures’, using Bonferroni’s correction of 0.003.
Table 5: Proportion of Each Associated Health Condition in the Four Most Prevalent Groups
Health Condition – n (%) Functional Groups (I, I, I)
(n = 29)* (n = 28)* (I, II, I) (n = 10)* (II, II, I) (I, II, III) (n = 10) (Xp value 2 test)
Seeing 5 (17) 13 (46) 5 (50) 3 (33)
(n = 9)* 0.08
Hearing 0 (0) 3 (11) 0 (0) 2 (20) 0.09
Learning/understanding 4 (14) 11 (39) 4 (40) 3 (30) 0.2
Speaking/communicating 2 (7) 5 (18) 0 (0) 6 (60) 0.001
Emotions/behaviour 11 (38) 9 (32) 6 (60) 5 (50) 0.4
Seizures/epilepsy 0 (0) 4 (14) 5 (50) 1 (10) 0.001
Mouth 0 (0) 3 (11) 3 (30) 4 (40) 0.004
Teeth/gums 0 (0) 1 (4) 1 (10) 2 (20) 0.8
Digestion 5 (17) 6 (21) 4 (40) 4 (40) 0.3
Growth 2 (7) 4 (14) 3 (30) 3 (30) 0.2
Sleeping 3 (10) 5 (18) 2 (20) 2 (20) 0.8
Repeated infections 0 (0) 1 (4) 3 (30) 1 (10) 0.008
Breathing problems 3 (10) 2 (7) 4 (40) 2 (20) 0.07
Skin problems 5 (17) 1 (4) 0 (0) 3 (30) 0.07
Heart problems 1 (3) 2 (7) 2 (20) 2 (20) 0.3
Pain 5 (17) 5 (18) 3 (30) 2 (20) 0.8
note
*not all (GMFCS, MACS, CFCS) combinations had full associated health conditions data (x, x, x) = (GMFCS, MACS, CFCS) classification levels I to III
GMFCS = Gross Motor Function Classification System MACS = Manual Ability Classification System
Chapter 6
Discussion
6.1
Summary of the Results
Although there are currently many classification systems used to classify children with CP, there is not one singular classification system that can fully describe a child’s functional abilities and overall health status. Definitions of cerebral palsy have referred to it as an umbrella term in the past (12)
and recognized that CP is more than just a motor disorder because it is associated with various comorbidities. (1) The GMFCS, (5,6) the MACS, (7) and the CFCS (8) are all valid and reliable
functional classification systems for children with CP, focusing on their abilities rather than their impairments. The functional profiles that are established from profiling these three classification systems together, along with the description of associated health conditions, provides a more holistic description children with CP.
6.2
Comparison of Results to Existing Literature
There was a moderate to good correlation between the GMFCS and MACS, the MACS and the CFCS, and the GMFCS to the CFCS. In a similar study by Hidecker and colleagues they also found relationships among the classification systems to represent a moderate to good correlation.
(46) They reported Spearman’s correlations of 0.69 between the GMFCS and the MACS, 0.54
between the MACS and the CFCS, and 0.47 between the GMFCS and the CFCS. (46) The
correlation between the GMFCS and the CFCS falls outside of the boundary for “moderate to good”, but there is not a significant difference from this study’s results. Compared to the results from this study using a 95% CI, the relationship between the MACS and the CFCS is statistically significant (p > 0.05). This study shows a stronger correlation between the two functional
classification systems compared to Hidecker’s. One other study observed the correlation between the MACS and the CFCS, however they reported a stronger correlation than this current study and Hidecker’s (Spearman’s 0.80, p < 0.01). (64) A possible explanation for the stronger correlation is
that Himmelmann’s and colleagues study had a smaller sample size of 86. (64) The correlation
between just the GMFCS and the MACS has previously been reported by others and was shown to have a poor overall association (Kappa 0.35); however stronger relationships were presented among various subtypes of CP. (60) This finding cannot be directly interpreted with the current
findings because Kappa correlations use a different analysis that controls for chance agreements. The relationships that exist between the classification systems demonstrates that together these classification systems are useful in describing children’s functional abilities and are useful when combined with each other.
When the three functional classification systems were analyzed together using a cross-tabulation method, it resulted in a total of 56 different functional profiles of 125 possibilities. In this study, the proportion of cells filled was significantly lower than that established initially by Hidecker and her group (n = 62; X2 = 16.0, df = 1 , p > 0.001).
The most common functional profile was all level I classifications. The only other study to establish functional profiles from observing the three functional classifications systems was Hidecker and colleagues. (46) Similar to this study, with a sample of 222 Hidecker and colleagues, found that
key differences were noted in comparison to the Hidecker study. Hidecker’s study was more diverse when considering functional profiles. Their study filled 50% of the functional profile cells, whereas this study occupied 45% of the total cells. Due to the fact that this study was less diverse, it was expected that there would be a greater representation in specific profiles. This study had a larger recruitment number for GMFCS level I, therefore it makes sense that some of the most common functional profiles would incorporate GMFCS level I. In comparison, this study found a greater representation of the most prevalent functional profiles (37% in comparison to 20%), explainable by a less diverse sample. These results are significantly different than Hidecker’s study in that a greater representation of the most prevalent functional profiles was determined (p < 0.001). In both studies, two functional profiles were discovered to be the most common, (I, I, I) and (II, II, I).
A key difference in the inter-relationships among the GMFCS, the MACS, and the CFCS when establishing the functional profiles is that this study also took into consideration the second part of the definition of CP, which is that it is often associated with other health conditions. (1) It is
important when profiling to consider the health conditions that are associated and that impact the child’s life, because they are just as important as treating the motor disabilities. (77) It has been
reported that it is often the associated health conditions that have the greatest impact on children with CP and their families. (1,66)
It was observed that an increase in a level, in one or more of the three functional classification systems resulted in an increase in the number of associated health conditions and their impact on the child. Of the sixteen associated health conditions that were reported on, controlling emotions and behaviours ranked in the top three most predominant associated health conditions across the four functional profiles. Controlling emotions and behaviours has been recognized as a prevalent and impactful health condition for children with CP. (72,78,79) A report on the comparison of the
prevalence and impact of associated health conditions on preschoolers found similar results in regards to associated health conditions. (69) Wong and colleagues reported on preschoolers,
common functional profiles for children with difficulties seeing or communicating or who experience seizures. The average number and impact of associated health conditions increased from GMFCS level I to level V, supporting our findings in that as the functional level increases it can be expected that the child will experience a greater number of associated health conditions and their impact will be greater. A significant difference between the functional profile (I, I, I) and two of the lower functioning groups (II, II, I) and (I, II, III) was determined, supporting the previous notion.
6.3
Clinical Significance
The use of functional classification systems to assist in understanding the condition of CP has received greater attention and recognition among parents, children, and practitioners than other methods of classification. (55,80) In particular, the GMFCS has received wide spread recognition for
its clinical utility and impact and is considered to be a prime classification system for describing functional ability in children with CP. (54,56) However, it is important to acknowledge that CP is not
solely classified by a gross motor condition as stated in the definition of CP, (1) other functional
abilities should be considered. The MACS and CFCS take into account a child’s everyday performance on their ability to manipulate objects with both hands and to communicate with familiar and unfamiliar partners. (7,8) The GFMCS focuses on the child’s ability to perform gross
motor activities like walking, (6,47) while the MACS relies more heavily on cognitive ability and
voluntary motor control to perform bimanual fine motor skills. The CFCS focuses more on
cognitive tasks of exchanging information between individuals, (8) compared to limb movements in
the GMFCS and the MACS. The three classification systems place emphasis on different aspects of the human body and together give a more complete representation. The classification systems were all developed to be analogous to each other when they were established by similar methods. This allows for clinicians and researchers to easily use the three classification systems as they all focus on the child’s ability and use the same scaling system, levels I to V.
and impact; she is 9.2 years old and has hemiplegia. The prevalence of associated health conditions and the impact on the individual’s life will be discussed. Recall that when the Child Health Conditions Questionnaire was completed, the parents were asked to first report on if the child has the health condition and secondly to report on the extent of how the problem affects the child’s life, if present. The impact was recorded and coded by 1 – not at all, 2 – to a very small extent, 3 – to a small extent, 4 –to a moderate extent, 5 – to a fairly great extent, 6- to a great extent, and 7 – to a very great extent. The formatting of this questionnaire is contained in Appendix F.
Dan’s parent reported problems of pain affecting his life to a small extent, learning and
understanding and sleeping to a moderate extent, and controlling emotions or behaviours to a fairly great extent. He was also diagnosed with anxiety. Sarah who is from the functional profile (I, II, III) represented the child who reported the greatest impact of associated health conditions on her life in the sample. Sarah’s parent reported that she had problems with repeated infections but that they did not affect her daily activities in life. On the other hand problems with controlling emotions or behaviour, teeth and gums, and pain affected her life to a very small extent, problems involving the mouth a small extent, seeing, speaking or communicating in other ways, and problems with digestion affected her life to a moderate extent, learning and understanding, and problems with the heart impacted her life to a great extent, and seizures had a very great impact on her daily
activities in life. After viewing examples of two children with CP it provides a greater understanding of the diversity among children and how the prevalence and impact of associated health conditions can vary even between a few differences in levels of functional classification, with Dan at GMFCS I, MACS I, and CFCS I and Sarah at GMFCS I, MACS II, and CFCS III. These differences are also highlighted in the context of some children in all four most prevalent groups reporting no associated health conditions.
observed. This can help parents, practitioners and researchers to better understand the
relationships and similarities among the functional systems and appreciate the fact that all children have unique profiles and needs.
6.4
Limitations
A limitation to the study is the relatively small sample size due to an early cutoff date for analyzing the data. Another potential limitation of the study is that the sample was obtained through
convenience sampling and limited to participants within select regions of North America, making the results less generalizable to the CP population as a whole. .
6.5
Future Research
This area of research is pertinent to contributing to a better quality of life for children with CP and their families. It provides helpful information regarding a greater understanding of what to expect with a diagnosis of CP. While the three functional classification systems in combination with data on associated health conditions provide a more holistic picture this study should be replicated with a larger sample size. This will allow for the results to be more generalizable providing a stronger predication of the most common functional profiles and what the health conditions that they are associated with. Future research should also investigate other aspects of the child’s life, like participation and services received and not received. This research collected GMFCS, MACS, and CFCS levels based on an agreement between parents and the assessor and excluded those that were not in agreement. Research should be conducted to better understand parents and
assessors agreements and disagreements on perceived levels for the child, and if there is significance when an agreement cannot be determined.
6.6
Conclusions
References
1. Rosenbaum P, Paneth N, Leviton A, Goldstein M, Bax M. A report: The definition and
classification of cerebral palsy April 2006. Developmental Medicine and Child Neurology. 2007; 49 (Suppl. 109): 8-14.
2. Stanley F, Blair E, Alberman E. Cerebral Palsies: Epidemiology and Casual Pathways. London: Mac Keith Press; 2000.
3. World Health Organization. International Classification of Functioning, Disability and Health. Geneva: World Health Organization; 2001.
4. de brito Brandao M, de Cassia Goncalves S, Carvalho L, Crepaldi P, Abrahao L, Vaz de Melo Mambrini J, et al. Clusters of daily functioning and classification levels: Agreement of
information in children with cerebral palsy. Journal of Pediatric Rehabilitation Medicine: An Interdisciplinary Approach. 2012; 5: 151-158.
5. Palisano R, Rosenbaum P, Walter S, Wood E, Galuppi B. Development and reliability of a system to classify gross motor function in children with cerebral palsy. Developmental Medicine and Child Neurology. 1997; 39: 214-223.
6. Palisano R, Rosenbaum P, Bartlett D, Livingston M. Content validity of the expanded and revised Gross Motor Function Classification System. Developmental Medicine and Child Neurology. 2008; 50 744-750.
7. Elisasson A, Krumlinde-Sundholm L, Rosbald B, Beckung E, Arner M, Ohrvall A, et al. The Manual Ability Classification System (MACS) for children with cerebral palsy. Scale development and evidence of validity and reliablity. Developmental Medicine and Child Neurology. 2006; 48: 549-554.
8. Hidecker M, Paneth N, Rosenbaum P, Kent R, Lillie J, Eulenberg J, et al. Developing and validating the Communication Function Classification System (CFCS) for individuals with cerebral palsy. Developmental Medicine and Child Neurology. 2011; 53: 704-710.
9. Johnston M, Hagberg H. Sex and the pathogenesis of cerebral palsy. Developmental Medicine and Child Neurology. 2007; 49 (Suppl. 109): 74-78.
10. Badawi N, Watson L, Petterson B, Blair E, Slee J, Haan E, et al. What constitutes cerebral palsy? Developmental Medicine and Child Neurology. 1998; 40: 520-527.
12. Mutch L, Alberman E, Hagberg B, Kodama K, Perat M. Cerebral palsy epidemiology: Where are we now and where are we going? Developmental Medicine and Child Neurology. 1992; 34: 547-551.
13. Ashwal S, Russman B, Blasco P, Miller G, Sandler A, Shevell M, et al. Practice Parameter: Diagnostic assessment of the child with cerebral palsy: Report of the quality standards
subcommittee of the American Academy of Neurology and the Practice Committee of the Child Neurology Society. Neurology. 2004; 62: 851-863.
14. Jaw T, Jong Y, Sheu R, Liu G, Chou M, Yang R. Etiology, timing of insult, and neuropathology of cerebral palsy evaluated with magnetic resonance imaging. Journal of Formosan Medical Association. 1998; 97: 239-246.
15. Bax M, Tyderman C, Flodmark O. Clinical and MRI correlates of cerebral palsy: The European cerebral palsy study. The Journal of American Medical Association. 2006; 296: 1602-1608.
16. Nelson K, Chang T. Is cerebral palsy preventable? Current Opinion in Neurology. 2008; 21: 129-135.
17. Reddihough D, Collins K. The epidemiology and causes of cerebral palsy. Australian Journal of Physiotherapy. 2003; 49: 7-12.
18. Pschirrer E, Yeomans E. Does asphyxia cause cerebral palsy? Seminars in Perinatology. 2000; 24: 215-220.
19. Nelson K, Grether J. Causes of cerebral palsy. Current Opinion In Pediatrics. 1999; 11: 487-491.
20. Nelson K. New insights into causes of cerebral palsy. Neuropediatrics. 2006; 37: PL2.
21. Shapiro B. Cerebral palsy: A reconceptualization of the spectrum. Journal of Pediatrics. 2004; 145(Suppl. 2): 3-7.
22. Msall M, Limperopoulos C, Park J. Neuroimaging and cerebral palsy in children. Minerva Pediatrica. 2009; 61: 415-424.
23. Korzeniewski S, Birbeck G, DeLano M, Potchen M, Paneth N. A systematic review of neuroimaging for cerebral palsy. Journal of Child Neurology. 2008; 23: 216-227.
25. Wu Y, Croen L, Shah S, Newman T, Najjar D. Cerebral palsy in a term population: Risk factors and neuroimaging findings. Pediatrics. 2006; 118: 690-697.
26. Hagberg B, Hagberg G, Beckung E, Uvbrant P. Changing panorama of cerebral palsy in Sweden. VII. Prevalence and origin in the birth year period 1991-94. Acta Paediatr. 2001; 90: 271-277.
27. Wellbery C. Obstetric causes of cerebral palsy are uncommon. American Family Physician. 2007; 75: 552-555.
28. Gainsborough M, Surman G, Maestri G, Colver A, Cans C. Validity and reliability of the guidelines of the Surveillance of Cerebral Palsy in Europe for the classification of cerebral palsy. Developmental Medicine and Child Neruology. 2008; 50: 828-831.
29. Cans C. Surveillance of Cerebral Palsy in Europe: A collaboration of cerebral palsy surveys and registers. Developmental Medicine and Child Neurology. 2000; 40: 816-824.
30. Pakula A, Van Naarden Braun K, Yeargin-Allsopp M. Cerebral palsy: Classification and epidemiology. Physical Medicine and Rehabilitation Clinics of North America. 2009; 20: 425-452.
31. Gorter JW, Rosenbaum P, Hanna S, Palisano R, Bartlett D, Russell D, et al. Limb distribution, motor impairment, and functional classification of cerebral palsy. Developmental Medicine & Child Neurology. 2004; 46: 461-467.
32. Howard J, Soo B, Graham H, Boyd N, Reid S, Lanigan A, et al. Cerebral palsy in Victoria: Motor types, topography and gross motor function. Journal of Pediatric Child Health. 2005; 41: 479-483.
33. World Health Organization. International Classification of Impairments, Disabilities and Handicaps Geneva: World Health Organization; 1980.
34. World Health Organization. International Classification of Functioning, Disability and Health: Children & Youth Version: ICF-CY Geneva: World Health Organization Library; 2007.
35. Rosenbaum P, Stewart D. The World Health Organization International Classification of Functioning, Disability, and Health: A model to guide clinical thinking, practice and research in the field of cerebral palsy. Seminars in Pediatric Neurology. 2004; 11: 5-10.