Wavelet Transform Based ECG Signal
Processing for Feature Extraction of HRV
Signal
Neha Jadon1, Dr. S.Wadhawani2
PG Student [MAC], Dept. of EE, Madhav Institute of Technology and Science, Gwalior, Madhya Pradesh, India1 Assistant Professor, Dept. of EE, Madhav Institute of Technology and Science, Gwalior, Madhya Pradesh, India2
ABSTRACT:This paper presents analysis of HRV Signal and feature extraction using Electrocardiogram signal processing.HRV analysis is used as a mirroring tool for investigation of heart rhythm. . Data has been downloaded from MIT-BIH arrhythmia Database for HRV signal generation from ECG signal. Discrete Wavelet Transform utilized for noise removal and R peaks detection of ECG signal. Here, three time domain parameters namely SD ratio, pNN50 and RMSSD and one frequency-domain parameter namely LF/HF ratio is calculated for HRV analysis. Using the information from RR intervals, we also obtained the Poincare plot and the power spectral density plot for the HRV analysis .The results are based on the obtained values of the parameters we comment on the nature of values of the parameters in the paper, for normal and abnormal conditions.
KEYWORDS: Electrocardiogram, Power Spectral Density, Wavelet Transform, HRV.
I.INTRODUCTION
Electrocardiography is a technique of recording the bioelectric current or voltage generated by the heart muscles. The graph of voltage versus time of this recording is called the electrocardiogram (ECG). The heart does not beat at a regular rhythm. It changes depending on various physiological conditions. In heart rate variability, we are interested in capturing the variation that occurs between successive heart beats. This variation occurs due to the autonomic nervous system (ANS) that acts largely unconsciously and regulates internal body processes. Autonomic nervous system consists of two types of activities, called the sympathetic and parasympath etic. Sympathetic activities leads to accelerate the heart rate or decrease heart rate variability while parasympathetic activity decrease the heart rate [1][2]. Analysis of heart rate variability (HRV) signals is considered as a scanning tool for assessing the autonomic nervous system as it reflects the balance between sympathetic and parasympathetic activity in autonomic functioning and its influence on the heart rhythm. Heart Rate Variability analysis, is a recognized technique to obtain valuable information from ECG signals that can be used for prediction of abnormal cardiac conditions [3] and other non-cardiovascular diseases.Hypertension, respiratory, metabolic, exercise, age, gender, etc. can be effective factors which are responsible for changes in the heart rate variability. This fluctuation of HRV is associated with some specific pathologies such as diabetes, arrhythmia [4].. Now a day, through the development of mobile monitoring systems and smartphone applications HRV become part of the everyday life of amateur and professional sports.
II.PROPOSED METHODOLOGY
The main steps involved in the HRV analysis are
Data Collection of ECG Signal.
Pre-processing (noise removal and peak detection).
Generating HRV Signal from ECG signal.
Assessment of Parameters values.
Classification on the basis of obtained parameters values.
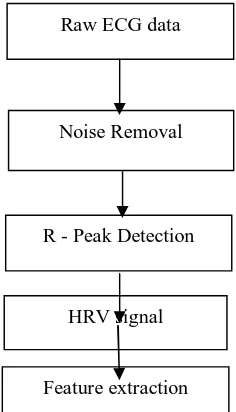
The flow diagram of HRV analysis is show below.
Fig. 1 flow diagram of HRV analysis
ECG Data Collection
ECG data for analysis of HRV is has been taken from Physio-Bank which freely available online .Each recording of this database have sampling frequency of 360Hz. All collected ECG samples are of standard Lead II and of 30 minute duration
Noise Removal
The given ECG signal is contain various noises such as muscle noise, grid noise, base line drift, power line interference, motion artifacts etc. Noise removal is the most important process for further processing of signal. IIR Notch Filter is used for removing Power line interface (PLI) at 50Hz or 60Hz and grid noise is removed by moving average filter. Wavelet transform is used for removing base line wander and other high frequency noises from the ECG signal.
R Peak Detection
R-peaks detection and calculation of R-R interval of ECG signals is a very important and complex part of ECG signal processing, HRV signal analysis or arrhythmia analysis. Wavelet transform has been used to detect the R-Peaks in this work. A wavelet family is obtained by applying a scale factor and translational factor to the basic mother wavelet. The name of the Daubichies family wavelets are written as ‘dbN’, where ‘N’ is the order, and ‘db’is the surname. Wavelet Transform is able to decompose signals into many lower resolution components, which allows accurate feature extraction from non-stationary signals like ECG and HRV signal.In this work ,we considered db4 Wavelet as this
Raw ECG data
Noise Removal
R - Peak Detection
HRV signal
wavelet shown similarity with the ECG waveform and gives details and more accurate results than others.All R peaks are detected successfully using searching algorithm and threshold of .45×max Peak amplitude.[3][6]
HRV Signal Generation
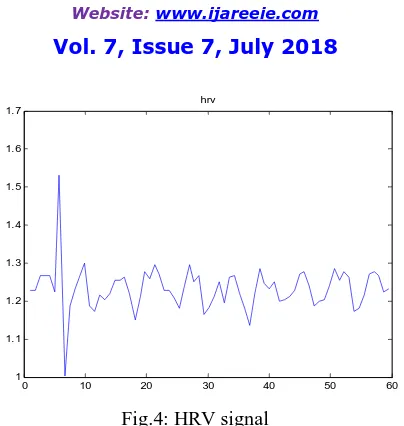
HRV signal shows variation in time intervals between successive heartbeats. In other words, the beat to beat variation in the R peaks of ECG pattern. Figure shows HRV signal which is extracted from ECG signal. Calculation of HRV starts after detection of R peaks in an ECG signal [1]. As the R- peaks are detected the peak to peak distance can be easily calculated as:
If R-Peaks are defined at samples. n = 1, 2, 3... ,k
Then, RR interval= R n +1- R n(1)
The above equation shows time period or the inverse ofheart rate, i.e. the distance between two successive R-Peaks definedat intervals n and n + 1. If this Interval is plotted against theirsamples or time, then the resultant vector would give the variation inheart rate. And thus the heart rate variability signal is constructed [1].This generated signal can be used as a clinical sign in recognition of diseases. this signal contain information about balance of autonomic nervous system, Also changes in HRV time series can be taken into consideration as a danger factor for mortality after myocardial infarction .
III.TIME DOMAIN FEATURE
For the HRV analysis, the time domain parameters are directly derived from RR interval of ECG signals. The time domain parameters such asRMSSD, pNN50and SD ratio are calculated.
1. SD Ratio: The SD Ratio is the ratio of length of the semi minor axis to major axis of the Poincare plot of an ECG signal. The Poincare plot is a nonlinear method to assess the dynamics of HRV. It is graphical representation in which each RR interval is plotted against next RR interval. We also obtained Poincare plot of an ECG signal for HRV analysis [6].
2. pNN50: The parameter NN50 is the total number of interval differences of the consecutive RR interval that are greater than 50MS.The parameter Pnn50 derived by dividing NN50 by the total no. of RR interval. These short term variation is highly correlated with high frequency variation in heart rate [6].
3. RMSSD: The square root of the mean squared difference of successive RR interval. This parameter depends on the total number of RR interval and lengths of the RR interval [6].
IV.FREQUENCY DOMAIN FEATURES
HRV plot in frequency domain mainly comprised of very low frequency components and low frequency components and high frequency components are less comparative to other two frequency components. Various frequency components are as follows;
1. Very low Frequency (VLF): information about the physiological significance of very low frequency HRV is less as compare to the other two frequency component. Very low frequency components (VLF) is most commonly used in clinical applications as a predictor of cardiac condition outcomes. It is recommended to study this frequency range using ECG recordings greater than 5 minutes in duration [7].
2. Low frequency component (LF): The low frequency ranges was once thought to be representative of sympathetic activity of the body, but recent studies have argued it actually represents impact by both sympathetic and parasympathetic of the autonomic nervous system [7].
3. High frequency components (HF): High- frequency (HF) band of HRV signal is also referred to as the RSA band due to the influence in this range of respiration on beat to beat variance. In fact, this frequency band in particular has been shown to represent parasympathetic nervous system regulation almost exclusively [7].
Frequency domain techniques uses power spectral density analysis which can be used to separate the complex HRV signal into its different spectral components. In spectral density analysis power is distributed as a function of frequency. The main advantages of spectral analysis over the time domain measures are that its provides a useful way to characterize the amplitude versus frequency content of HRV signal. PSD can be estimate using two methods, based on Fast-Fourier Transform (FFT) and autoregressive (AR) method modeling in spectral analysis of HRV. We obtained fft based welch psd plot for HRV analysis .This psd plot provides a useful way to characterize the power vsfrequency content of a randomsignal [4] .
V. RESULT AND DISCUSSION
In the fig 2, it shows the graph of time vs amplitude of raw ECG signal. This signal is taken from MIT-BIH arrhythmia database which is freely available online at physionet.
Fig. 2
:
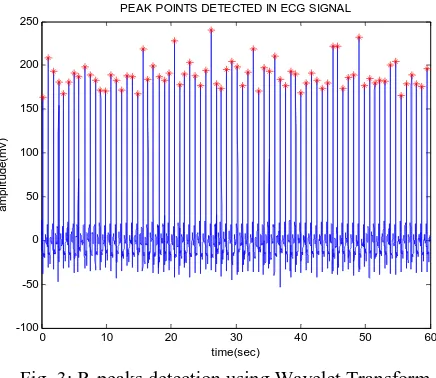
Raw ECG signalTrue R peak detection is a challenge because of the physiological variability of the QRS complex and due to the various types of noises that are generally present in the ECG signal. In the fig 2, it shows R peaks are detected successfully in ECG signal using Wavelet Transform.
Fig. 3: R-peaks detection using Wavelet Transform
HRV signal is generated by plotting RR length against their samples. Figure(4) shows HRV signal.
0 10 20 30 40 50 60
-150 -100 -50 0 50 100 150 200 250
Raw ECG Data plotting
time(sec)
a
m
p
lit
u
d
e
(m
v
)
0 10 20 30 40 50 60
-100 -50 0 50 100 150 200 250
PEAK POINTS DETECTED IN ECG SIGNAL
time(sec)
a
m
p
lit
u
d
e
(m
v
Fig.4: HRV signal
Figure (5) shows FFT based welch periodiogram for HRV signal spectral analysis.Welch method is used for measuring power density at various frequencies and the graph signifies that there is a power peak observed around lowerfrequencywhich shows that there is an abnormality.
Fig.5: FFT based Welch PSD Estimate
The Poincare plot in HRV is widely used to detect and monitoring many important and critical diseases. Here this is chosen for comparison of the normal and arrhythmia affected samples [9]. Fig (6) shows the Poincare plot of healthy subject.
0 10 20 30 40 50 60
1 1.1 1.2 1.3 1.4 1.5 1.6 1.7
hrv
0 50 100 150 200 250 300 350 400 450 500 20
30 40 50 60 70 80
Frequency (mHz)
P
o
w
e
r/
fr
e
q
u
e
n
c
y
(
d
B
/H
z
)
Fig.6: Poincare Plot of ECG signal
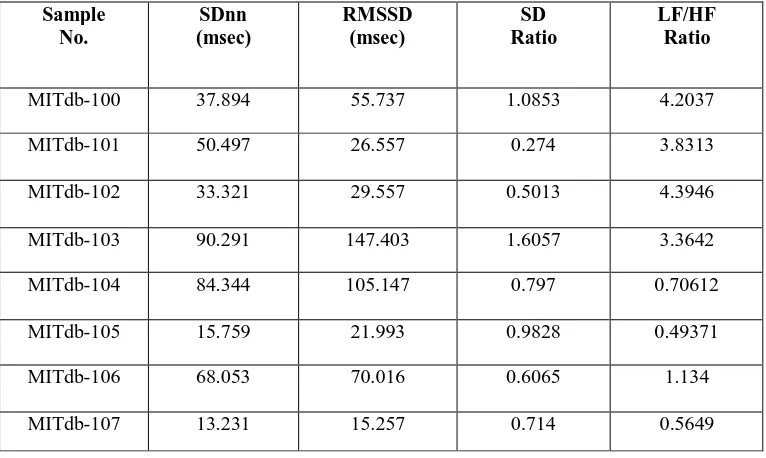
Table -1:Feature Extraction of HRV Signal
Sample No.
SDnn (msec)
RMSSD (msec)
SD Ratio
LF/HF Ratio
MITdb-100 37.894 55.737 1.0853 4.2037 MITdb-101 50.497 26.557 0.274 3.8313 MITdb-102 33.321 29.557 0.5013 4.3946 MITdb-103 90.291 147.403 1.6057 3.3642 MITdb-104 84.344 105.147 0.797 0.70612 MITdb-105 15.759 21.993 0.9828 0.49371 MITdb-106 68.053 70.016 0.6065 1.134 MITdb-107 13.231 15.257 0.714 0.5649
Table 1 shows values of standard deviation of RR interval,RMSSD and as a time domain features. In nonlinear analysis SD ratio as a parameter of Poincare plot and sample entropy are calculated for HRV analysis of ECG signals obtained from MIT-BIH arrhythmia database.
VI.CONCLUSION
In this work, Wavelet transform have been used and performed well for ECG signal processing or noise removal. Some features extracted for HRV analysis of arrhythmia affected samples. From the obtained parameters, we can propose that higher values of standard deviation shows the variability between heart rate is much higher i.e. the HRV is higher in the arrhythmias affected samples. The values of RMSSD and SD ratio is higher for abnormal signals than for normal
650 700 750 800 850 900 950 1000
650 700 750 800 850 900 950 1000
POINCARE PLOT
RR(n+1)
R
R
(n
signals. Whereas LF/HF ratio is lower for abnormal signal .Variation in heart rate is good sign for health but the variation should not be vary in a broad range. In future work we can extract more feature in frequency domain also as these extracted features are not enough to analysing HRV. Large number of data can be classified using any classifier such as ANN, SVM.
REFERENCES
[1] Desh Deepak Gautam,V.K. Giri,K.G. Upadhyay, “Feature Extraction of hrv Signal using Wavelet Transform” ,International Conference for Convergence in Technology,IEEE ,PP. 1030-1034.
[2] Narottam Das, Atul Wani, “HRV Analysis using Wavelet Based on Statistical Parameters”, International Journal of Engineering Research &Technology (IJERT),ISSN: 2278-0181,Vol 04,Issue08,August2015.
[3] Gayatri R. Kamat, Sushant S. Kulkarni, Darshana Sankhe, “HRV Analysis using Electrocardiographic Signal Processing”, International Journal of Computer Application (ICCT), pp.0975-8887,2015.
[4] Seda Guzel Aydin, Turgay Kaya, Hasan Guler, “Heart Rate Variability(HRV) Based Feature Extraction for Congestive Heart Failure”, ijcee, doi:10.17706,2016,pp.272-27
[5] W.Zhang, X.Wang, L.Ge, and Z.Zhang, “Noise Reduction in ECG Signal Based on Adaptive Wavelet Transform,” pp.2699-2702, 2005. [6] Alok Chakrabarty, Narottam Das, DipankarDas, “Assessment of Values of Time-Domain and Frequency-Domain Parameter for ECG Signals
Through HRV Analysis Using Symlets for Arrhythmia Prediction,”Advances in ComputationalIntelligence,pp 439-447(2016). [7] Fred Shaffer, and J.P. Ginsberg, “An Overview of Heart Rate Variability Metrics and Norms,” doi: 103389 (2017).
[8] Govind Sharan Yadav, Shubham Yadav, Prachi, “Time and Frequency Exploration of ECG signal” , International Journal of Computer Applications,2013, pp 0975-8887.
[9] GB Moody, RG Mark, AL Glodberger, physionet: A Research Resource for Studies of Complex Physiologic and Biomedical Signals,” IEEE, Computer in Cardiology, 2000, pp. 179-182.