A Novel Integrated Method for Detection of Salient Regions in an
Image using HDCT
Pallipati Vanamma & K Chaitanya
(M.Tech) (Assistant Professor, Dept of CSE) ANU College of Engineering & Technology Acharya Nagarjuna University, Guntur, A.P-522510, INDIA.
[email protected] [email protected]2
Abstract---
Humans are experts at quickly and accurately Identifying the most visually noticeable foreground object in the scene, known as salient objects, and adaptively focus attention on such perceived important regions. But some cases humans are not identified object properly, for that introduces unique technique are proposed to automatically detect salient areas in an image. This technique includes global and local functions to extract the features of a saliency map. The first key idea of work is to create a saliency map of a photograph via using a linear combination of colors in an excessive-dimensional color space. This is based on salient areas frequently have distinctive hues compared with backgrounds; human notion is complicated and especially nonlinear. By mapping the low-dimensional red, inexperienced, and blue coloration to a characteristic vector in a high-dimensional coloration area, to display and able to composite a correct saliency map by means of finding the most effective linear aggregate of color coefficients inside the excessive-dimensional shade space. To further improve the performance of saliency estimation second key idea is to utilize relative region and color assessment among super pixels as functions and to resolve the saliency estimation from a tri-map to know-based totally set of rules. The extra nearby features and mastering-based set of rules complement the global estimation from the high-dimensional color transform-based algorithm. The experimental results on 3 benchmark datasets display this technique is effective in contrast with the preceding trendy saliency estimation techniques.Index Terms— Salient area detection, super pixel, tri-map, classification, color channels, high-dimensional color space.
1.
I
ntroduction
In contrast, computationally identifying such salient object regions that match the human annotators’
behavior when they have been asked to pick a salient object in an image, is very challenging. Being able to automatically, efficiently, and accurately estimate salient object regions, however, is highly desirable given the immediate ability to characterize the spatial support for feature extraction, isolate the object from potentially confusing background, and preferentially allocate finite computational resources for subsequent image processing.
While essentially solving a segmentation problem, salient object detection approaches segment only the salient foreground object from the background, rather than partition an image into regions of coherent properties as in general segmentation algorithms [3]. Salient object detection models also differ from eye fixation prediction models that predict a few fixation points in an image rather than uniformly highlighting the entire salient object region [3]. In practice, salient object detection methods are commonly used as a first step of many graphics/vision applications including object-of interest image segmentation [4], object recognition, adaptive compression of images, content-aware image editing [5],image retrieval [6]– [7], etc.
A focus on bottom-up data driven salient object detection using image contrast under the assumption that a salient object exists in an image [2]. The proposed method is simple, fast, and produces high quality results on benchmark datasets. Motivated by the popular belief that human cortical cells may be hard wired to preferentially respond to high contrast stimulus in their receptive fields, this propose contrast analysis for extracting high-resolution, full-field saliency maps based on the following considerations:
Available online:
https://edupediapublications.org/journals/index.php/IJR/
P a g e | 1051considerations enable assignment of comparable saliency values across similar image regions, and
can uniformly highlight entire objects.
Fig.1. Overview of our algorithm: (a) Input image. (b) Over-segmentation to super pixels. (c) Initial saliency trimap. (d) Global salient region detection via HDCT. (e) Local salient region detection via random forest. (f) Final saliency
map
Saliency of a region mainly depends on its contrast with respect to its nearby regions, while contrasts to distant regions are less significant (see also [10])
In man-made photographs, object is often concentrated towards the inner regions of the images, away from image boundaries (see [9]).
Saliency maps should be fast, accurate, have low memory footprints, and easy to generate to allow processing of large image collections, and facilitate efficient image classification and retrieval.
2.
R
elated
W
ork
Some of the work belongs to the active research field of visual attention modeling, for which a comprehensive discussion is beyond the scope of this paper. Most preference given to refer readers to recent survey papers for a detailed discussion of 65 models [8], as well as quantitative analysis of different methods in the two major research directions: Fixation prediction and salient object detection [3].
A focus on relevant literature targeting pre-attentive bottom-up saliency region detection, which are biologically motivated, or purely computational, or involve both aspects. Such methods utilize low-level processing to determine the contrast of image regions to their surroundings, and use feature attributes such as intensity, color, and edges [9]. To broadly classify the algorithms into local and global schemes. Note
that the classification is not strict as some of the research efforts can be listed under both categories.
Local contrast based methods investigate the rarity of image regions with respect to (small) local neighborhoods. Based on the highly influential biologically inspired early representation model introduced by some authors that define image saliency using central-surrounded differences across multi-scale image features. Ma and Zhang [12] propose an alternate local contrast analysis for generating saliency maps, which is then extended using a fuzzy growth model. Harel et al. [13] propose a bottom-up visual saliency model to normalize the feature maps of Itti et al. to highlight conspicuous parts and permit combination with other importance maps.
3.
P
roposed
M
ethod
3.1. Initial Saliency Tri-map Generation
In this section, a unique method is proposed to detect the initial location of salient regions in an image. This method is a learning-based method and it processes an image in super-pixel level.
A. Super pixel Saliency Features
As demonstrated in recent studies, features from super pixels are effective and efficient for salient object detection. For an input image I, first perform over-segmentation to form super pixels X = {𝑋1, … … 𝑋𝑁}.then use the SLIC super pixel because
and a set of number of super pixels to N = 500. To build feature vectors for saliency detection, combine multiple information that is usually used in saliency detection. First concatenate the super pixels’ x- and y-locations into our feature vector. The location feature is used because humans tend to focus more on objects that are located around the center of an image. Then to concatenate the color features, as this is one of the most important cues in the human visual system and certain colors tend to draw more attention than others. Compute the average pixel color and represent the color features using different color space representations.
Next, concatenate histogram features is calculated as this is one of the most effective measurements for the saliency feature. The histogram features of the 𝑖𝑡ℎ
super pixel 𝐷𝐻𝑖 is measured using the chi-square
distance between other super pixels’ histograms. It is defined as
𝐷𝐻𝑖 = ∑ ∑
(ℎ𝑖𝑘− ℎ𝑗𝑘) 2
(ℎ𝑖𝑘− ℎ𝑗𝑘) 𝑏
𝑘=1 𝑁
𝑗=1
, (1)
Where b is the number of histogram bins. In this work used eight bins for each histogram. The global contrast and local contrast are also used as color features [1]. The global contrast of 𝑖𝑡ℎ super pixel
𝐷𝐺𝑖 is given by
𝐷𝐺𝑖 = ∑ 𝑑(𝑐𝑖, 𝑐𝑗) 𝑁
𝑗=1
, (2)
Where 𝑑(𝑐𝑖, 𝑐𝑗)denotes the Euclidean distance
between the i th and the j th super pixels color values, 𝑐𝑖and𝑐𝑗, respectively. We use the RGB, CIE Lab,
hue, and saturation of eight color channels to calculate the color contrast feature so that it has eight dimensions. The local contrast of the color features 𝐷𝐿𝑖 is defined as
𝐷𝐿𝑖= ∑ 𝜔𝑖,𝑗 𝑝
𝑑(𝑐𝑖, 𝑐𝑗) (3) 𝑁
𝑗=1
𝜔𝑖,𝑗𝑝 = 1 𝑍𝑖
𝑒𝑥𝑝 (− 1 2𝜎𝑝2
‖𝑝𝑖− 𝑝𝑗‖2 2
) (4)
Where 𝑝𝑖∈ [0, 1] × [0, 1] denotes the normalized
position of the 𝑖𝑡ℎ super pixel and 𝑍
𝑖 is the
normalization term. The weight function in Eq. (4) is
widely used in many applications including spectral clustering [9]. This function is adopted to give more weight to neighboring super pixels. In this experiments, let 𝜎𝑝2 = 0.25. In addition to the global
and local contrast, evaluate the element distribution by measuring the compactness of colors in terms of their spatial color variance. .
The aforementioned features are concatenated and are used to generate our initial saliency tri-map. In short, super pixel feature vectors consist of 71 dimensions that combine multiple evaluation metrics for saliency detection.
B. Initial Saliency Tri-map via Random Forest Classification
Next calculate the feature vectors for every super pixel, use a classification algorithm to check whether each region is salient. In this study, the use of random forest classification because of its efficiency on large databases and its generalization ability. A random forest is an ensemble method that operates by constructing multiple decision trees at training time and decides the class by examining each tree’s leaf response value at test time. This method combines the bootstrap aggregating idea and random feature selection to minimize the generalization error. To train each tree, the sample of data is getting replaced and trains a decision tree with only a few features that are randomly selected. Typically, a few hundred to several thousand trees are used, as increasing the number of trees tends to decrease the variance of the model.
Regression method used to estimate the saliency degree for each super pixel and classified it via adaptive thresholding. As our goal is to classify each super pixel as foreground and background, found that using a classification method is more suitable than the regression for tri-map generation.
𝐹𝑝=
|{𝐹𝑐} ∩ {𝐹𝐺𝑇}|
|{𝐹𝑐}| , (5)
𝐵𝑝=
|{𝐵𝑐} ∩ {𝐵𝐺𝑇}|
|{𝐵𝑐}| , (6)
𝐸𝑅 =
|({𝐹𝑐} ∩){𝐵𝐺𝑇} ∪ ({𝐵𝑐} ∩ {𝐹𝐺𝑇})|
|{𝐼}| (7)
Whereas | · | denotes the number of pixels, 𝐹𝑐 and 𝐵𝑐
Available online:
https://edupediapublications.org/journals/index.php/IJR/
P a g e | 1053foreground/background, respectively, and I denotes the whole image. The error rate (𝐸𝑅) denotes the ratio
of the area of misclassified regions to the image size, and the unknown rate is the ratio of the area of the regions classified as unknown to the image size. Almost 2,500 images are used from the MSRA-B dataset [2], which are selected as a training set from Jiang et al. for training data, and the annotated ground truth images for labels are used. Generated N feature vectors for each image. In total, approximately one million vectors for the training data
The code provided by Becker et al. for random forest classification is used. In this implementation, here 200 trees are used and set to maximum tree depth to 10.
3.2 Saliency Estimation from Tri-map
In this section, a present our global salient region detection via HDCT and learning-based local salient region detection, and describe a step-by-step process to obtain final saliency map starting with the initial saliency map.
In proposed method a global saliency estimation method via HDCT [2]. The idea of global saliency estimation implicitly assumes that pixels in the salient region have independent and identical color distribution. With this assumption, depict the saliency map of a test image as a linear combination of high-dimensional color channels that distinctively separate salient regions and back grounds. In proposed method local saliency estimation via learning-based regression. Local features such as color contrast can reduce the gap between an independent and identical color distribution model implied by HDCT and true distributions of realistic images. Analyze how to combine these two maps to obtain the best result.
A. Global Saliency Estimation via HDCT
Colors are important cues in the human visual system. Many previous studies have noted that the RGB color space does not fully correspond to the space in which the human brain processes colors. It is also inconvenient to process colors in the RGB space as illumination and colors are nested here. Therefore, many different color spaces have been introduced, including YUV, YIQ, CIE Lab, and HSV. HDCT unifies the strength of many different color representations. Main goal is to find a linear combination of color coefficients in the HDCT space
such that the colors of salient regions and those of backgrounds can be distinctively separated.
The different magnitudes in the color gradients can also be used to handle cases in which salient regions and backgrounds have different amounts of defocus and different color contrasts. In summary, 11 different color channel representations are used in this HDCT space.
To further enrich the representative power of HDCT space, power-law transformations to each color coefficient is applied after normalizing the coefficient between [0, 1]. Three gamma values are used such as: {0.5, 1.0, and 2.0}. This resulted in a high-dimensional matrix to represent the colors of an image:
𝐾 =
[ 𝑅1𝛾1 𝑅
1 𝛾2
𝑅1𝛾3 𝐺
1 𝛾1
… 𝑅2𝛾1 𝑅
2
𝛾2 𝑅
1
𝛾3 𝑅
1
𝛾1 …
⋮ 𝑅𝑁
𝛾1 ⋮
𝑅𝑁
𝛾2 ⋮ ⋮ ⋮
𝑅𝑁 𝛾3
𝐺𝑁 𝛾1
… ]
∈ 𝑅𝑁×1, (8)
In which 𝑅𝑖 and 𝐺𝑖 denote the test image’s 𝑖𝑡ℎ
superpixel’s mean pixel value of the R color channel and G color channel, respectively. By using 11 color channels such as RGB, CIELab, hue, and saturation, we can obtain an HDCT matrix K with l = 11 × 3 = 33.
Fig.2.HDCT concatenate different nonlinear RGB transformed color space representations to form a high-dimensional feature vector to represent the color of a pixel.
To obtain saliency map, utilize the foreground candidate and background candidate color samples in tri-map to estimate an optimal linear combination of color coefficients to separate the salient region color and background color. Let’s formulate this problem as an l2 regularized least squares problem that minimizes
𝑚𝑖𝑛
𝛼 ‖(𝑈 − 𝐾̃𝛼)‖2 2
+ 𝜆‖𝛼‖22, (9)
Where α ∈ 𝑅𝐼 is the coefficient vector that to
estimate, λ is a weighting parameter to control the magnitude of α, and 𝐾̃ is an M×l matrix with each row of K corresponding to color samples in the foreground/background candidate regions:
𝐾̃ =
[ 𝑅𝐹𝑠1
𝛾1
⋮
𝑅𝐹𝑠1 𝛾2
⋮
𝑅𝐹𝑠1 𝛾3
⋮
𝐺𝐹𝑆1 𝛾1
⋮ …
⋮ 𝑅𝐹𝑆
𝑓
𝛾1
𝑅𝐵𝑠𝛾11
𝑅𝐹𝑆
𝑓
𝛾1
𝑅𝐵𝑠𝛾11
𝑅𝐹𝑆
𝑓
𝛾1
𝑅𝐵𝑠𝛾11
𝑅𝐹𝑆
𝑓
𝛾1
𝑅𝐵𝑠𝛾11
… …
⋮ 𝑅𝐵𝑠
𝑏
𝛾1
⋮ 𝑅𝐵𝑠
𝑏
𝛾1
⋮ ⋮ ⋮ 𝑅𝐵𝑠
𝑏
𝛾1 𝐺
𝐵𝑆𝑏 𝛾1
…]
, (10)
Where 𝐹𝑠𝑖 and B𝑆𝑗denote the 𝑖𝑡ℎ
foreground candidate super pixel among entire super pixels and the 𝑗𝑡ℎ background super pixel among
entire super pixels that are classified at the tri-map generation step, respectively. M is the number of color samples in the foreground/background candidate regions (M N), and f and b denote the number of foreground and background regions,
respectively, such that M = f + b. U is an M dimensional vector with value equal to 1 and 0 if a color sample belongs to the foreground and background candidate
Respectively,
Respectively
𝐔 = [1 1 . . . 1 0 0 . . . 0]𝑇 ℝ𝑀×1 (𝟏𝟏) F 1’s b 0’s
Since a greater number of color samples than the dimensions of the coefficient vector, the l2 regularized least squares problem is a well-conditioned problem that can be readily minimized with respect to α as 𝛼∗ = (𝐾̃𝑇𝐾̃ + λI)−1𝐾̃𝑇U. In all
experiments, we use λ = 0.05 to produce the best results. After we obtain α∗, the saliency map can be constructed as
S𝑮(Xi) = ∑ 𝑲𝑖𝑗𝑎𝑗∗, 𝑖 = 1,2, … … , 𝑁, (12) 𝑙
𝑗=1
This denotes the linear combination of the color coefficient of our HDCT space. The l2 regularize in the least square formulation in Eq. (9) restricts the magnitude of the coefficient vector to avoid over-fitting to U. With this l2 regularizer, the constructed saliency map is more reliable for the both foreground and background super pixels that are initially classified in the tri-map. Several tests have been done on the values of λ, and the regularized l2 least square with nonzero λ produces better saliency maps than the least square method without regularizer (λ = 0). Note that the popular l1 regularizer for sparse solution could also be considered, but the l1 regularizer is not essential in our work, since more accurate representation of both foreground and background super pixels in HDCT space are important. Also, it is not necessary for the coefficient vector to be sparse. The overall process of the HDCT-based saliency detection is described in algorithm 1.
Algorithm 1 HDCT-Based Saliency Estimation
Input: initial tri-map T, and K= (Eq. (8))
1: f← number of foreground super pixels in the tri-map 2: b← number of background super pixels in the tri-map 3: M← f+b
4: construct 𝐊̃ ∊∈ ℝ𝑀×𝑙 by Eq. (10)
5: construct 𝐔 =∈ ℝ𝑀×1 by Eq. (11)
6: calculate α∗= ( 𝐊̃𝐓 𝐊̃ + 𝛌I)−1𝐊T𝐔by solving Eq. (9)
7: calculate 𝑆𝐺(𝑋𝑖) = ∑𝑙𝑗=1𝐊𝑖𝑗α𝑗∗ by Eq. (12)
Available online:
https://edupediapublications.org/journals/index.php/IJR/
P a g e | 1055Fig.3. an illustration of local saliency features. Black, white, and gray regions denote background super pixels, foreground super pixels, and unknown super pixels, respectively. Use K -nearest foreground super pixels and K -nearest background super pixels to calculate a feature vector.
B. Local Saliency Estimation via Regression
Although the HDCT-based salient region detection provides a competitive result with a low false positive rate, this method has a limitation in that it is easily affected by the texture of the salient region, and therefore, it has a relatively high false negative rate. To overcome this limitation, it presents a learning-based local salient region detection that is based on the spatial and color distance from neighboring super pixels. First, for each super pixel, find the K nearest foreground super pixels and K -nearest background super pixels as described in. For each super pixel Xi, find the K -nearest foreground super pixels 𝑋𝐹𝑆= {𝑋𝐹𝑆1, {𝑋𝐹𝑆1, {𝑋𝐹𝑆𝑘} and K
-nearest background super pixels𝑋𝐹𝑆= {𝑋𝐵𝑆1, {𝑋𝐵𝑆1. .
. {𝑋𝐵𝑆𝑘}, and use the Euclidean distance between a
super pixel Xi and super pixels XF S or XBS as features. The Euclidean distance to the K-nearest foreground (∈ RK×1) and background (dBSi ∈ RK×1) features of the 𝑖𝑡ℎsuper pixel is defined as
follows:
𝐝𝐹𝑆𝑖=
[
∥ 𝐩𝑖− 𝐩𝐹𝑆𝑖1∥22 ∥ 𝐩𝑖− 𝐩𝐹𝑆𝑖2∥22
. . . ∥ 𝐩𝑖− 𝐩𝐹𝑆𝑖𝐾∥22]
𝐝𝐵𝑆𝑖=
[
∥ 𝐩𝑖− 𝐩𝐵𝑆𝑖1∥22 ∥ 𝐩𝑖− 𝐩𝐵𝑆𝑖2∥22
. . . ∥ 𝐩𝒊− 𝐩𝐵𝑆𝑖𝐾∥22]
, (13)
In which F𝑆𝑖𝑗 denotes the j
th nearest foreground super
pixel and 𝐵𝑆𝑖𝑗denotes the 𝑗𝑡ℎnearest background
super pixel from the 𝑖𝑡ℎsuper pixel. As objects tend to
be located in a compact region in an image, the spatial distances between a candidate super pixel and the nearby foreground/background super pixels can be a very useful feature for estimating the saliency degree. Also use the color distance features between super pixels. The feature vector of color distances from the
i
th super pixel to the K-nearest foreground(𝑑𝐶𝐹𝑖∈ 𝑅
8𝑘×1) and background (𝑑 𝐵𝑆𝑖∈𝑅
8𝑘×1) super
pixels is defined as follows:
(𝑑𝐶𝐵𝑖∈ R8K×1) super pixels is defined as follows:
𝐝𝐶𝐹𝑖=
[
𝐝 (𝐜𝑖, 𝐜𝐹𝑆𝑖1) 𝐝 (𝐜𝑖, 𝐜𝐹𝑆𝑖2)
. . . 𝐝 (𝐜𝑖, 𝐜𝐹𝑆𝑖𝐾)]
, 𝐝𝐶𝐵𝑖=
[
𝐝 (𝐜𝑖, 𝐜𝐵𝑆𝑖1) 𝐝 (𝐜𝑖, 𝐜𝐵𝑆𝑖2)
. . . 𝐝 (𝐜𝑖, 𝐜𝐵𝑆𝑖𝐾)]
(14)
Although a super pixel located near the foreground super pixels tends to be a foreground, if the color is different, there is a high possibility that it is a background super pixel located near the boundary of an object. Use eight color channels—RGB, CIE Lab, hue, and saturation—to measure the color distance, where 𝑐𝑖,𝑐𝐹𝑆𝑖𝑗 and 𝑐𝐵𝑆𝑖𝑗are eight-dimensional color
vectors. The distance vector d ( 𝑐𝑖,𝑐𝐹𝑆𝑖𝑗) is also an
eight-dimensional vector, where each element of d ( 𝑐𝑖,𝑐𝐹𝑆𝑖𝑗) is the distance in a single color channel. To
decide the optimal number of nearest super pixels K, calculate the F-measure rate for each parameter.
For saliency estimation, Use the super pixel-wise random forest regression algorithm, which is effective for large high-dimensional data. Extracted feature vectors using the initial tri-map, and then, estimate the saliency degree for all super pixels. For this local saliency map, even those classified as foreground/background candidate super pixels in the initial tri-map are reevaluated because they could still be misclassified. It should be noted that the initial tri-map is generated by a random forest classifier and that the next random forest regressor generates a local saliency map. Considering that has two stages of cascaded random forests, divided the training data set into two disjoint sets so that the second random forest is trained with more realistic inputs. Toward this end, trained the first random forest with one data set, and we obtained the training data set for the second random forest from the tri-maps generated for the other data set, which is not used for training the first random forest. This process is repeated in a manner similar to five-fold cross-validation. Use the code provided for random forest regression using 200 trees and setting the maximum tree depth to 10.
C. Final Saliency Map Generation
therefore, it has a low false negative rate but a high false positive rate. Therefore, combining the two maps is a significant step in our algorithm.
Proposed method introduces two approaches to combine the two saliency maps. The first approach is to perform the pixel wise multiplication of the two maps, as shown below:
𝑆𝑚𝑢𝑙𝑡=
1
𝑧(𝑝(𝑆𝐺) × 𝑝(𝑆𝐺)) , (15)
In which Z is a normalization factor, p (.) is a pixel-wise combination function, 𝑆𝐺 is the global saliency
result, and 𝑆𝐿 is the local saliency result. However,
this combination tends to show darker pixels and suppresses bright pixels, and therefore, some false negative pixels from a global saliency map will suppress the local saliency map, and the merit of the local saliency map will decrease.
The second approach is to combine the two maps using a summation:
𝑆𝑠𝑢𝑚=
1
𝑧(𝑝(𝑆𝐺) × 𝑝(𝑆𝐺)) , (16)
In this study,combine the two maps more adaptively to maximize our performance. Based on Eq. (16), adopt p(x) = exp(x) as a combination function to give greater weightage to the highly salient regions. The weight values are determined by comparing the saliency map with the ground truth. Calculate the optimal weight values for the linear summation by solving the nonlinear least-squares problem, as shown below:
min
𝜔1≥0,𝜔2≥0
𝜔3≥0,𝜔4≥0
∥𝜔1𝑝(𝜔2𝑆𝐺) + 𝜔3𝑃(𝜔4𝑆𝐿) − 𝐺𝑇∥
2 2
(17)
In which GT is the ground truth of an image in the training data. To find the most effective weights, iteratively optimize the nonnegative least-squares objective function in Eq. (17) with respect to each variable. As the objective function in Eq. (17) is bi-convex, it must converge after a few optimization steps; however, different local solutions are obtained by the different initializations. To obtain the best solution (i.e., the solution that yields the smallest value of the objective function in Eq. (17) among several local solutions), repeat the optimization process with randomly initialized variables several times, and the final solution for the objective function in Eq. (17) is obtained as 𝜔1 = 1.15, 𝜔2 = 0.74, ω3 =
1.57, and 𝜔4 = 0.89. Found that it performance
further improves with the values of the solution. Finally, defined the equation of the final saliency map combination as
𝑆𝑓𝑖𝑛𝑎𝑙=
1
𝑍(𝜔1𝑝(𝜔2𝑆𝐺) + 𝜔3𝑃(𝜔4𝑆𝐿)) (18)
4. Performance Analysis
In this study use precision-recall rate for evaluating salient region detection algorithm.
Precision-Recall Evaluation:
The precision is also called the positive predictive value, and it is defined as the ratio of the number of ground-truth pixels retrieved as a salient region to the total number of pixels retrieved as the salient region. The recall rate is also called the sensitivity, and it is defined as the ratio of the number of salient regions retrieved to the total number of ground-truth regions. We use two different approaches to examine the precision-recall rate. The first is to measure the rate for each pixel threshold. The second is the precision and recall Rate determined from the adaptively threshold saliency map in [11].
Fig.4.Comparison of precision-recall curves of proposed initial map And results based on different color transforms on the MSRB Dataset
Available online:
https://edupediapublications.org/journals/index.php/IJR/
P a g e | 10575.
Results
Fig.1 original image
Fig.2.color transformed image.
Fig.3.final segmented image.
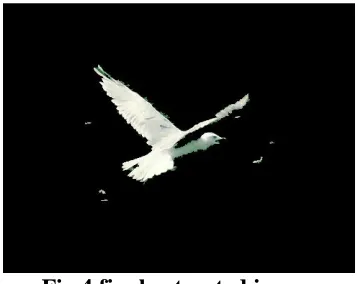
Fig.4.final extracted image
CAMPARISON OF QUANTITATIVE RESULTS OF HDCT AND REGRESSION ON MSRA-B DATABASE
TABLE –V
Global map (HDCT)
Local map (Regression)
Previous HDCT
Previous Regression
True positive
0.70 0.79 0.740 0.830
True negative
0.91 0.92 0.976 0.969
False positive
0.02 0.025 0.024 0.031
False negative
0.21 0.15 0.260 0.170
Comparison of Average Run Time (Seconds per Image) Of the Most Recent Saliency Detection Algorithms
5.
C
onclusion
A unique salient vicinity detection approach is proposed to estimates the foreground areas from a tri-map the usage of two exclusive methods: worldwide saliency estimation via HDCT and local saliency estimation thru regression. The tri-map-based totally robust estimation overcomes the constraints of inaccurate preliminary saliency type. As end result, this approach achieves proper overall performance and is computationally efficient in evaluation to the kingdom-of-the-art-work strategies also confirmed method HDCT DRFI GMR HS
this proposed approach can further improve DRFI, which is the quality acting approach for salient location detection. It is effective in increasing the success of foreground and background color separation since the low dimensional RGB space is very dense where distributions of foreground and background colors are largely overlapped it is used in medical field.In future it use more features to solve these limitations and improve the accuracy of saliency detection.
R
eferences
[1] M.-M. Cheng, G.-X. Zhang, N. J. Mitra, X. Huang, and S.-M. Hu, “Global contrast based salient region detection,” in IEEE CVPR, 2011, pp. 409– 416.
[2] T. Liu, Z. Yuan, J. Sun, J. Wang, N. Zheng, T. X., and S. H.Y., “Learning to detect a salient object,” IEEE TPAMI, no. 2, 2011.
[3] A. Borji, D. N. Sihite, and L. Itti, “Salient object detection: A benchmark,” in ECCV, 2012.
[4] M. Donoser, M. Urschler, M. Hirzer, and H. Bischof, “Saliency driven total variation segmentation,” in IEEE ICCV, 2009.
[5] G.-X. Zhang, M.-M. Cheng, S.-M. Hu, and R. R. Martin, “A shapepreserving approach to image resizing,” Comput. Graph. Forum, vol. 28, no. 7, pp. 1897–1906, 2009.
[6] S.-M. Hu, T. Chen, K. Xu, M.-M. Cheng, and R. R. Martin, “Internet visual media processing: a survey with graphics and vision applications,” The Visual Computer, pp. 1–13, 2013.
[7] Y. Gao, M. Wang, Z.-J. Zha, J. Shen, X. Li, and X. Wu, “Visual textual joint relevance learning for tag-based social image search,” IEEE TIP, vol. 22, no. 1, pp. 363–376, 2013.
[8] A. Borji and L. Itti, “State-of-the-art in visual attention modeling,” IEEE TPAMI, 2012.
[9] H. Jiang, J. Wang, Z. Yuan, T. Liu, N. Zheng, and S. Li, “Automatic salient object segmentation based on context and shape prior,” in BMVC, 2011, pp. 1– 12.
[10] P. Reinagel, A. Zador et al., “Natural scene statistics at the centre of gaze,” Network: Computation in Neural Systems, 1999.
[11]F. Perazzi, P. Krahenbuhl, Y. Pritch, and A.Hornung, “Saliency filters:Contrast based filtering for salient region detection,” in Proc. IEEE Conf.Compute Vis.Pattern Recognit. (CVPR), Jun. 2012
Pallipati Vanamma received the bachelor of technology in computer science engineering from ABR College, kanigiri, prakasham district, AP State, India, in 2015, the M.Tech. degree in computer science engineering in digital image processing from ANU College, Guntur, AP State, India, in 2017. Her research interests include digital image processing,, wireless communications feature extraction and computer vision, core java field.