CREDIT RISK, EFFICIENCY AND PERFORMANCE OF COMMERCIAL BANKS IN KENYA
JAPHETH MANGUYA LAKASIA
A RESEARCH PROJECT SUBMITTED TO THE DEPARTMENT OF APPLIED ECONOMICS IN THE SCHOOL OF ECONOMICS IN PARTIAL FULFILMENT
OF THE REQUIREMENTS FOR THE AWARD OF THE DEGREE OF MASTER
OF ECONOMICS (FINANCE) OF KENYATTA UNIVERSITY
Declaration
This research is my original work and has not been presented for a degree in any other university
Signature ~... Date
fldl;t..
f.~((.
t.<f.
.
Japheth Manguya Lakasia (BA) K 102/CTY IPT 121491/2010
This project is submitted with our approval as University Supervisors
Date... .
":
:
.
1
.
1
:
..
:
-:-
..
IN
-
.
!
.
~
.
".-Signature
0r1
.
Dr. Joseph Muchai Muniu Department of Applied Economics
Signature
a
ty .Date ..
s
.
F
..
fJ.t
.
C1
'
~
.
!(f
,
Dr. Paul Mwangi Gachanja Department of Economic Theory
Dedication
To my parents Mr. Charles Lakasia and Mrs. Ruth Lakasia for their upbringing and
Acknowledgement
I thank the almighty God for the gift of life and good health during the study period. It is
by his grace and mercy that I have come this far.
Special thanks go to the lecturers of the School of Economics for their support and
willingness to disseminate information whenever it was required. Specifically, my
gratitude goes to my supervisor Dr. Muniu for his insightful comments and provision of
materials throughout the study, thank you so much. My special gratitude for Dr. Gachanja
for guiding me through the whole study with his invaluable input, God bless you.
Special appreciation goes to my classmates, Vincent, Fridah, Kiptoo, Peninah and others
for your support. Indeed you were my first supervisors, thank you. Lastly I wish to whole
heartedly thank my family for allowing me to be away from them on numerous occasions,
TABLE OF CONTENTS
Declaration ii
Dedication iii
Acknowledgement iv
List of Tables vii
List of Figures viii
Abbreviations ix
Operational definition of terms x
Abstract xi
CHAPTER ONE: INTRODUCTION 1
1.1 Background 1
1.1.1 Development of Banking Sector in Kenya 3
1.1.2 Credit Risk Management 9
1.2 Problem Statement 12
1.3 Research Questions 14
1.4 Objectives of the Study 14
1.5 Significance of study 14
1.6 Organization of the Study 15
CHAPTER TWO: LITERATURE REVIEW 16
2.1. Introduction 16
2.2. Theoretical Literature 16
2.2.1. Concept of Efficiency 16
2.2.2. Production Approach to Efficiency 16
2.2.3. Structural Approach to Banking Efficiency 20
2.2.4. Stochastic Frontier Approach 21
2.2.5. Data Envelopment Analysis (DEA) 22
2.2.6. Credit Risk Analysis 23
2.3. Empirical Literature 25
2.3.2. Risk and Performance 27
2.4. Overview of Literature 30
CHAPTER THREE: METHODOLOGY 32
3.1. Introduction 32
3.2. Research Design 32
3.3. Theoretical framework 32
3.3.1. Estimation of Panel Data Regression Model 35
3.4. Empirical Model/Model Specification 37
3.5. Data and Measurement Variables 40
3.6. Data Analysis 41
CHAPTER FOUR: RESEARCH FINDINGS 42
4.1 Introduction 42
4.2 Data Envelopment Analysis Results 42
4.2.1 Technical Efficiency Scores for Kenyan Banks 42
4.3 Regression Results 44
4.3.1 Descriptive statistics for dependent and independent variables 44
4.3.2 Diagnostic Tests 47
4.3.3 Interpretation of Estimates 48
CHAPTER FIVE: SUMMARY CONCLUSIONS AND POLICY IMPLICATIONS 50
5.1 Introduction 50
5.2 Summary 51
5.3 Conclusion 51
5.4 Policy Implications 52
5.5 Areas of Further Research 53
REFERENCES 54
List of Tables
Table 1.1 Ratio of non-performing loans to total gross loans ofKenyan commercial banks 6
Table 3.1 Model Variables 41
Table 4.1 Technical Efficiency Scores for Kenyan Banks 43
Table 4.2Descriptive Statistics 45
Table 4.3 Random Effects Model Estimates 46
Table 4.4 Fixed Effects Model Estimates 47
Table Al Output Slacks of the DEA model.. 57
List of Figures
Figure 1.1 Distribution ofNPL'S by sectors (Sep 2012 Vs. September 2013) 7
Figure 1.2 Net non-performing loans in Kenya 8
Figure 2.1 Input orientated technical and allocative efficiencies 19
AE BCBS CBK CE CIS DEA DMU ECM GDP KBA LLP NI NPL OLS ROA ROE SE SFA TE TA Abbreviations Allocative Efficiency
Basel Committee on Banking Supervision
Central Bank of Kenya
Cost Efficiency
Credit Information Sharing
Data Envelopment Analysis
Decision Making Unit
Error Component Model
Gross Domestic Product
Kenya Bankers Association
Loan Loss Provision
Net Operating Income
Non Performing Loans
Ordinary Least Squares
Return on Assets
Return on Equity
Shareholder Equity
Stochastic Frontier Analysis
Technical Efficiency
Operational definition of terms
Banking institutions; are institutions licensed to undertake banking business under the
Kenyan banking act.
Credit Risk; is a possibility oflosing the outstanding loan (extended by a bank) partially or
totally due to default.
Efficiency; is the ratio of actual output to maximum potential output obtainable from a
given input level or the ratio of minimum potential input to actual input required to produce
the given output.
Inefficiency; is the amount by which actual output expected by a firm falls short of
maximum potential output.
Performance; is the end result of the activities undertaken by the banking institutions in
pursuit of their goals measured by their profitability (Return on Assets).
Technical efficiency; is the ability of a bank to obtain maximal output from a given set of
Abstract
CHAPTER ONE: INTRODUCTION
1.1 Background
Banking is a critical sector in an economy and its performance should be monitored closely
to safeguard the interest of a country or region. Banks are catalysts of economic growth
through provision of financial services to the citizenry. Profitable performance of banks
translates to economic growth and stability of an economy through financial stability. Kunt
et al (1998) defines a bank as a financial intermediary whose liabilities are mainly short
term deposits and whose assets are short and long term loans to businesses and consumers.
Banking is the business activity of accepting and safeguarding money owned by other
individuals and entities and then lending it out for profit making. Commercial banks in
Kenya play a pivotal role in economic growth. The domestic economy grew by
approximately 4.7% in 2013 compared to 4.6% in the year 2012. Financial services
contributed 7.2% of the growth, up from 6.5%, during the same period (Republic of Kenya
2013).
Banking is a risky venture. The risks can either be borne by clients or banks. Those
resulting from banks include interest rate risk (high interest rate spreads keeps out potential
borrowers), credit risk, liquidity risk, operational risk, reputation risk while those borne by
clients include risk of fraud among others. For the purpose of this study, credit risk will be
studied in detail. Credit risk is captured by the asset quality (level of non-performing loans
affected by the interest rate regime in the banking system). Credit risk factors include
asset quality (nonperforming loans/ gross loans). Capital structure determines availability
offunds to cover risk; liquidity shows the ability of banks to avail cash to clients on demand
while asset quality is measured by the level of nonperforming loans. If credit risk is high,
it makes banks vulnerable to instability because loans form relatively a larger portion of a
bank's assets thus becoming a major source of its income. The instability brings about
destabilization in the entire financial sector since banks playa major role in financial
stability. Credit creation plays a pivotal role in a banks' profitability as a result emphasis
is placed on the same. Interest rate risk affects credit risk in various ways; high interest
rates keeps away potential borrowers who are risk averse, it attracts borrowers who are risk
takers and therefore likely to default and when the default rate is high banks tend to pass
high rates to good customers causing them to become defaulters. Hence upsurge in interest
rate risk increases probability of default on loan.
Increase in nonperforming loans could affect banks negatively since they pose a potential
credit risk hence hampering banks' from achieving their objectives. Non-performing loans
measure the percentage of loan values that are not serviced for three months and above
(Ahmad and Ariff, 2007). If banks manage their credit risk exposure appropriately, they
not only increase their profitability but also the benefits trickle down to economic stability
and efficient capital allocation in the economy.
Ahmad (2006) observed that services in the banking industry have changed dramatically
in recent years across the globe resulting in the diversification of bank products and
and efficiency of afore mentioned commercial banks. Since banking and the associated
risks are inseparable, there is need to study efficiency of banks along with the risks
associated with banking. Ideally this study seeks to demystify the relationship between the
two since earlier studies have disregarded the same.
1
.
1
.
1
Development of Banking Sector in Kenya
Kenya is a developing economy with a vibrant financial sector. The financial sector is
largely comprised of commercial banks which contribute immensely in capital formation
through lending to private and public sectors, deposit and saving mobilization and to a
larger extent financial intermediation.
Commercial banks operate under the Banking act of Kenya (Chapter 488). They are
supervised and regulated by the Central Bank of Kenya. The Companies Act (Chapter 486,
2010), the Central Bank of Kenya (CBK) Act and the Banking Act are the main regulators
and governors of banking industry in Kenya. These Acts are used together with the
prudential guidelines which Central Bank of Kenya issues from time to time. In 1995 the
exchange rate controls were lifted after the liberalization of the financial sector in Kenya
leading to increased competition amongst banks.
Development of banking in Kenya dates back to pre-independence era. It related to
commercial connections in East Africa which existed towards the end of the 19th century.
Until independence commercial banks were characterized by high degree of concentration
in major towns, an exclusive financing of trade and elaborate system of branch banking
The banking system was energized in 1960's when Co-operative bank was formed in 1968
and business of Ottoman bank was taken over by National Bank of Kenya. National and
Grind lays Bank that operated as a retail commercial bank was nationalized and renamed
Kenya Commercial Bank (KCB) in 1971, with 60% government ownership. In Kenya there
are 44 licensed banks, 43comrnercial banks and 1 mortgage and financial institution. Out
of the 44; 31 are locally owned while 13 are foreign owned. Of the 31 locally owned banks,
the government of Kenya has a significant shareholding in four banks namely;
Consolidated Bank of Kenya (77.8%), Development Bank of Kenya (100%), The National
Bank of Kenya (70.6%) and KCB (17.74%).
Vision 2030 (Republic of Kenya, 2007) puts banks at the forefront of economic growth
through provision of financial services. Its aim is to have a vibrant and globally competitive
financial sector driving high levels of savings and financing Kenya's investment needs. By
the year 2030 savings rates are to rise from 17% to 30% of GOP. This has to be achieved
through increase in bank deposits from 44% to 80% and reduce the cost of borrowed
capital. Of importance also is to decrease total population without access to finance
drastically. Saving of up to 10% of GOP for investment is targeted to be realized from
remittances and FOr and foreign bonds. This blueprint was to be monitored through
flagship projects of2012.
Kenyan banks have realized tremendous growth in the last five years and have expanded
to the East African region. The banking industry in Kenya has also involved itself in
of their customer and globalization challenges. This has served the Kenyan economy well
as the customers and shareholders are the ones who have benefited the most. Some key challenges for the banking industry in Kenya include; new regulations especially with the
passing of the new constitution. Therefore the contribution of banking to GDP in Kenya
cannot be overemphasized.
Banking Risk
A risk can be defined as a danger that a certain unpredictable contingency can occur which
generates randomness in cash flow (Allen et al, 2005). Banking risk is the risk associated
with the banking activity. When profitability is measured by return on investments, credit
risk, liquidity risk and capital risk are the major factors that affect bank performance
(Kolapo, 2012). Credit risk can be considered the most prominent because it defines the
banks' asset portfolio. Therefore high exposure of banks to credit risk leads to a tendency
of banks experiencing financial crisis vice versa. Major causes of serious banking problems
continue to be directly related to low credit standards for borrowers and counterparties,
poor portfolio management and lack of attention to changes in economic or other
circumstances that can lead to deterioration in the credit standing of bank's counter parties
(Nawaz and Munir, 2012). Kithinji (2010) defined credit risk as the possibility that the
actual return on an investment or loan extended will deviate from that which was expected.
Some of the sources of credit risk are limited institutional capacity, inappropriate credit
policies, volatile interest rates, poor management, inappropriate laws, low capital, massive
licensing of banks, inadequate supervision of central bank, poor loan underwriting, poor
A close look at Kenya's financials show that, the stock of nonperforming loans increased
by 42.1 % to 80.3 billion in 2013 probably due to high interest rates experienced over one
year resulting in defaults on loans (Central Bank of Kenya). The ratio of gross
non-performing loans to gross loans increased to 5.4% in 2013. Quality of assets measured as
a proportion of net non-performing loans to gross loans deteriorated from 1.5% in May
2012 to 2.6% in May 2013.
Table 1.1 Ratio of non-performing loans to total gross loans of Kenyan commercial banks.
Year 2008 2009 2010 2011 2012 2013
% 9.0 7.9 6.3 4.4 4.5 5.4
Source: World Bank, Kenya.
Table 1.1 shows that there is a fluctuating trend in the ratio of non-performing loans to
gross loans in Kenya from 2008-2011 and thereafter an increasing trend from 2012 to
present; why the sudden increasing trend is a topic of research?
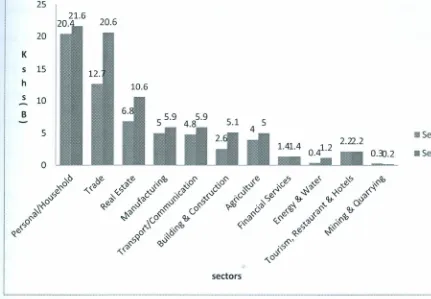
Studies of different sectors show that nonperforming loans increased by 31.3% to Kes. 79.7
billion as at September 2013(CBK, 2013). Ratio of gross NPL's to gross loans increased
from 4.6%to 5.2% in September 2013. Eight sectors experienced an increase in NPL's by
25
20
K s 15 h
s 10
B
5 .Sep-12
.Sep-13
o
sectors
Figure 1.1 Distribution ofNPL'S by sectors (Sep 2012 Vs. September 2013)
Source: Central Bank of Kenya (Bank Supervision Report)
Evidently there is a potential problem in the Kenyan banking system arising from the fact
that non-performing loans have slightly increased from 4.4% in 2011 to 5.4% in 2013. This
can not only be attributed to an upsurge in interest rates and growth in loan book since
there is increased information sharing through credit reference bureaus and introduction of
stringent credit policies by banks. Though several explanations have been given ranging
from the heat of general elections that come with uncertainty and increased rate of interest,
there is a felt need to address the sudden upward increase in NPL's experienced lately
affects credit risk in various ways;
high interest rates keeps away potential borrowers who are
risk averse, it attracts borrowers who are risk takers and therefore likely to default
.
Kenya's
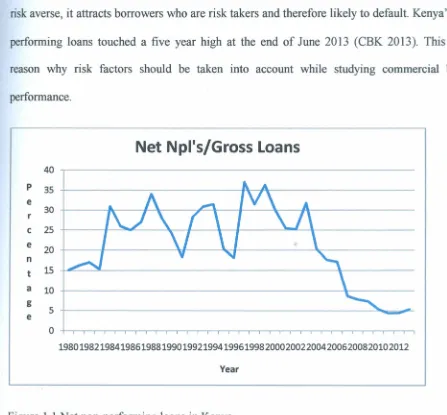
non-performing loans touched a five year high at the end of June 2013 (CBK 2013).
This is the
reason why risk factors should be taken into account while studying commercial banks'
performance.
Year
Net Npl's/Gross
Loans
40
P 35
e 30 r
c 25
e 20
n
t 15
a 10
g 5 e
o
~"""".-"".-,,-..-,,-..-,,-..-,,-..-"""'"
19801982198419861988199019921994199619982000200220042006200820102012
Figure 1.1 Net non-performing loans in Kenya
Source CBK (Bank Supervision Annual Reports-various issues)
.
Figure 1
.
2 shows that net NPL's increased from approximately 15% in 1980 to 36
.
1% in 2000
reduced gradually until 2008 and thereafter assumed an increasing trend from the year 2010 to
1.1.2 Credit Risk Management
Credit risk management is very important to banks as it is an integral part of the loan
process, it maximizes bank risk adjusted rate of return by maintaining credit risk exposure
with view to shielding the bank from the adverse effects of credit risk (Musyoki and
Kadubo, 2011).
Risk management is defined as the process that a bank puts in place to control its financial
exposures (Kithinji, 2010). It is a requirement of every bank worldwide to be aware of the
need to identify measure, monitor and control credit risk while also determining how credit
risk could be lowered. Basel Accord (2001) observes that banks engage in business
activities like asset management, payments and settlement and other processing related
businesses that earn them income. And at the same time they often contain important
elements of operations risks. The Basel Committee on Banking Supervision (200 I)
identifies basic risk management tools as development of appropriate corporate policies
and procedures, use of quantitative methods to measure risk, pricing products and services
according to their risks, establishment of risk limits, active management of risk through
diversification and hedging technologies and building of cushions (both
reserves/provisions and capital) to absorb losses.
Kunt and Detragiache, (1998) observed that when the value of assets is less than the value
ofliabilities then the bank is insolvent. This may be due to credit risk which can be reduced
through screening loan applicants and diversifying loan portfolios through lending to
borrowers who are subject to different risk factors. If loan losses exceeds a bank's
Kolapo (2012) identified strategies for hedging against credit risk as use of credit
derivatives i.e. the ability of banks to lend more than they would at lower rates to riskier
borrowers, credit securitization, and adoption of sound internal lending practices among
others.
Banks have continued to use Credit Information Sharing (CIS) mechanism since July 2010
(CBK, 2013). Reports stood at 3,255,519 in September 2013 up from 2,907,375 reports in
June 2013. The increase in demand for credit reports by banks demonstrates the importance
of these reports in enhancing credit appraisal standards.
Bank Efficiency in Kenya
Efficiency of a firm usually means its success in producing as large as possible an output
from a given set of inputs (Farrell, 1957). A bank is economically efficient if it operates
with both technical and price efficiencies. Furthermore a firm is said to be more technically
efficient than the other if it produces relatively larger output from the same set of inputs
(Kamau, 2009).According to (Coelli et al, 2006) efficiency consists of two components;
technical and allocative. Technical efficiency reflects the ability of a firm to obtain
maximal output from a given set of inputs while allocative efficiency reflects the ability of
a firm to use the inputs in optimal proportions given their respective prices and the
production technology. Kenya exhibits low technical efficiency of financial intermediaries
as evidenced by high interest spreads in the banking sector. High interest spreads and
margins are the result of underlying deficiencies and impediments in the financial systems
(according to asset base) has a 50% and above efficiency scores (Muniu 2009). Kenya
commercial banks rank fairly in allocative and profit efficiencies (though not fully
efficient) but not in technical efficiency.
Bank Performance in Kenya
Performance in Kenyan commercial banks can be viewed from a profitability point of view.
Profits are the major motive of every business and every firm's performance is pegged on
its ability to make profits. Determinants of bank performance include; liquidity, credit
quality, core capital, asset quality, earnings, capital adequacy among others. Bank earnings
are measured by ratios like net interest income to average asset ratio. Low levels of this
ratio are not good for the bank; similarly a high ratio may indicate high lending rates.
Kamau (2009) observed that in efficient banking system market forces determine bank
rates while inefficient system rates are misaligned to market fundamentals pertaining
demand and supply widening the gap between lending and fixed deposits rates. Capital
regulation reduces bank failures, for instance equity capital provides a cushion to absorb
losses that would otherwise cause a bank fail which affects the entire financial system.
Capital adequacy is measured by minimum core capital to total deposits and core capital!
total risk weighted assets.
Asset quality is another bank performance determinant. Credit quality is important for both
resource allocation and growth. Poor credit quality synonymous to credit risk may cause
volatility in the total credit with possible backward linkages to the same banking system.
Quality of credit is a specific signal of the soundness of the efficient allocation of capital
measured as a ratio of nonperforming loans net of provisions to gross loans. A high level
of nonperforming loans shows that the bank is experiencing some inefficiency in the
process of intermediation. Liquidity is also of great importance, it's measured by the ratio
of the net liquid assets to total deposits. When the ratio is high it indicates that the bank is
keeping excess reserves. In a credit needy country as Kenya, banks should not hold excess
reserves unless it's pegged in the inefficiencies existing in the intermediation process.
Returnon Assets (as a measure of profitability) is a common figure used for comparing the
performance of financial institutions because a majority of their assets have a book value
that is close to their actual market value.
An evaluation of the Kenyan banking as at December 2013, Return on assets increased
from 1.66% in 2003 t02.74% in 2010 and decreased to 1.31% in 2013. Similarly NPL's increased by 30.91 % to Ksh.80.59 billion in the year 2013. Ratio ofNPL's net of provisions
to gross loans decreased from 38.5% in 2003 to 4.4% in 2011 and started rising gradually to 5.4% in 2013. Since NPL's are indicators of credit risk their increases poses a potential risk to performance of commercial banks in Kenya.
1.2 Problem Statement
Performance of financial institutions measured by their profitability is a key component of
economic growth of any region, country or geographical location because they contribute
immensely to economic growth through provision of financial services. Many factors affect
performance of banks including asset quality, credit risk, efficiency, capital structure
non-performing loans in banking industry (Kamau, 2009 and Kithinji, 2010) and observed that
the aforementioned issues affect performance of financial institutions in one way or
another. Liberalization of Kenyan banking industry in 1992 marked the beginning of
intense competition among commercial banks, consequently, extending huge amount of
credit in the view of increasing profitability. This led to increase in nonperforming loans
and subsequently eroded profits due to increased loan provisioning to meet regulatory
requirements. Kenya Vision 2030 blue print envisages savings to rise to 30% of GDP.
These savings could translate to loans to both public and private sectors through
intermediation role played by the banking industry. Asset quality of commercial banks in
Kenya as measured by the ratio of total NPL's to total loans shows a worrying trend; the
ratio recorded a fluctuating trend from the year 1980 reaching its highest in 2000, dipped
in 2008 and thereafter assumed an upward trend (figure 1.2). This implies that although
growth has been experienced in loans and advances, NPL's might have been growing at a
faster rate. These trends necessitate research because an increase in nonperforming loans
signals an increase in credit risk and this poses a potential risk to profitability of
commercial banks in Kenya.
Ahmad (2006) observed that studying banking efficiency with exclusion of quality and risk
factors may misguide the results of efficiency and performance of these banks. Risk and
quality factors may explain the differences in efficiencies and hence performance across
the banks significantly; calling for their inclusion in any study on commercial banks'
performance. To conclude that efficiency is not sufficient to assess the overall performance
study introduces a measure of bank risk and quality factors into the banks' performance
structure.
1.3 Research Questions
The study therefore sought to answer the following questions;
1. What is the effect of credit risk on the performance of banking institutions in
Kenya?
11. What is the relationship between efficiency and banking institutions performance
in Kenya?
1.4 Objectives of the Study
The major objective of this paper was to investigate how commercial banks credit risk
affected the performance of these institutions, specific objectives were to;
1. Establish the effect of credit risk on the performance of banking institutions in
Kenya.
11. Determine the relationship between efficiency and banking institutions
performance in Kenya.
1.5 Significance of study
This study brought an insight into the efficiency of commercial banks particularly and
performance generally having incorporated risk and quality factors, therefore enabling the
Kenyan banking sector to place itself strategically in service delivery hence increasing their
was of considerable interest to measure efficiency involving institutions and explain
measured variation in the efficiency of institutions.
1.6 Organization of the Study
This research project sought to establish the relationship between banking risk and
efficiency in Kenyan commercial banks. The study employed panel data for commercial
banks in Kenya for analysis purposes. The study was organized into five chapters, general
introduction was captured in chapter one. Chapter two reviewed related literature both
theoretical and empirical. Model specification, estimation procedures and sources of data
were captured in chapter three. Chapter four presented research findings while chapter five
CHAPTER TWO: LITERATURE REVIEW
2.1.Introduction
This chapter looked at literature related to this study. It contains the theoretical literature
review in section 2.2, empirical literature both general section 2.3.1 and specific to banking
section 2.3 .2, overview of literature and finally the critique of the literature in section 2.4
2.2. Theoretical Literature
2.2.1. Concept of Efficiency
Efficiency can be defined as the comparison of what is actually produced or performed
with what can be achieved with the consumption of resources (money, time, labor e.t.c). It
is an important aspect of productivity. Efficiency is a measurable concept, quantitatively
determined by the ratio of output to input (production approach). According to (Coelli et
al 2006) efficiency consists of cost efficiency and scale efficiency. Cost efficiency can be
decomposed into allocative and technical while scale efficiency refers to the amount by
which productivity can be increased by moving to the most productive scale size. To
measure it we must have a method for identifying the most productive scale size. Efficiency
can also be looked from a structural point which involves comparing an industry's
performance with the efficient production function derived from its own constituent firms.
It compares how an industry keeps up with the performance of its own best firms.
2.2.2. Production Approach to Efficiency
Distance functions allow one to describe a multi-input, multi-output production technology
without the need to specify the behavioral objective (such cost minimization or profit
maximization). An input distance function characterizes the production technology by
looking at a minimal proportional contraction of the input vector given an output vector.
An output distance function considers a maximal proportional expansion of the output
vector given an input vector (Coelli, 2006). These functions provide a conceptual
underpinning for various efficiency and productivity measures.
Input distance function which involves scaling the input vector is defined on the input set
L(q) as;
di(x,q)
=
Max{p(x
/
p)&L(q)}.
L (q) represents the set of all input vectors x, which can produce output vector q. output
distance function can be defined on the output set P(X) as;
do (x, q)
=
Min
{J(x / J)c:p(x)}
B. Technical Efficiency Measurement Using Distance.
According to (Coelli et al, 2005) efficiency consists of two components; technical and
allocative efficiencies. Technical efficiency reflects the ability of a firm to obtain maximal
output from a given set of inputs while allocative efficiency reflects the ability of a firm to
use the inputs in optimal proportions given their respective prices and the production
technology. Coelli further notes that a firm can be technically efficient but may still be able
Technical efficiency refers to the ability of the firm to obtain maximum output from a given
set of inputs while allocative efficiency reflects the ability of a firm to use the inputs in
optimal proportions given their respective prices and the production technology, (Coelli et
al, 2006). These two measures can then be combined to provide a measure of total
economic efficiency. Input orientated measures were propounded by Farrell using a simple
example involving firms that use two inputs to produce a single output assuming constant
returns to scale. Technical efficiency can be measured if there is knowledge of the unit
isoquant of fully efficient firms.
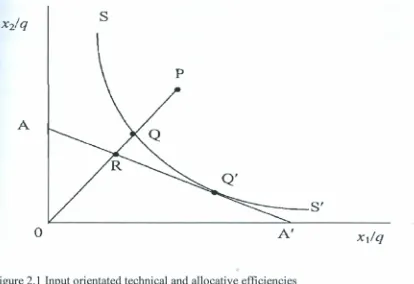
If a firm uses quantities of inputs, defined by the point P to produce a unit of output, the
technical inefficiency of that firm could be represented by the distance QP. This represents
the amount by which all inputs could be proportionally reduced without a reduction in
output expressed as QP/OP- represents the percentage by which all inputs need to be
reduced to achieve technically efficient production. Technical efficiency is measured by
the ratio ofOQ/OP= 1- QP/OP,
O(TE(1
IfTE=1 then the firm is technically efficient.The input oriented measure of technical efficiency of a firm can be expressed in terms of
input distance function d. (x, q) as
s
A
-
-..
...
;:::
-
-
--s'
o
A'
Figure 2.1 Input orientated technical and allocative efficiencies
The firm is technically efficient if it is on the frontier in which TE=I. If the price ratio
represented by the slope of the iso-cost line AA' in the figure above is known then
allocative efficiency and technical efficiency measures can be calculated using the iso-cost
line.
AE =
W'X*/w'
X =ORlOQ
and TE =W'
X/W'X
=OQ/OP.
The above equations assume that the distance RQ represents the reduction in production
costs that would occur if production were to occur at the allocativelly (and technically)
efficient point
Q'
instead of atthe technically efficient, but allocativelly inefficient pointQ. Given technical efficiency the total overall cost efficiency CE can be expressed as a
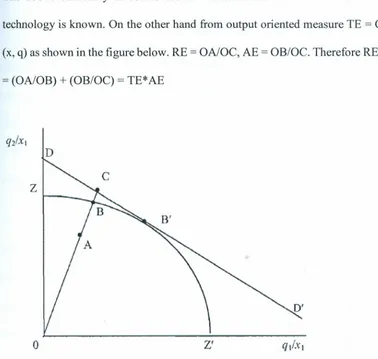
The above efficiency measures assume constant returns to scale and that production
technology is known. On the other hand from output oriented measure TE
=
OAlOB=
do(x, q) as shown in the figure below. RE
=
OAlOC, AE=
OB/OC.Therefore RE=
(OAlOC)=
(OAlOB)+
(OB/OC)=
TE* AED
z
o
Z'
Figure 2.2 Output orientated technical and allocative efficiencies.
2.2.3. Structural Approach to Banking Efficiency
Structural bank efficiency can be can be categorized into X- efficiency and operational
efficiency (Leaven, 1997). Operational efficiency is used to measure efficiency while
X-efficiency explains the differences in efficiencies between banks. Operational X-efficiency
can further be categorized into technical and allocative efficiencies. Technical efficiency
shows how far the bank is from the isoquant and allocative efficiency captures
input prices, both give rise to operational efficiency. X-efficiency may arise due to reasons
outside the knowledge or capability of management.
Structural efficiency of a firm can also be evaluated using financial ratios, parametric
approach and non-parametric approach (Muzafar et al,2005). Frontier efficiency measures
deviations in performance from that of firms with best performance on the efficient frontier
holding constant a number of exogenous market factors like prices in local markets. The
parametric and non- parametric measures of efficiency are discussed below
In providing services individual banks efficiency determines the efficiency of the entire
industry which influences the effectiveness of the domestic financial intermediation
mechanism. Banks are characterized by relatively low levels of overall efficiency and in
general more allocativelly than technically efficient (Hassan et al 1990). Hassan further
asserts that the technical component is relatively more important than allocative component
as a source of inefficiency.
2.2.4. Stochastic Frontier Approach
This approach takes the form In qi=x'i~
+
Vi- u, where Viis the statistical noise. It is calledthe stochastic frontier method because the output values are bounded from above by the
stochastic (random) variable exp (X'i~
+
Vi). The Cobb Douglas stochastic frontier modeltakes the form;
Ln qi
=
~o+
~tlnxi+
Vi-u:Where:
exp (po
+
~dnxi) = is the deterministic component and(vi)
=
is the noise and (- u.) is the inefficiency. (Coelli et al 2005).Stochastic frontier approach is considered the best because it assumes that maximizing behavior is present and that it is exhibited by the most efficient firms.
2.2.5. Data Envelopment Analysis (DEA)
This method involves use of linear programming methods to construct a non-parametric piecewise surface (or frontier) over data. It evaluates the efficiency of a set of peer entities called Decision Making Units (DMUs) which convert multiple inputs into multiple outputs.
Chames, Cooper and Rhodes (1978) described DEA as a mathematical model applied to
observational data that provides a new way of obtaining empirical estimates of relations.
Assume data on N inputs and M outputs for each of I firms. For the ith firm these are
represented by the column vectors Xiand qi respectively. The n x 1 input matrix xand m x
1 output matrix q which represent the data for all the I firms.
The optimal weights are obtained by solving the mathematical programming problem
Max u,v (u'qj/v'x.)
S.t u'C]j/V'Xi:S1 j =1,2 ....1
u,v 2:0 values for u and v are found such that the efficiency measure for the ith firm is
to one. The DEA model can be input or output oriented, but under the assumption of
constant returns to scale, the results are invariant
2.2.6. Credit Risk Analysis
Credit risk is the probability of incurring losses resulting from nonpayment of loans and
other forms of credit by debtors. Creation of credit forms a larger chunk of income for the
banks but involves large risk to both the lender and borrower. This further reduces banks'
profitability. The risk of customers or counter party default is the biggest credit risk facing
banking and financial intermediaries (Munir and Nawaz, 2012).
There are several ways of analyzing and mitigating risk. They range from securitization,
derivatives and sound lending policies among others. Credit derivatives provides banks
with an approach which does not require them to adjust their loan portfolio. They give
banks new sources of income and offer banks the opportunity to reduce their regulatory
capital (Shao and Yeager, 2007). The most common form of credit derivatives is the credit
swap whereby a seller agrees to shift the credit risk of a loan to the protection buyer. Recent
innovations in credit derivatives markets have improved lenders' abilities to transfer credit
risk to other institutions while maintaining relationship with borrowers (Marsh, 2008)
Credit securitization is a form of credit risk management tool. It is the transfer of credit
risk to a factor or insurance firm and this relieves the bank from monitoring the borrower
and fear of hazardous effect of classified assets. The growing popularity of credit risk
securitization can be put down to the fact that banks typically use the instrument of
source of funding by realizing regulatory arbitrage and liquidity improvements when
selling securitization transactions (Michalak and Uncle, 2009)
Kithinji, 2010 observed that banks should adopt sound intemallending policies. Lending
policies guide banks in disbursing loans to customers, strict adherence to the policy is the
cheapest and easiest method of risk management according to Kithinji. The policy should
be in line with overall bank strategy and the factors considered in designing a lending
policy should include the existing credit policy, industry norms, general economic
conditions of a country and prevailing economic climate.
Credit analysis is a way by which lenders ascertain the credit worthiness of borrowers
(Sirnkovic and Kaminetzky, 2011). Lenders do so by assigning a risk rating derived by
estimating the probability of default by the borrower at a given level of confidence over
the life of the facility and estimating the amount of loss the lender will suffer in case of
default. Credit analysis involves; ratio and trend analysis, creation of projections and
detailed analysis of cash flows, examination of collateral, credit history and managerial
ability. Most lenders use credit ratios and scores which are numerical expression based on
a level analysis of a person's credit files, to represent the creditworthiness of that person.
Lenders use these scores to ascertain the potential risk posed by lending money to
consumers and to mitigate losses due to bad debt. Some of the credit ratios include gearing
ratio, liquidity ratio, cash flow ratio, profitability ratio among others. Gearing ratio
provides an indication of the long term solvency of the firm. Liquidity ratio attempts to
financial leverage demonstrating the degree to which a firm's activities are funded by
owners funds versus creditors funds. Credit bureaus are also used as a form of credit risk
management. It is an institution which compiles customers' information and sells this
information to banks as regards the lending profile of a borrower. The bureau awards a
credit score called statistical odd to the borrower which makes it easier for the banks to
make instantaneous lending decisions. Examples in Kenya include Transunion and
Metropol.
The importance of analysis cannot be overemphasized, for prudence purposes where the
lender ensures that their actions are prudent because excessive credit is detrimental to every
party involved. Analysis is also important because incidences of bankruptcies are high
during recessions hence need for accurate analysis to avoid losses.
2.3. Empirical Literature
This section is divided into literature of risk related to efficiency and that related to
performance. Performance is pegged on efficiency hence their analysis goes hand in hand.
2.3.1. Risk and Efficiency
Kamau (2009) investigated efficiency and productivity in the banking sector in Kenya
using both Data Envelopment Analysis and Stochastic Frontier Analysis and found out that
though the banks were not fully efficient in all respects they performed fairly well in the
period under review, hence need to explore more ways of making the banks more efficient.
He identified some of the causes of inefficiency in the banking sector as productive
same cost, allocative inefficiency where resource allocation to alternative uses doesn't fit
well with consumers taste and agency problem which is a consequence of management
styles (operations under own-manager increases productivity as opposed to employee
manager control).
Leaven (1997) while seeking to establish risk and efficiency of East Asian banks found out
that the efficiency for all the banks he studied in the five countries did not increase
significantly. For Philippine, Indonesia and Thailand there was a substantial increase in
efficiency. In Korea and Malaysia they stayed roughly constant. Banks experienced
extremely high loan growths, since a substantial part of those loans were actually
non-performing and therefore risky. In conclusion leaven said that apart from efficiency
measures, there is need for evaluation of risk factors. The study found out that performance
is a combination of high efficiency with low risk taking. Foreign banks took little risk
relative to other banks in East Asia, family banks were the most risky as well as company
banks.
Ahmad (2006) while investigating how banks' capital structure, liquidity and
non-performing loans affect the efficiency of commercial banks in Pakistan observed that, asset
quality and capital structure raise particularly important research and policy questions
regarding the banking industry as they control for quality and risk factors of financial
institutions. Ahmad used the stochastic cost frontier i.e. an input output vector that
incorporates a proxy for risk measurement, he was able to calculate the efficiency of
the restricted function excluding risk and quality factors from the model. From the findings he observed that inclusion of risk and quality factors improve efficiency of commercial banks of Pakistan.
Jackson et al (2000) in his investigation of the performance of Turkish commercial banks used Data Envelopment Analysis to evaluate technical efficiency of individual Turkish commercial banks and used the Tobit model to investigate determinants of efficiency. He found out that banks with low-risk portfolios as measured by a higher capital adequacy ratio are likely to be less efficient. This was probably because they rather preferred safer and lower earning portfolios over riskier but high earning portfolios. He therefore concluded that significance of bank size is an indication of higher efficiency oflarge banks.
That more profitable banks achieved higher efficiency while those with higher capital adequacy ratio are less efficient since they're risk averse and prefer safer and lower earning portfolios. State ownership and the branch expansion policies may be an impediment for being efficient in the Turkish commercial banking sector. However they noted that there were relatively little empirical investigations into the determinants of (in) efficiency using censored regression techniques, this necessitates further research.
2.3.2. Risk and Performance
hedge some of the credit risk due to fluctuations of the domestic economy by lending
abroad to diversify the risk. However the study left open the question of how sensitive the
correlations were to different aspects of the methodology such as estimation technique, the
treatment of crisis years and the set of other explanatory variables included in the
regression. These among other factors alike puts much focus on macroeconomic and
institutional variables at the expense of variables that captured the structure of the banking
system warrants further research.
Hakim and Neaime (1998) studied performance and credit risk in banking; a comparative
study of Egypt and Lebanon. Their motivation was their observation that banking
efficiency models fail to account for risk taking behavior and their results may be
misleading. They employed panel data estimation using 43 Lebanese and 62 Egyptian
banks between the years 1993-1999. They used fixed effects model. The results showed
that return on equity in banking is a direct and an increasing function of the banks' lending
activities irrespective of Lebanon or Egypt. They conclude that the credit variable is a good
predictor for profitability across all banks. Bank profitability was a positive and direct
function of lending activities. High ratio of loans to assets (net provisions for doubtful
accounts) indicates additional risk taking on the part of the bank and therefore would
translate in a higher return on equity to the extent that higher calculated risk leads to higher
return.
Kithinji (2010), sought to investigate the credit risk management and profitability of
the ratio of net profits to total assets was regressed against amount of credit (LNTA) and
level of nonperforming loans (NPLlTA). She found out that level of nonperforming loans
decreased during the period 2004 to 2008. It might have been caused by the requirement
by the Basle 2 for commercial banks to control their level of nonperforming loans thus
reducing banks credit risk. On average the profit of the banking industry increased during
the period 2004 to 2008.
Musyoki and Kadubo (2011) investigated the impact of credit risk management on the
financial performance of banks in Kenya between the years 2000-2006. They assessed
various parameters pertinent to credit risk management as it affects banks' financial
performance. Ordinary least squares method was employed. The study found out that the
default rate as one of risk management indicator is a major predictor of the bank financial
performance.
Kargi (2011) sought to explain credit risk and performance of Nigerian banks, the study
also sought to identify the relationship between the nonperforming loans and commercial
banks profitability and evaluate the effect of loan ad advance on banks profitability of
Nigerian banks. Using OLS method, the study found out that commercial banks
profitability is inversely influenced by the levels of loans and advances, non-performing
loans and deposits thereby exposing them to great risk of illiquidity and distress.
To examine the impact of credit risk on profitability of Nigerian banks (Nawaz and Munir,
2012) sought to determine the relationship between the non-performing loans and bank's
banks. The research employed Ordinary Least Squares and found out that commercial
banks profitability is inversely related or influenced by levels of loans and advances,
non-performing loans and deposits thereby exposing them to great risk of illiquidity and
distress. Improper credit risk management reduces the bank profitability; affect the quality
of assets and increase loan losses and non-performing loans which may eventually lead to
financial distress.
Kolapo (2012) while assessing the impact of credit risk on performance of Nigerian banks
over a period of ten years using panel model, found out that the effect of credit risk on bank
performance measured by return on assets of banks is cross sectional invariant i.e. nature
and managerial pattern of individual firms do not determine the impact. The study was
significant because it provided policy measures to the various stakeholders on how to tackle
the effect of credit risk in order to enhance the quality of banks' risk assets. Further he
found out that loans and advances ratio exerts most significant positive effect on the
profitability. He also found out that loans and advances ratio exerts most significant
positive effect on the profitability across banking firms.
2.4. Overview of Literature
Studies on banking risk suggest that exclusion of quality and risk factors may misguide the
results of efficiency of these banks. Recent studies carried out to measure performance of
banking sector in Kenya; however they are limited to investigate the efficiency of banks in
one or the other hand. They do not focus on risk and quality factors which explain the
capture the goal of banks to maximize profits by raising revenues as well as reducing costs
and doesn't account well for unmeasured changes in output quality. To conclude that
efficiency isn't sufficient to assess the overall performance of banks is quite in order hence
risk factors should be taken into account. Therefore this study introduces a measure of bank
CHAPTER THREE: METHODOLOGY
3.1. Introduction
This chapter consists of theoretical framework in section 3.3 under which there are
different panel data regression approaches i.e. fixed and random, technical efficiency and
financial ratios. Then the empirical model in section 3.4, data and measurement of variables in section 3.5 and data analysis in section 3.6
3.2. Research Design
The study sought to establish the effect of credit risk on efficiency of banking institutions
and thereafter determine the relationship of credit risk and performance of banking
institutions in Kenya. The study employed a non-experimental research design.
Quantitative data from commercial banks was used; cross sectional data from the same
banks was used for the efficiency model. For the performance model panel data for three
years was used. Coefficients for non-performing loans, loan loss provision, loans and
advances and technical efficiency were used to determine relationship between credit risk
and performance of banking institutions. Technical efficient scores were used to analyze
the effect of efficiency on performance of banking institutions.
3.3. Theoretical framework
A. Technical Efficiency Model,
Efficiency of a firm is closely related with the concept of profitability. Theoretically firms
choose levels of inputs and outputs to maximize profits. Technical efficiency reflects the
ability of a firm to obtain maximal output from a given set of inputs (Coelli et al, 2005). It
Suppose a firm uses an N dimensional vector of non-negative real input xto produce an M
dimensional output vector q,production possibilities can be represented by the technology
set S.
S= {(x,q):x can produce q} .3.1
This set contains all input-output vectors such that x can produce q. The production
technology can be defined as;
P(x) = {q:x can produce q} = {q: (x, q) (S} 3.2
To know whether the firm was efficient in production process the output distance function
is used. It is defined as the maximum scaling (1/0)
e
such thate
defines the amount bywhich output could have been expanded given the inputs used if technology for a certain
period had been fully utilized.
do (x, q) = min {S: (q/S) (P (x)} 3.3
do(x, q) measures technical efficiency at the observed input vector x and the observed
output vector q.
B. Financial Ratios
Firm's management mostly uses profits as a performance measure (Gibson, 2009).
Entrepreneurs make decisions that are geared towards profit maximization. A multi-input,
multi-output firm solves the problem
IT (p, w) = max pq - wx 3.4
Where
IT
(p, w) is profit which varies with output prices (P) and input prices (w)q is a vector of outputs
x is a vector of inputs
T (q, x)
=
a transformation function for a firm that uses n- inputs to producem-output. Therefore bank performance can be studied under the theory of profit
maximization. Financial ratios can be used as a proxy for measuring profitability. These
are accounting ratios used to evaluate performance of a firm. The ratios used are Return on
Assets (ROA) and Return on Equity (ROE). These ratios are advantageous since they
comprise an aspect of efficiency (Hays et aI, 2009).
ROA
=
NIITA
3.5
ROE =N I
ISE
Where ROA is return on assets, ROE is return on equity, NI is net operatingincome and SE is shareholder equity. ROA ratios indicate how many shillings can a firm
get from a shilling of the asset it has. This ratio is useful for competing firms. ROE
measures rate of return on ownership of interest of the common stock. It measures a firm's
efficiency at generating profits from every unit of shareholders' equity (Hays et aI,2009).
It shows how well a company uses investments funds to generate earnings growth. This
study used ROA due to scarcity of data on shareholder equity.
C. Credit Risk
Credit risk is based on the Hawley risk theory of profit which stipulates that risk taking is
a right to a reward known as profit. Credit risk measures include ratio of nonperforming loans to loans and advances, ratio of loans and advances to total deposits and the ratio of
loan loss provision to classified assets. Therefore measures of asset quality, capital
structure and credit quality respectively are shown as follows;
Asset quality =NPLITOT AL LOANS AND ADVANCES
Capital structure = LOANS AND ADV ANCES/DEPOSITS
Credit quality = LLPI ASSETS
Where NPL is nonperforming loans and LLP is loan loss provision.
The three measures of credit risk formed independent variables and the study ascertained
their effect on performance of Kenyan commercial banks.
3.3.1. Estimation of Panel Data Regression Model
1.Fixed Effects Approach
In this approach estimation of panel data regression model depends on the assumption
made about the intercept, the slope coefficients and the error term. The assumptions
include; intercept and slope coefficients are constant across time and space, error term
captures differences over time and firms. Slope coefficients are constant but the intercept
varies over individuals, slope coefficients are constant but the intercept varies over
individuals and time and the intercept as well as slope coefficients vary over individuals
and time. For instance if the slope coefficients are constant but the intercept varies across
individual banks, then the difference across the firms may be brought about by special
Yit = ~Oi+ ~IXlit +~2X2it+ ~3X3it+ !lit 3.6
Subscript i on the intercept term suggest that the intercepts of the banks may be different.
The above model is known as the fixed effects regression model. The fixed effect intercept
is allowed to vary by introduction of dummies for each firm. For instance if we have 4
firms the model becomes;
The equation intercept c 1represents the reference firm, U2,U3,U4represent the differential
intercept coefficients, which show by how much the intercepts of other firms differ from
that of the reference firm.
2. Random Effects Approach
This approach assumes that the intercept has a random variable. Gujarati (2004) observes
that if the dummy variables do in fact represent a lack of knowledge about the true model,
then the ignorance can be expressed through the disturbance term !lit. Bu is no longer fixed;
it is assumed that it is a random variable with a mean value of ~ 1.Intercept value for each
company can be expressed as ~li = ~l+ Ei,where i = 1,2 ... N. the model becomes;
Yit = ~o + ~IXlit +~2X2it+ ~3X3it+ Ei+ !lit 3.8
Where Yit = the cross sectional observation of independent variable Y at time t.
Xrt = the cross sectional independent observable variable at time t
In random effects model the intercept ~o represents the mean value of the (cross sectional)
intercepts and the error component ci represent the (random) deviation of the individual intercept from this mean value; ciis the unobservable variable. The independent variables will be measures of credit risk, technical efficiency while the dependent variable is bank
performance.
3.4. Empirical Model/Model Specification
This study used cross sectional data for three years (2011-2013) to estimate technical
efficiencies for all commercial banks in Kenya. The study chose the years above because
this the period when nonperforming loans started rising gradually as shown in figure 1.2.
Then the study used panel data estimation method to determine the effect of credit risk on
the performance of the banks. The study preferred panel model because a set of banks were
studied for a period of three years.
A. Technical Efficiency Model
DEA model with variable returns to scale was used to measure technical efficiency. DEA
was preferred over SFA because it does not require a priori estimated frontier function as
it generates its own from the given data. DEA is ideal in the banking industry because the
industry is a multi-input and multi-output, there is non-linearity of its input-output
relationships, there is non-physical nature of fundamental resource and products and the
impossibility of drawing on market prices for some of them. DEA is also useful where
there is lack of competitive pricing mechanism as is the case with Kenyan commercial
banks. Cross sectional data for commercial banks in Kenya was used for a period of 3
there after a technical efficiency variable will be introduced in the performance model
through panel data regression method.
Min e,A. 8
11'A,
=
1A,2: 0 3.10
Where;
8 is a scalar and A, is a Ix 1 vector of constraints
Xitis a Nx 1 vector of input values of the ith firm in period t
qu is a Mx 1 vector of output value for the ith firm in period t
Qr is 1xM matrix of output values for all I firms in period t
X, is a 1xN matrix of input values for all I firms in period t
11'A,= 1 is the convexity condition that provides for VRS
B. Performance Model Specification
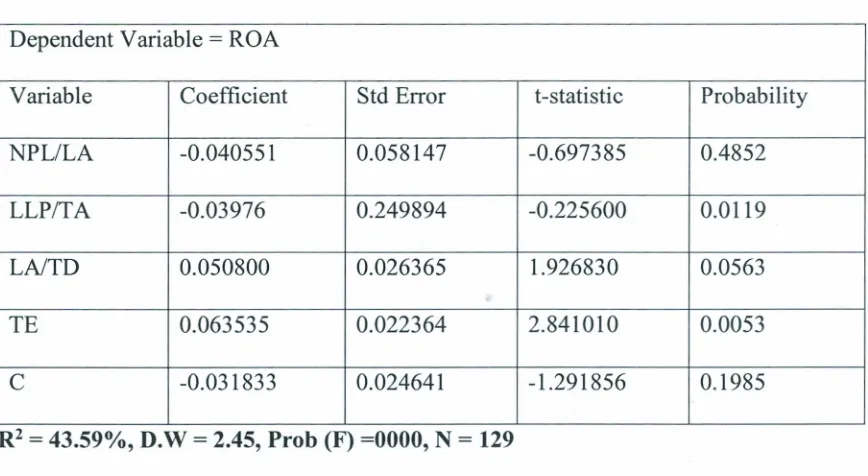
The study employed the Return on Assets model of bank performance as used by Kargi
(2011) and Ko1apo (2012). The choice of whether to use Random Effects Model or Fixed
objectives were answered by equation 3.11. For the second objective, a technical efficiency
variable was introduced in the performance model to determine its effect on the
performance of banks. The model for this study was;
ROA=f (NPLlLA, LLP/TA, LAlTD, TE) 3.11
Where;
ROA: Return on Assets
NPL: Non-Performing Loans
LA: Loans and Advances
LLP: Loan Loss Provision
TA: Total Assets
TD: Total Deposit
TE: Technical Efficiency
The model functionally becomes;
ROA = no +al (NPLlLA) it +a2 (LLP/TA) it +a3 (LAlTD) it + <X4(TE) it+ Wit 3.12
Where; co is intercept, al-a3 are coefficients of independent variables and Witis the error
term. The composite error term Wit= Sit+
un.
sitis the individual specific error componentand u« is the combined time series and cross section error components. Witwas assumed to
have a mean of zero and a constant variance. Also it was assumed that individual error
components are not correlated with each other and are not auto correlated across both cross
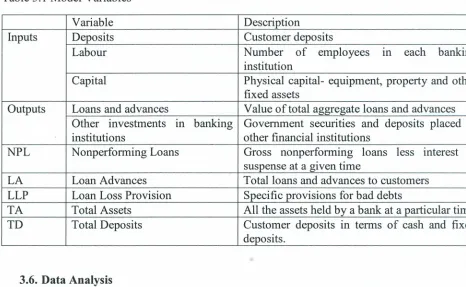
3.5. Data and Measurement Variables
The study used time series and cross sectional data, pooled in panel data set and the
parameters estimated using panel data estimation. Data was collected from all the
commercial banks in Kenya for a period of three years from 2011 to 2013. For the DEA
model data on inputs and outputs was collected for the same period. The inputs were
customer deposits, staff costs were used as a proxy for labour and capital, while outputs
were loans and advances and other investments of the banking industry. Data on loan loss
provision, ratio of loans and advances to total assets and non-performing loans was
collected from individual commercial bank's annual profit and loss accounts and also from
the central bank's annual reports. Inputs and outputs for the DEA model were as shown in
,
.
...
Table 3.1 Model Variables
I'
Variable Description
I
I
Inputs Deposits Customer deposits II
Labour Number of employees III each bankir
institution
Capital Physical capital- equipment, property and oth fixed assets
Outputs Loans and advances Value of total aggregate loans and advances
Other investments III banking Government securities and deposits placed institutions other financial institutions
NPL Nonperforming Loans Gross nonperforming loans less interest suspense at a given time
LA Loan Advances Total loans and advances to customers
LLP Loan Loss Provision Specific provisions for bad debts
TA Total Assets All the assets held by a bank at a particular tim TD Total Deposits Customer deposits in terms of cash and fixe
deposits.
I
3.6. Data Analysis
CHAPTER FOUR: RESEARCH FINDINGS
4.1 Introduction
This chapter presents the study findings. Two approaches were used to determine the effect
of credit risk on performance of the banks and also the effect of efficiency on performance
of Kenyan banks. The chapter starts by presenting technical efficiency scores for the banks.
Credit risk effects as measured by non-performing loans, loans and advances and loan loss
provision are presented thereafter.
4.2 Data Envelopment Analysis Results
Results from the DEA model are presented in this section. Technical efficiency scores for
commercial banks in Kenya are calculated. The study settled on technical efficiency
because Kenyan banks are believed to be more allocativelly efficient than technically
efficient (Hassan et al, 1990). Outputs used included loans and advances and other
investments in banking institutions while inputs were customer deposits, labour (staff
costs) and physical capital.
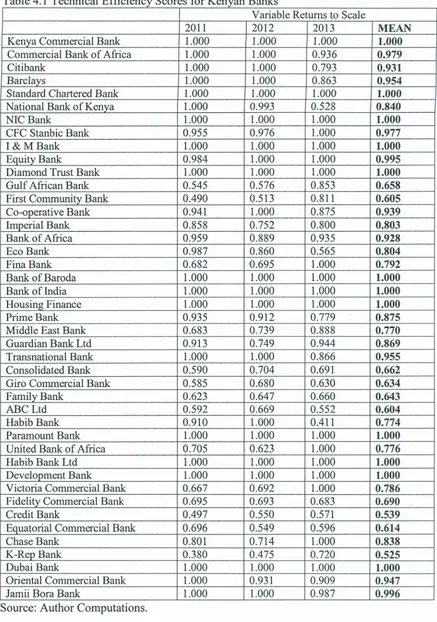
4.2.1 Technical Efficiency Scores for Kenyan Banks
Table 4.2 shows technical efficiency scores for the 43 Kenyan commercial banks. The
scores were calculated for three consecutive years using the output oriented model under
Table 4.1 Technical Efficiency Scores for Kenyan Banks
Variable Returns to Scale
2011 2012 2013 MEAN
Kenya Commercial Bank 1.000 1.000 1.000 1.000
Commercial Bank of Africa 1.000 1.000 0.936 0.979
Citibank 1.000 1.000 0.793 0.931
Barclays 1.000 1.000 0.863 0.954
Standard Chartered Bank 1.000 1.000 1.000 1.000
National Bank of Kenya 1.000 0.993 0.528 0.840
NIC Bank 1.000 1.000 1.000 1.000
CFC Stanbic Bank 0.955 0.976 1.000 0.977
1& MBank 1.000 1.000 1.000 1.000
Equity Bank 0.984 1.000 1.000 0.995
Diamond Trust Bank 1.000 1.000 1.000 1.000
Gulf African Bank 0.545 0.576 0.853 0.658
First Community Bank 0.490 0.513 0.811 0.605
Co-operative Bank 0.941 1.000 0.875 0.939
Imperial Bank 0.858 0.752 0.800 0.803
Bank of Africa 0.959 0.889 0.935 0.928
Eco Bank 0.987 0.860 0.565 0.804
Fina Bank 0.682 0.695 1.000 0.792
Bank of Baroda 1.000 1.000 1.000 1.000
Bank of India 1.000 1.000 1.000 1.000
Housing Finance 1.000 1.000 1.000 1.000
Prime Bank 0.935 0.912 0.779 0.875
Middle East Bank 0.683 0.739 0.888 0.770
Guardian Bank Ltd 0.913 0.749 0.944 0.869
Transnational Bank 1.000 1.000 0.866 0.955
Consolidated Bank 0.590 0.704 0.691 0.662
Giro Commercial Bank 0.585 0.680 0.630 0.634
Family Bank 0.623 0.647 0.660 0.643
ABC Ltd 0.592 0.669 0.552 0.604
Habib Bank 0.910 1.000 0.411 0.774
Paramount Bank 1.000 1.000 1.000 1.000
United Bank of Africa 0.705 0.623 1.000 0.776
Habib Bank Ltd 1.000 1.000 1.000 1.000
Development Bank 1.000 1.000 1.000 1.000
Victoria Commercial Bank 0.667 0.692 1.000 0.786
Fidelity Commercial Bank 0.695 0.693 0.683 0.690
Credit Bank 0.497 0.550 0.571 0.539
Equatorial Commercial Bank 0.696 0.549 0.596 0.614
Chase Bank 0.801 0.714 1.000 0.838
K-Rep Bank 0.380 0.475 0.720 0.525
Dubai Bank 1.000 1.000 1.000 1.000
Oriental Commercial Bank 1.000 0.931 0.909 0.947
Jamii Bora Bank 1.000 1.000 0.987 0.996
Table 4.1 shows that most of the Kenyan banks are fairly efficient. The mean efficiency scores for the banks are over 0.500 with Kenya Commercial Bank, Standard Chartered bank, NIC Bank, I & M Bank, Diamond Trust Bank, Bank of Baroda, Bank of India,
Housing Finance, Paramount Bank, Habib Bank Ltd, Development Bank and Dubai Bank having a mean efficiency score of 1.00. Most of them maintained a score of 1.00 for the three consecutive years. K-Rep Bank is the least efficient bank with a mean efficiency score of 0.525 followed by ABC Bank Ltd with a score of 0.604.
The results also showed that in the year 2013, most banks had output slacks in other investments (government securities) meaning they could increase their output using the same inputs. This showed that the inputs were underutilized (Appendix 1). These banks included but not limited to Barclays, Imperial, Eco bank, Middle East, Consolidated, Giro Commercial Bank, Family Bank, ABC, Fidelity Commercial Bank, Credit Bank and Chase Bank.
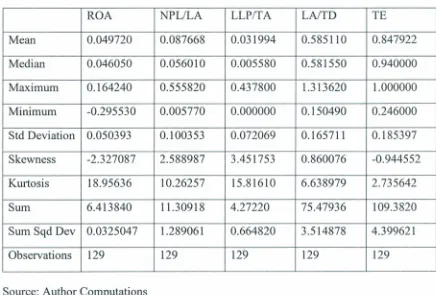
4.3 Regression Results
This section presents overall results obtained by running a regression on both dependent and independent variables. The efficiency scores from the DEA results are used as an independent variable in the regression model.
4.3.1 Descriptive statistics for dependent and independent variables