Scholarship@Western
Scholarship@Western
Electronic Thesis and Dissertation Repository
4-16-2012 12:00 AM
Changes in the hydrological regime in the Upper Bow and Upper
Changes in the hydrological regime in the Upper Bow and Upper
Athabasca Watersheds during the 20th century
Athabasca Watersheds during the 20th century
Heather A. Haines
The University of Western Ontario
Supervisor
Dr Brian Luckman
The University of Western Ontario Graduate Program in Geography
A thesis submitted in partial fulfillment of the requirements for the degree in Master of Science © Heather A. Haines 2012
Follow this and additional works at: https://ir.lib.uwo.ca/etd
Part of the Physical and Environmental Geography Commons
Recommended Citation Recommended Citation
Haines, Heather A., "Changes in the hydrological regime in the Upper Bow and Upper Athabasca Watersheds during the 20th century" (2012). Electronic Thesis and Dissertation Repository. 478.
https://ir.lib.uwo.ca/etd/478
This Dissertation/Thesis is brought to you for free and open access by Scholarship@Western. It has been accepted for inclusion in Electronic Thesis and Dissertation Repository by an authorized administrator of
(Spine Title: Hydrological change in the Bow & Athabasca Basins: 1911-2005)
(Thesis format: Monograph)
by
Heather Ann Haines
Graduate Program in Geography
A thesis submitted in partial fulfillment of the requirements for the degree of
Master of Science in Geography
The School of Graduate and Postdoctoral Studies The University of Western Ontario
London, Ontario, Canada
ii
THE UNIVERSITY OF WESTERN ONTARIO School of Graduate and Postdoctoral Studies
CERTIFICATE OF EXAMINATION
Supervisor
______________________________ Dr. Brian Luckman
Supervisory Committee
______________________________
______________________________
Examiners
______________________________ Dr. Peter Ashmore
______________________________ Dr. Stephen Hicock
______________________________ Dr. Katrina Moser
______________________________
The thesis by
Heather Ann Haines
entitled:
Changes in the hydrological regime in the Upper Bow and Upper Athabasca
Watersheds during the 20th century
is accepted in partial fulfillment of the requirements for the degree of Master of Science, Geography
______________________ _______________________________
iii
Abstract
This thesis examines 20th century regime changes for the headwaters of the Bow (1911-2005) and Athabasca (1971-2005) Rivers. Changes in precipitation and temperature associated with the Pacific Decadal Oscillation dominate the Bow streamflow record. Higher snowfall, lower mean temperatures, and greater annual discharges occur during the “cool” PDO phase (1947-1976) with lower snowfall, higher mean temperatures, and lower annual discharges during the “warm” (1925-1946, 1977-2005) phases. Any long-term linear trends in the Bow
record are masked by these multidecadal trends. The Athabasca record is too short to compare to the PDO but available data show patterns similar to the Bow. Differences in percentage glacier cover result in differences in median flow dates ranging from (June 29) on the Miette (0.2% glacier cover) to July 28 on the proglacial Sunwapta River (61% glacier cover). Additionally a visualization technique is developed which provides a complementary approach to evaluating low frequency regime changes.
Keywords
iv
Acknowledgments
Many people and organizations contributed to the production of this thesis. First and foremost deep thanks and gratitude are owed to my supervisor Dr Brian Luckman. This thesis would not have existed without your encouragement and understanding as I battled through these past few years. The never ending guidance and assistance you have provided has been exceptional. Thank you really does not express enough how important your
presence has been to my graduate school experience. Many thanks also go to Dr Chris Smart whose integral participation in this research pulled together so much of my work. The many hours of discussions on hydrology and statistics imparted much knowledge and the
contribution of your visualization technique used in this research allowed for analysis that could not have been undertaken otherwise and is greatly appreciated.
I would like to especially thank both the IAI and NSERC for providing the funding which allowed for this study to be undertaken.
Thanks also to all those who I spent time with in the field; Brian, Kate, Mike, Ben, Helen, and Emma, the experience of those research seasons will be with me forever. To my fellow dendro lab mates, my office buddies (especially Miss Beth), and my co-members of the speaker series and orientation committees thank you for all the memories, help and advice you provided. Many thanks also to Caroline, Lori, Erika, Joe, Karen, and Angelica for your assistance and expertise over the years.
v
Table of Contents
CERTIFICATE OF EXAMINATION ... ii
Abstract ... iii
Acknowledgments... iv
Table of Contents ... v
List of Tables (where applicable) ... viii
List of Figures (where applicable) ... ix
Chapter 1 ... 1
1 Introduction ... 1
1.1 Introduction ... 1
1.2 Scope of this Thesis ... 2
1.3 Structure of this Thesis ... 3
Chapter 2 ... 5
2 Studies of streamflow regime changes in the western North American Cordillera ... 5
2.1 Introduction ... 5
2.2 General Studies ... 5
2.3 Studies in the western Cordillera of North America ... 6
2.4 The relationship between the Pacific Decadal Oscillation and streamflow in western North America ... 11
2.5 Studies in the Canadian Rockies ... 14
2.6 Summary ... 18
Chapter 3 ... 20
3 Twentieth century changes in streamflow in the Bow and Athabasca headwaters... 20
3.1 Introduction ... 20
vi
3.2.1 Available gauge records ... 22
3.3 Comparison of the Bow and Athabasca Rivers ... 25
3.4 Comparison of the Athabasca and Miette Rivers ... 30
3.5 The Sunwapta River Record ... 37
3.6 The Effects of Differences in Glacier Cover ... 45
3.7 The Pacific Decadal Oscillation... 47
3.7.1 The Bow Record ... 47
3.7.2 The Sunwapta Record ... 51
3.7.3 Athabasca and Miette Records... 55
3.8 Conclusion ... 55
Chapter 4 ... 57
4 Comparison of the observed hydrological trends in the southern Canadian Cordillera to proximal climate records ... 57
4.1 Introduction ... 57
4.2 Data sources ... 57
4.3 Relationships between discharge of the Bow River at Banff and Banff climate record ... 59
4.3.1 Previous work ... 59
4.3.2 Relationships between discharge and climate variables ... 63
4.4 The Jasper climate record ... 68
4.4.1 Correlation between the Jasper and Banff climate records ... 68
4.4.2 The Jasper climate record and the Athabasca River hydrological record . 73 4.4.3 The Jasper climate record and the Sunwapta River hydrological record. . 77
4.5 Conclusions ... 80
Chapter 5 ... 82
vii
5.1 Introduction: Alternative strategies for detection and communication of stream
regime change ... 82
5.2 Methodology: Development of the visualization technique ... 83
5.2.1 Plotting the visual interpretations ... 89
5.3 Analysis of streamflow patterns in the surfer visualization plots ... 91
5.3.1 The Bow River at Banff ... 91
5.3.2 The Athabasca River near Jasper ... 95
5.3.3 Comparison of the Athabasca and Bow records ... 97
5.4 Visualization vs. statistical methods: Linking the techniques ... 103
5.5 Conclusions ... 107
Chapter 6 ... 109
6 Conclusions ... 109
6.1 Conclusions of this study ... 109
6.2 Future Work ... 112
References ... 115
viii
List of Tables
Table 3.1: Location, basin size, and length of hydrological records used in this study. ... 21
Table 3.2: Annual and Summer (JJA) Discharge values for the Bow and Athabasca Rivers for the entire period of record for each station. ... 25
Table 3.3: Annual and summer (JJA) discharge for the Athabasca and Miette Rivers for the 1976-2005 period of record. ... 32
Table 3.4: Miette River near Jasper and Athabasca River above Jasper mean values for the common periods, no trends in these series were found to be significant. ... 34
Table 3.5: Athabasca River near Jasper and Sunwapta River at Athabasca Glacier mean values for the seasonal June 1 – September 30 period for 1971-1996... 43
Table 3.6: Bow River at Banff mean values for the PDO phases through the 20th century. . 47
ix
List of Figures
Figure 3.1: Hydrometric gauging sites available in the Upper Athabasca Watershed. ... 21
Figure 3.2: Gauge records for the Bow River at Banff and gauges in the Upper Athabasca Watershed that contain >20 years of data. ... 22
Figure 3.3: Flow accumulation curve of the Athabasca River near Jasper and the Bow River at Banff for the common 1971-2005 period. ... 26
Figure 3.4: Mean Annual Hydrograph (1971-2005) for the Athabasca River near Jasper and the Bow River at Banff. ... 26
Figure 3.5: Comparison of mean annual discharges for the Athabasca and Bow rivers. ... 27
Figure 3.6: Peak daily discharge records for the Athabasca and Bow Rivers. ... 28
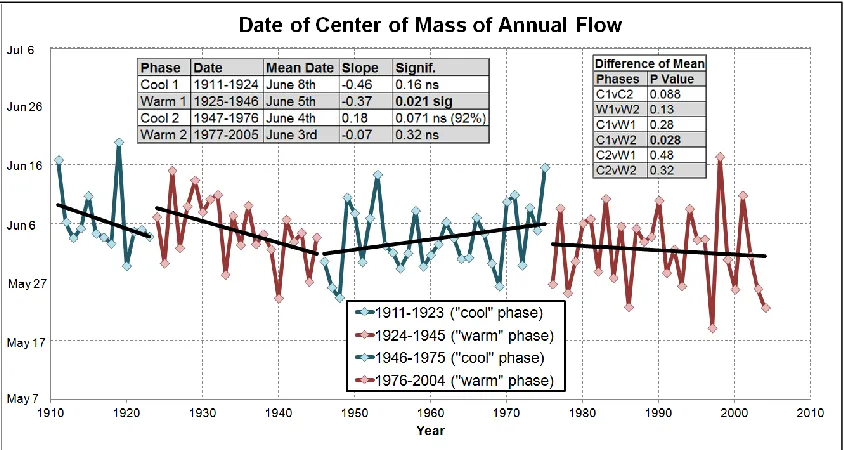
Figure 3.7: Date of centre of mass (CT) of annual flow of the Athabasca and Bow Rivers. . 29
Figure 3.8: The junction of the Athabasca and Miette Rivers. Photo courtesy of Dr Brian Luckman. ... 31
Figure 3.9: Flow accumulation curve of the Athabasca River above Jasper and the Miette River near Jasper for the common 1976-2005 period. ... 32
Figure 3.10: Monthly Fractional Flow of the Miette River near Jasper for 1976-2005. ... 33
Figure 3.11: Monthly Fractional Flow of the Athabasca River above Jasper for 1976-2005. 33
Figure 3.12: Mean annual flow of the Athabasca River above Jasper and the Miette River near Jasper 1976-2005. ... 35
Figure 3.13: Peak daily discharge of the Athabasca River above Jasper and the Miette River near Jasper for 1976-2005. ... 35
x
Figure 3.15: CT date of the Athabasca River above Jasper and the Miette River near Jasper for 1975-2004... 36
Figure 3.16: The Athabasca Glacier at the head of the Sunwapta River 2006. ... 38
Figure 3.17: The Sunwapta River at Athabasca Glacier gauging station August 1, 2008. ... 39
Figure 3.18: Mean June 1 – September 30 discharge of the Sunwapta River at Athabasca Glacier. ... 40
Figure 3.19: Peak daily discharge for the Sunwapta River 1951-1996. ... 41
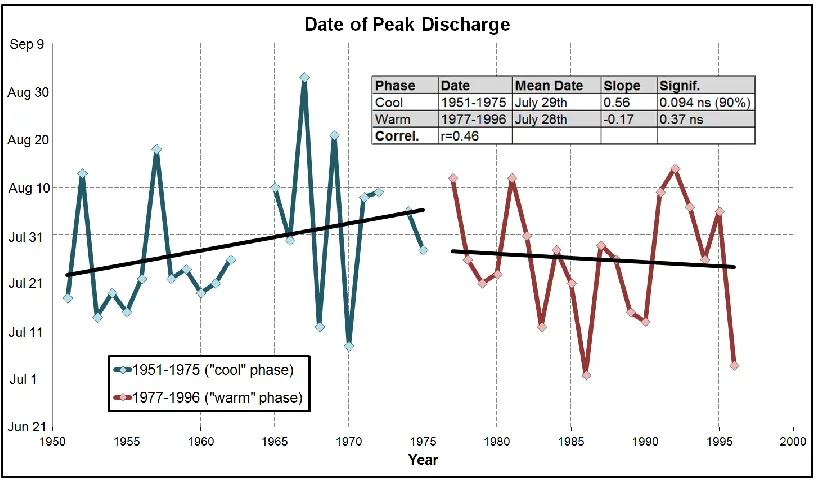
Figure 3.20: Date of peak spring-summer discharge (June 1 – September 30) of the Sunwapta River at Athabasca Glacier. ... 42
Figure 3.21: CT date in the June 1 – September 30 period for the Sunwapta River at
Athabasca Glacier. ... 42
Figure 3.22: Date of peak discharge of the Athabasca River near Jasper and the Sunwapta River at Athabasca Glacier for 1971-1996.. ... 44
Figure 3.23: CT date of the Athabasca River near Jasper and the Sunwapta River at
Athabasca Glacier for 1971-1996. ... 45
Figure 3.24: Seasonal (May through October) flow accumulation curves for the five
streamflow records analysed in this study for the 1976-1996 common period. ... 46
Figure 3.25: Daily percentage of seasonal (May through October) flow for the five
streamflow records analyzed in this study for the 1976-1996 common period. ... 46
Figure 3.26: Average daily discharge for the four PDO phases for the Bow River at Banff. 48
Figure 3.27: Mean annual flow of the Bow River at Banff categorized by PDO phase. ... 49
Figure 3.28: Peak daily discharge of the Bow River at Banff categorized by PDO phase. .... 49
xi
Figure 3.30: CT date of the Bow River at Banff categorized by PDO phase. ... 51
Figure 3.31: Mean June 1 – September 30 flow of the Sunwapta River at Athabasca Glacier categorized by PDO phase. ... 52
Figure 3.32: Peak daily discharge between June 1 – September 30 of the Sunwapta River at Athabasca Glacier categorized by PDO phase... 53
Figure 3.33: Date of peak discharge between June 1 and September 30 for Sunwapta River at Athabasca Glacier categorized by PDO phase... 53
Figure 3.34: CT date for the June 1 – September 30 period of the Sunwapta River at
Athabasca Glacier categorized by PDO phase... 54
Figure 4.1: Mean, maximum, and minimum temperature trends for Banff from 1911-2005. 61
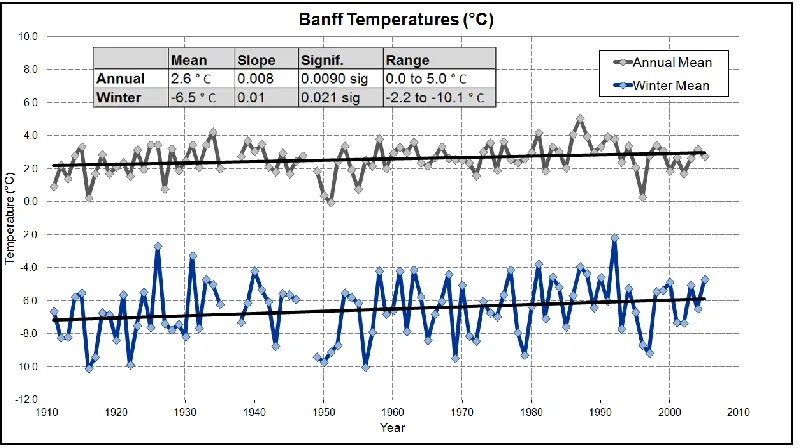
Figure 4.2: Mean annual and mean winter temperature trends for Banff from 1911-2005. ... 61
Figure 4.3: Minimum annual and minimum winter temperature trends for Banff from 1911-2005... 62
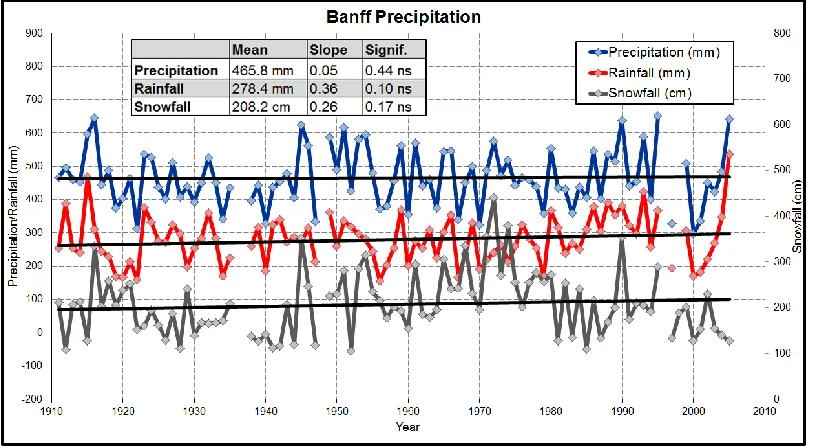
Figure 4.4: Rainfall, snowfall, and combined precipitation trends for Banff from 1911-2005. ... 62
Figure 4.5: Bow River at Banff mean annual flow and Banff mean temperature for the period of 1911-2005. ... 63
Figure 4.6: Bow River at Banff CT date and Banff mean temperature for the period of 1911-2005... 64
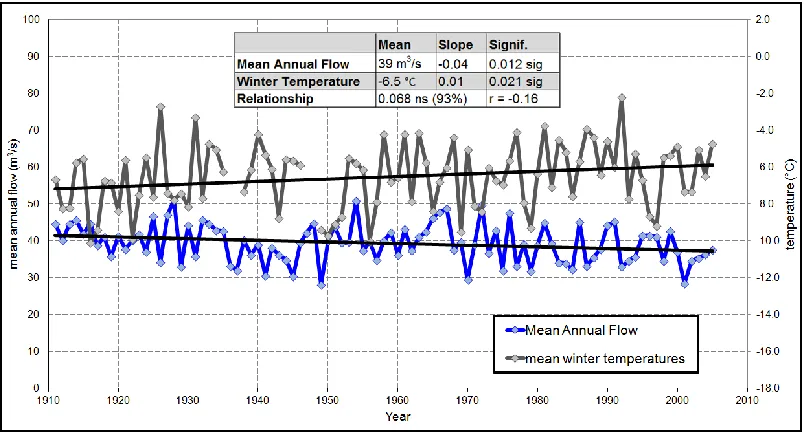
Figure 4.7: Bow River at Banff mean annual flow and Banff mean winter temperature for the period of 1911-2005. ... 64
xii
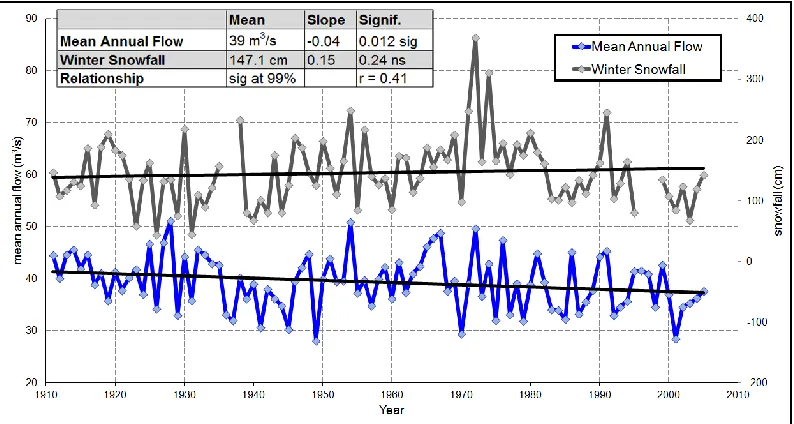
Figure 4.9: Bow River at Banff mean annual flow and Banff winter snowfall for the period of 1911-2005. ... 65
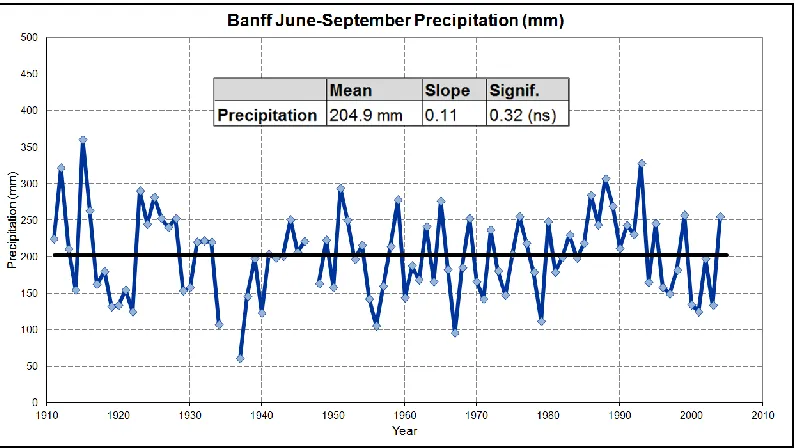
Figure 4.10: June through September precipitation trends for Banff from 1911-2005. ... 66
Figure 4.11: Mean annual flow for the Bow River and winter snowfall at Banff for 1911-2005 broken into the PDO phases. ... 67
Figure 4.12: CT dates for the Bow River and mean winter temperature at Banff for 1911-2005 broken into the PDO phases. ... 68
Figure 4.13: CT dates for the Bow River and winter snowfall at Banff for 1911-2005 broken into the PDO phases. ... 69
Figure 4.14: Banff and Jasper mean annual temperatures compared over the PDO phases. .. 70
Figure 4.15: Banff and Jasper mean winter temperatures compared over the PDO phases. .. 71
Figure 4.16: Banff and Jasper annual precipitation compared over the PDO phases. ... 71
Figure 4.17: Banff and Jasper winter snowfall compared over the PDO phases. ... 72
Figure 4.18: Mean, maximum, and minimum annual temperatures for Jasper 1971-2005. ... 73
Figure 4.19: Annual rainfall, snowfall, and combined precipitation levels for Jasper 1971-2005... 74
Figure 4.20: Winter (November – March) mean temperatures and winter (November –
March) snowfall accumulation for Jasper 1971-2005. ... 74
Figure 4.21: Athabasca River near Jasper mean annual flow and Jasper mean winter
temperature for the period of 1971-2005. ... 75
Figure 4.22: Athabasca River near Jasper mean annual flow and Jasper winter snowfall for the period of 1971-2005. ... 76
xiii
Figure 4.24: Athabasca River near Jasper CT date and Jasper winter snowfall for the period of 1970-2004. ... 77
Figure 4.25: Sunwapta River at Athabasca Glacier seasonal (June – September) mean annual flow and Jasper seasonal (June – September) mean temperatures for the period of 1951-1996. ... 78
Figure 4.26: Sunwapta River at Athabasca Glacier seasonal (June – September) CT date and Jasper winter mean temperature for the period of 1951-1996. ... 79
Figure 4.27: Sunwapta River at Athabasca Glacier seasonal (June – September) CT date and Jasper winter snowfall for the period of 1951-1996. ... 79
Figure 5.1: The daily discharge values (m3/s) for the Bow River at Banff plotted with no smoothing applied and a single scale. ... 84
Figure 5.2: The absolute runoff values for the Bow River at Banff for the 1st, 5th, and 10th percentiles displayed using a common scale.. ... 86
Figure 5.3: The absolute runoff values for the Bow River at Banff for the 90th, 95th, and 99th percentiles displayed using a common scale.. ... 87
Figure 5.4: The relative runoff values for the Bow River at Banff for the 10th, 50th, and 90th percentiles represented by one scale. ... 88
Figure 5.5: The absolute runoff values for the Bow River at Banff for the 10th, 50th, and 90th percentiles represented with separate scales. ... 90
Figure 5.6: The absolute runoff values for the Athabasca River near Jasper for the 10th, 50th, and 90th percentiles represented with separate scales. ... 95
Figure 5.7: The relative runoff values for the Athabasca River near Jasper for the 10th, 50th, and 90th percentiles represented by one scale. ... 96
xiv
Figure 5.9: The absolute runoff values at the 50th percentile for the Athabasca River near
Jasper and the Bow River at Banff represented using separate scales. ... 99
Figure 5.10: The absolute runoff values at the 90th percentile for the Athabasca River near Jasper and the Bow River at Banff represented using separate scales. ... 100
Figure 5.11: The relative runoff values at the 10th percentile for the Athabasca River near Jasper and the Bow River at Banff represented using a single scale. ... 101
Figure 5.12: The relative runoff values at the 50th percentile for the Athabasca River near Jasper and the Bow River at Banff represented using a single scale. ... 102
Figure 5.13: The relative runoff values at the 90th percentile for the Athabasca River near Jasper and the Bow River at Banff represented using a single scale. ... 103
Figure 5.14: Mean annual flow for the Bow River at Banff. ... 104
Figure 5.15: Peak daily discharge for the Bow River at Banff. ... 105
Figure 5.16: Date of peak discharge for the Bow River at Banff. ... 105
Figure 6.1: Visual surfer plot of the absolute values of Bow runoff at 50% of flow demonstrating the changes related to the PDO phase shifts. ... 112
Figure 6.2: Visual surfer plot of the relative values of Bow runoff at 50% of flow demonstrating the changes related to the PDO phase shifts. ... 113
Chapter 1
1
Introduction
1.1
Introduction
Alpine environments are highly sensitive to temperature changes and they respond to change more rapidly and earlier than lower altitude environments (Beniston, 2005, Rood
et al, 2005). Models indicate that temperature increases due to global warming will be greater at higher elevations because a large portion of the available water storage is temperature sensitive (Stewart et al, 2005). High alpine glaciers and snow covered catchments are particularly sensitive to climate warming that can lead to greater snow and ice melt and pronounced changes in streamflow patterns (Munro, 2000, Moore et al., 2009). As 50% of the world’s rivers have their sources located in mountain regions
(Viviroli et al, 2002, Beniston, 2003) these changes will also influence adjacent lowland areas. Furthermore, water from glacier and snow melt is directly consumed by over 15% of the world’s population as a freshwater source (Bales et al, 2006). The anticipated effects of temperature change are of particular importance in many alpine areas of western North America where streamflows are dominated by meltwater released during spring and summer (April – September; Watson & Luckman, 2006).
It is also known that the glacial melt and snowmelt components of the hydrological system react differently to annual climate trends (Knowles et al, 2006). Several studies (e.g. Fleming & Clark, 2005, Stewart et al, 2005) have shown that glacial melt
contribution to streamflow can cause unexpected modifications to discharge regimes and affect the timing and volumes of discharge. Thus it is important to attempt to understand these inputs and determine the difference between rivers with differing amounts of glacier and snow cover. This understanding could be undertaken by looking at records in the southern Canadian Cordillera where paired examples of adjacent rivers have varying amounts of glacier derived inputs. Analysis of proglacial records would also permit an understanding of how glaciers affect streamflow patterns and variability.
The natural variability of streamflow cannot be completely accounted for without analyzing the effects of atmospheric circulation patterns as they are known to provide regionally specific influences on both surface climate and streamflow trends (Moore & McKendry, 1996, Hamlet et al., 2005). The Pacific Decadal Oscillation (PDO) has been shown to influence streamflow trends in western North America. Positive and negative regime shifts have been noted in 1925, 1947, and 1976 (Mantua & Hare, 2002 Stewart et al., 2005). Hydrological records from the southern Canadian Cordillera frequently span the 1976 phase shift with some of the longer records recording the earlier two shifts so the effect of the PDO on streamflow in this region can be analyzed (St Jacques et al, 2010). Understanding the effect of these atmospheric oscillations is critical to evaluating patterns of variability and streamflow trends in this region (Watson & Luckman 2006, St. Jacques et al, 2010).
1.2
Scope of this Thesis
Bow record at Banff beginning in 1951. As the full record is the longest continuous record of natural streamflow in the Canadian Rockies (1911-present) analysis of the full record provides a reference series against which the Athabasca and other basin’s records may be assessed.
The upper Athabasca basin also has streamflow records for several tributaries that allow for the assessment of the control that differing amounts of glacial cover have on the hydrological regime of the system. The tributary Miette River near Jasper has minimal glacier cover whereas the gauge on the Sunwapta River at Athabasca Glacier has the longest (ca. 42 years) seasonal discharge record for a proglacial site in Canada. By analyzing these records evidence of trends related to glacial cover may be understood. Additionally, this investigation will examine the effects of the 1976 shift change of the PDO on the records from the Athabasca and Bow watersheds. The relationship between hydrological and precipitation changes will also be examined.
In addition to a more traditional statistical approach to hydrological analysis this study will also use an alternate technique of identifying trends in streamflow data using a novel visualization of streamflow data. Phal-Wostl (2007) suggests that as different audiences have different ways of absorbing scientific information, multiple (or different) ways of data presentation and analysis may be useful when data are needed for policy purposes (see e.g. Meko & Woodhouse, 2011). Sadie and Getz (2005) suggest that visually accessible information can make management and planning decisions easier. Therefore creating a visual interpretation technique to demonstrate trends in streamflow data may provide a useful tool for presenting data to policy makers. If successful, this technique could be applied to records from other areas of the southern Canadian Cordillera.
1.3
Structure of this Thesis
The body of this thesis will address these issues in four main chapters. Chapter 2 will provide a general review of previous work on hydrological studies in the western Americas and specific analysis of previous work in the Canadian Rockies will be highlighted. Chapter 3 will analyze selected records from the Athabasca and Bow
Miette, Sunwapta, and Bow Rivers and the relative importance of glacier contributions. It will also assess the potential hydrological influence of the Pacific Decadal Oscillation. The relationships between precipitation and temperature changes and these hydrological records will be examined in Chapter 4. Chapter 5 will develop and detail a new
Chapter 2
2
Studies of streamflow regime changes in the western
North American Cordillera
2.1
Introduction
There have been many studies examining the relationships between mountain hydrology, glaciers and recent climate changes. After a brief overview of general studies, this
chapter will examine previous major studies in western North America, concentrating on western Canada and specifically studies in the Canadian Rockies that address the natural variability of streamflow and its relationship to climate changes. It will also include a review of variation in streamflow trends due to different amounts of basin glacier cover and will discuss the influence of the Pacific Decadal Oscillation (PDO) on streamflow. Finally the results of more detailed research done in the southern Canadian Cordillera will be summarized.
2.2
General Studies
Marshall et al, 2011). Studies of the natural variability of streamflow in these basins are critical to understand these changes (Watson & Luckman, 2006). However, relatively little work has been carried out on natural flow controls in high elevation areas due to the difficulty in accessing these remote areas and a general lack of available streamflow records from high altitude sites (Viviroli et al, 2002, Bales et al, 2006). Nevertheless it is important to examine those instrumental records that do exist to determine whether these predicted changes can be detected. One area where such a study can feasibly be
undertaken is in the southern Canadian Cordillera as there are several watersheds that meet the criteria for such analyses.
Glaciers and alpine snowpacks provide a critical long-term hydrological control by storing water during cool and wet periods and releasing it during warm and dry periods (Rood et al, 2005, Masiokas et al, 2006, Demuth et al., 2008, Sauchyn et al, 2009). Warming climate can cause modification to this natural control on water storage that will change alpine streamflow regimes. Recent climate warming is resulting in rapid glacier loss (e.g. Bolch et al, 2010) potentially causing a shift from glacial melt-dominated to snowmelt -dominated regimes in many mountain environments (Huss et al, 2008) and also changes in snowmelt dominated regimes (Stewart et al, 2005) .This is critical as these two components of the hydrological system respond differently to annual climate trends (Knowles et al, 2006). A shift in the balance between rain and snowfall can cause changes in discharge timing that could be critical to downstream water needs (Knowles et al, 2006). It is therefore important to understand all components of this hydrological system so that the effects of these changes can be documented and understood.
2.3
Studies in the western Cordillera of North America
to climate variation related to historic greenhouse gas concentrations over the 20th
century and predicted concentrations for the 21st century. The PCM’s demonstrated that streamflow timing is highly influenced by cool season warming that changes the rain-to-snow mix in precipitation. Over the historic period of study rain-to-snowmelt was seen to be occurring earlier in the year, causing decreased discharge in late summer and autumn. Decreases in snowmelt amounts were prevalent in records from the second half of the 20th century.
In the first large scale study Stewart et al (2004) examined hydrological data throughout the cordillera from Alaska to Mexico based on 279 high quality, daily or monthly natural discharge records from 1948-2000. Although several Canadian rivers were included, with some from the Rockies, specific details of these gauge records are not given in the paper. Most runoff in these rivers (50-80%) was derived from spring and summer snowmelt. This study focused on changes in the timing of runoff based on the initial melt pulse, changes in monthly discharge distribution and the date of the centre of
mass of annual flow (CT)1. CT date was calculated using average monthly data in this paper but the authors noted this calculation could also be applied to daily flow data. CT data were used as they were easily calculated, insensitive to interannual variation (in relation to other measures) and comparable across basins. This measure has been used by these authors in subsequent studies of streamflow since this paper’s publication (e.g. Stewart et al, 2005). Their analysis showed that in general the CT date was trending to occur earlier in the year at most stations including all of those within the southern Canadian Cordillera. The earlier CT trends were also found to correlate well with regions experiencing temperature warming. The areas demonstrating the widest ranging changes in CT date were found to be in rivers of the continental United States and southern Canada that had strong snowmelt dominated regimes and showed CT trends occurring between 5 to 15 days earlier. The northernmost rivers in the Cordillera and those at high elevation showed lower sensitivity to change and many had CT changes of < 5 days. This was attributed to colder temperatures in these areas reducing the impact of
1
small temperature increases that would have little effect on the duration of the snowmelt period since the average values would continue to remain below freezing. It was also noted that the timing trends observed in this study showed consistent changes in the rate and amount of change across western North America.
In their subsequent paper Stewart et al utilized daily data from the US stations (monthly data from the Canadian rivers) from the same network plus some additional stations for a
more refined analysis2. In total 294 snowmelt dominated and 91 non-snowmelt dominated records from the 1948-2000 period were used including 53 snowmelt
dominated Canada stations. Linear trend analysis was performed on April through July (AMJJ) fractional flow, spring pulse onset date, and CT date. It was in this work that the CT calculation for daily data was described in detail. Both spring pulse onset and CT date showed trends towards earlier dates for the snowmelt dominated basins. The CT timing was 10-30 days earlier over the 50 year study period for the snowmelt dominated basins and 5-25 later for the non-snowmelt dominated basins. The fraction of AMJJ streamflow was 50-80% for snowmelt and 30% for non-snowmelt dominated basins.
Recent patterns of snowmelt for basins in the western Cordillera were examined in a series of papers by Mote et al, 2005 and Hamlet et al 2005, 2007. These studies used April 1st Snow Water Equivalent (SWE) data from the western United States and
southern British Columbia using SNOTEL snowcourse measurements. The April 1st date is the most common observation date for both monthly and daily records and is
commonly used for hydrological forecasts. Most study sites in the Mote et al (2005) analysis reached peak SWE around this date. Mote et al (2005) developed a physically-based variable infiltration capacity (VIC) model using minimum and maximum
temperatures and precipitation data to create snowpack time series. This model is well validated in hydrological studies to capture climate sensitivities (Hamlet & Lettenmaier, 1999, Hamlet et al, 2005). Mote et al (2005) used SNOTEL snowpack data from 1144 stations from the 1950-1997 period (824 with complete records) to model snowpack over
2
several time periods between 1915 and 2002. These simulations showed that the largest decrease in April 1st SWE values occurs at lower elevations due to warmer midwinter temperatures that are more susceptible to climate warming. They also noted a
widespread decrease in SWE in the second half of the 20th century due to climate warming, corresponding to snowmelt observations by Dettinger et al (2004).
Hamlet et al (2005) used the same SWE sites and 1950-1997 data to create a VIC model from 1915-2003. Their model was run on three different scenarios using; (1) a base run with daily temperature and precipitation values: (2) a fixed precipitation levels and variable temperatures, and (3) fixed temperatures with variable precipitation. Based on these model results Hamlet et al (2005) concluded that increased winter runoff, earlier peak streamflow, and decreased summer streamflow volume were related to increased winter and spring temperatures, accompanied by a widespread decrease in SWE across the western US states and south-western Canada. Shorter term decadal scale variations in SWE were related to precipitation variability (see discussion of PDO below).
In a more comprehensive analysis Hamlet et al (2007) developed a VIC model to analyze runoff, evapotranspiration (ET) and soil moisture. They found all three variables showed earlier mean event dates over the 1916-2003 period. The earlier mean runoff timing was related to temperature trends and matched the changes in snowmelt timing discussed in Hamlet et al (2005). The region studied by Hamlet et al (2007) has a large snow accumulation season and changes in spring melt regime led to changes in discharge during the entire record including decreased mid-late summer streamflows. Hamlet et al
(2007) noted that colder areas (e.g. the Canadian sites) had runoff peaks in May and June whereas discharge in the coastal regions of the PNW peaked in March and April.
Nevertheless all regions demonstrated an earlier trend in runoff timing with the greatest change in areas where mid-winter temperatures were in the -10 to -5°C range. Hamlet et al (2007) also found that changes in autumn and winter streamflows were more
influenced by changes in precipitation patterns.
American cordillera. Thirty-one high upstream gauges were studied plus four
downstream reaches with long records and some flow control. Most records began in the early 1900’s but when data was missing, data from proximal active and discontinued
gauges were spliced together when there was a period of overlap or the gauge had been moved. However there were only eight long, fully continuous records namely: North Saskatchewan River at Edmonton, Bow River at Banff , Belly River near Mountain View, Fraser River at Hope in Canada and the St. Mary River near Babb, Snake River near Moran, Columbia River at the Dalles and Missouri River at Fort Benton in the USA. Many others lacked data during the 1930’s and 40’s. Many sites also lacked
winter data and small sections of missing data were interpolated based on the values from previous years or adjacent stations to the missing entry. The majority of records (21 of 31) showed a decreasing trend and half (15) were significant at the 0.1 probability level. No rivers showed significant increases in discharge. Most of the Canadian records showed significant decreases (16 of 21, 14 at the 1% level). The six records of rivers flowing east from the Rockies all showed strongly significant decreasing trends though the 20th century (Smoky River at Watino, Athabasca River near Jasper, North
Saskatchewan River at Edmonton, Red Deer River at Red Deer, Bow River at Banff and Calgary). Most early records show low streamflows in the 1920’s and 30’s with an increased discharge thereafter. However these changes are less well marked in the Bow record from Banff and Rood et al (2005) suggest this reflects increased glacier melt offsetting the decreases in precipitation.
Stahl and Moore (2006) examined the contribution of glaciers to late summer
“‘patchy’ sampling in both space and time” (some of these records are only 10 years
long). The authors conclude their work by encouraging more site-specific studies.
Moore et al (2009) examined the influence of glacier changes on streamflow variation with examples from the continental United States, western Canada, and Alaska. They note that although glaciers affect streamflow at various timescales, the strongest effects are the augmentation of summer and autumn streamflows. This is seen most clearly in August during hot and dry years with little snow accumulation. They found that the streamflows are sensitive to melt inputs in catchments with as little as 2-3% of glacial cover. Fleming and Clarke (2005) examined rivers in the southwest Yukon and northwest BC and show that during a recent warm period annual discharge volumes decreased in the non-glacierized catchments and increased in the glacierized areas due to the effect of glacial meltwater. However, Moore et al (2009) also note that while initial temperature increases can result in higher streamflow, if temperatures continue to
increase the continued loss of ice will result in decreasing discharge over time. Moore et al (2009) also suggest that, based on Fleming and Clarkes results, the glaciered
catchments in SW Yukon and NW BC are in the first stage of increased annual discharge. Moore et al (2009) stress that streamflow predictions in such catchments must account for these glacier related-effects unlike the earlier predictions for the Lillooet River by Moore (1992) and Loukas et al, (2002).
2.4
The relationship between the Pacific Decadal
Oscillation and streamflow in western North America
The PDO is the leading principal component of North Pacific monthly sea surface temperature (SST) variability (Mantua et al., 1997, Rodinov & Assel, 2001, Hidalgo & Dracup, 2003, MacDonald & Case, 2005) with an event persistence of 20-30 years (Mantua & Hare, 2002). The PDO has been recognized as a major influence on climate the Pacific Northwest, and particularly on precipitation. This atmospheric oscillation is known to shift between positive and negative phases and regime shifts have been
(2005) and Gobena and Gan (2006). These effects are most prominent in winter months (Moore et al, 2009) and in western North America have been linked to variations in winter precipitation, wintertime air temperature, snowpack, and glacial mass balance records (Mantua et al, 1997, Selkowitz et al, 2002, Munro, 2005, Watson & Luckman, 2005a, Mote, 2006, Watson & Luckman, 2006, Demuth et al, 2008, Moore et al, 2009). However, while winter may be the most impacted season, the PDO’s effect on
streamflow is seen most strongly in annual discharge values; positive phase PDO years show lower annual discharge with higher annual discharge occurring in negative phase years (Mantua et al, 1997). The mechanisms controlling the PDO remain unknown and have been difficult to model. However, the phenomenon appears to have intensified during the 20th century and become more important in driving hydroclimate trends (Gedalof et al, 2002, Mantua & Hare, 2002, Moore et al, 2002, MacDonald & Case, 2005). Therefore locating the influence of the PDO in streamflow records has become more widespread as it is important to determine or isolate the influence of the PDO before extrapolating trends from hydroclimate records (St Jacques et al, 2010).
Stewart et al (2005) recognized the potential influence of the PDO as the 1976 “shift” occurs in the middle of their 1948-2000 data set, the first half being in the 1947-1976 “cool phase” and the latter half in the “warm phase” from 1977-2000. They concluded
to the PDO changes. Hamlet et al (2007) matched the 1947-2003 PDO cycle VIC
streamflow models to the streamflow trends observed in the work by Stewart et al (2005).
Rood et al (2005) examined the relationship between five-year means of their
hydrological data and the PDO over the 20th century and found a significant correlation. They note a stronger correlation for the latter half of the 20th century but caution that longer records would be needed to make a definitive statement. They also note that this change in phase and accumulation is based on the glacier cover in the catchment. The glacierized Mendenhall River catchment showed an increase in streamflow over all seasons during the “warm” phase with increased rain flowing off the glacier in winter and increased melt-based streamflow occurring in the summer months. Similar observations of glacial melt influencing streamflow have been reported by several other studies, e.g. at Place and Peyto Glaciers, in Canada (Munro, 2005, Watson et al, 2006, Demuth et al, 2008).
Another work that touches briefly on the effect of the PDO is that by Stahl and Moore (2006). Along with analyzing all the records from the 20th century in BC the researchers also looked at only those records that existed since the 1976 phase shift and contained data for all years from 1976-1996 which gave them a sample size of 143 hydrometric stations. The purpose of this analysis was to see if there was a consistent regional pattern observable within the PDO phase across BC. These stations generally show negative streamflow trends over this 20 year period. These trends along with the spatial difference seen between northern and southern BC are consistent with linkages that have been made to the PDO by Moore and McKendry (1996) and Moore et al (2009).
Although the distinct 1976 regime shift from “cool” to “warm” PDO phases can create problems in the linear analysis trends in hydrological data in the late 20th century there have been few attempts to isolate its effects on these trends. Recently St. Jacques et al
(8) of these rivers were described as having naturalized flow records and half had records with data that had been estimated and/or compensated for human impacts. Surprisingly the Bow River at Banff was not included in this analysis but the modified record for the Bow at Calgary was used. The eight records that required “naturalization” were located outside the mountainous areas. St. Jacques et al (2010) concluded that water supply was decreasing even when the PDO and other sources of natural variability were factored out: 10 of 16 stations showed significant decreases with only one indicating a significant increase in discharge between 1903 and 2007. They also note that rivers within the Bow watershed and the North Saskatchewan basin were more likely to show decreasing streamflows than surrounding watersheds. The overall decreasing trend (after removal of PDO influence) was attributed to increasing temperatures and/or human impact. They confirm the PDO’s strong influence on Alberta streamflows with higher discharges
during the cold phases and lower discharges during the “warm” phases. St. Jacques et al
(2010) also note that the discharge records for southern Alberta are already indicating that future water availability is decreasing and that greater water supply is needed to meet future demands.
The above overview covers more general papers that examine recent hydrological change in western Canada and their relation to the PDO. The next section will include a more detailed examination of studies that have focused on hydrological conditions in the southern Canadian Cordillera.
2.5
Studies in the Canadian Rockies
Few studies have examined changes in the hydrological regimes of the southern Canadian Cordillera and most of those discussions only include a few Canadian stations within broader regional studies (e.g. Mote et al, 2005, Rood et al, 2005). Only two studies focus on specific headwater basins in the Rockies that are discussed in detail below.
from Peyto Glacier that is immediately north of the basin and shares the hydrological divide with Bow Glacier which is the source of the Bow River. Young had previously worked on the partitioning of discharge from Peyto Glacier between glacier melt and other sources using the record obtained during the International Hydrological Decade (1965-78, Young, 1981). In his 1977 paper Young had determined that the Peyto mass balance record was representative of glacial conditions in the adjacent Upper Bow watershed with similar climate and topographic conditions. Hopkinson and Young determined changes in ice cover for the Waputik Icefield (source of both Bow and Peyto Glaciers) based on aerial photography taken in 1951 and 1993. Mean daily discharge for the Bow was aggregated into annual volumetric totals and compared with glacial wastage determined from several upstream glacial sites. They observed that the years 1970, 79, 83, 85, 87, 88, and 93 with below average river basin yields coincided with years of high glacial wastage whereas above average river basin yields occurred in periods with no glacier wastage and, in some cases small net glacial storage, such as in 1954, 59, 66, and 76. The lowest and highest yield years of 1970 and 1954 corresponded to the highest wastage (loss of 122.9*106 m3) and storage years (gain of 61.4*106 m3) respectively. Hopkinson and Young (1998) considered these extremes reflected increased winter precipitation and reduced summer temperatures during 1954 and lower winter precipitation levels during 1970. They suggested that small glaciers can generally regulate streamflow , as in 1970, but not all low yield years are augmented by glacial melt as seen in 1957 (See Figures 6 and 8 in Hopkinson & Young, 1998). High
The Peyto mass balance record was also the focus of the other major Canadian study of the upper North Saskatchewan basin (Demuth & Pietroniro, 2003). The North
Saskatchewan headwaters lie between the Upper Bow Watershed and Upper Athabasca Watershed, including some drainage from the Columbia Icefield. Peyto Glacier has the longest glacier mass balance record in Canada (1966-present, Demuth & Keller, 2006) and the glacier stream was gauged from 1966-76. Five headwater streamflow gauge records from the upper North Saskatchewan basin have mean, minimum and maximum daily discharge data available within the 1950 to 1998 period however, none of these station’s records are continuous and complete. These five records are North
Saskatchewan River at Saskatchewan Crossing, Siffleur River near the Mouth, North Ram River at Forestry Road, North Saskatchewan River at Whirlpool Point, and Mistaya River near Saskatchewan Crossing that have continuous records for 20, 22, 24, 29, and 49 years respectively. Peyto Creek from the glacier drains into the Mistaya River which is a major tributary joining the North Saskatchewan at Saskatchewan Crossing. Although the streamflow records for the basin are fragmentary Demuth and Pietroniro (2003) felt they provided the best opportunity to determine the effect of climate change on glaciers and their contributions to water supply.
There are no high elevation climate stations within the North Saskatchewan basin. Demuth and Pietroniro (2003) found the strongest correlations with the Banff climate record. However, they found no correlation between minimum and maximum
streamflows and Banff climate data. Nevertheless, the mean TBF flow had a 0.37 correlation value with autumn temperature but no relationship to precipitation values. Winter mass balance (WMB) records for Peyto were more strongly correlated to the mean TBF flows – r= 0.53 (significant at the 95% confidence level) between TBF and WMB and r= 0.34 (significant at the 90% confidence level) for annual GMB. Demuth and Pietroniro (2003) indicate the need to examine these glacier-hydro-meteorological relationships further. They also noted the strong influence of the PDO on inter-decadal changes in winter precipitation, winter glacier balance and streamflow, based largely on the Peyto GMB record. However, no statistical analyses were undertaken to compare the PDO to these data.
More recently Comeau et al (2009) modeled the contribution of glaciers to streamflow in the headwaters of the North and South Saskatchewan Rivers using WATFLOOD/SPL9 (Kouwen, 1988). They utilized hydrological data for annual and July-September periods from 11 headwater basins in combination with Landsat-derived glacierized area maps from 1975 and 1998. Modeled runs of WATFLOOD were carried out for the 1970-1980 and 1993-2003 periods and verified in part by hydrological analysis from HYDAT data for nine glacierized and non-glacierized basins in this study area. The glacier
contribution to flow was modeled as ‘melt’- equivalent to the SWE volume accumulated on the glacier in a given hydrological year - and ‘wastage’- the flow volume that exceeds that SWE volume and represents the annual net loss of volume on the glacier. The only other Canadian study that attempts to estimate the volume loss from glacial ice is Young’s (1981) melt and wastage estimates derived from the 1967-1977 glacial mass
Comeau et al (2009) report that in sub-basins with greater than 10% glacier cover, ice and snow contributed 73-84% of July – September streamflow with more than 60% of the ice and snow contribution coming from ‘melt’. The ice and snow contributions from
basins with 1-10% glacier cover were 26-75% and basins <1% glacier cover had a maximum of 10% melt derived July-September flow. The model estimates for the Bow River at Banff were 3.4% glacier cover and 58% contribution to the July-September 1975 flow which decreased to 2.2% glacier cover and 41% July-September streamflow in 1998. Comeau et al (2009) conclude that the relative percentage contribution made from glacier loss increases with glacierized area in the basin and that the melt of snowpack from the basin is a far larger contribution to streamflow than glacier melt. The authors note this was a first attempt to model the ‘melt’ and ‘wastage’ components to streamflow but that ‘wastage’ from specific glaciers would vary based on regional topographic and
climatic attributes that were not accounted for in this model. Their research into the effects of glacier melt demonstrated that the major impact of glacier loss on streamflow will be changes in the timing of streamflow events with an earlier hydrological peak and reduced late season glacier contributions. In the long term annual discharge volumes will decrease as glacier wastage contributions decrease due to loss of glacier cover.
2.6
Summary
Several studies in North America show changes in the hydrological regime of high alpine catchments and indicate the potential effects of both recent warming and changes in circulation on streamflow regimes. The largest observed change is earlier timing of discharge (both seen in peak discharges and CT dates) which is especially prominent in areas experiencing temperature warming. There is also an overall decrease being
to be highly interrelated. However, the literature on hydrological variability in the southern Canadian Cordillera is sparse and, in view of the importance of this water resource more research is needed. Therefore the primary aim of the following research is to examine streamflow variability in the headwaters of the Athabasca and Bow
Chapter 3
3
Twentieth century changes in streamflow in the Bow
and Athabasca headwaters
3.1
Introduction
The previous chapter has summarized the published literature on recent changes in
streamflow in the western Cordillera of North America noting that the Canadian coverage is sparse, particularly in Alberta. The Athabasca, North Saskatchewan and Bow Rivers are major headwater sources for drainage from the central Canadian Rockies but have received little detailed study. The North Saskatchewan has been studied in some detail by Demuth and Pietroniro (2003) whilst less than half the length of the Bow record has been examined (Hopkinson & Young, 1998) and no studies have been carried out in the
Athabasca watershed. This chapter will review the streamflow records for the Bow River at Banff, the Athabasca River near Jasper and two Athabasca tributaries. The specific objectives are (1) to compare and document hydrologic variability in these two basins and evaluate changes during the 20th century, (2) to examine possible differences in the response of high elevation basins with variable amounts of glacier cover, and (3) to determine, where possible, the relationship of changes in streamflow to variations in the Pacific Decadal Oscillation (PDO).
3.2
Study Area and Methods
Figure 3.1: Hydrometric gauging sites available in the Upper Athabasca Watershed.
The gauges of interest in this study have been labeled.
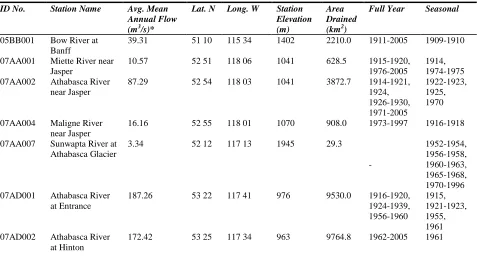
Table 3.1: Location, basin size, and length of hydrological records used in this study.
ID No. Station Name Avg. Mean Annual Flow (m3/s)*
Lat. N Long. W Station Elevation (m)
Area Drained (km2)
Full Year Seasonal
05BB001 Bow River at
Banff
39.31 51 10 115 34 1402 2210.0 1911-2005 1909-1910
07AA001 Miette River near
Jasper
10.57 52 51 118 06 1041 628.5 1915-1920,
1976-2005
1914, 1974-1975
07AA002 Athabasca River
near Jasper
87.29 52 54 118 03 1041 3872.7 1914-1921,
1924, 1926-1930, 1971-2005 1922-1923, 1925, 1970
07AA004 Maligne River
near Jasper
16.16 52 55 118 01 1070 908.0 1973-1997 1916-1918
07AA007 Sunwapta River at
Athabasca Glacier
3.34 52 12 117 13 1945 29.3
- 1952-1954, 1956-1958, 1960-1963, 1965-1968, 1970-1996
07AD001 Athabasca River
at Entrance
187.26 53 22 117 41 976 9530.0 1916-1920,
1924-1939, 1956-1960 1915, 1921-1923, 1955, 1961
07AD002 Athabasca River
at Hinton
172.42 53 25 117 34 963 9764.8 1962-2005 1961
* Mean Daily Discharge values are based on full year data only except for Sunwapta where only June 1- September 30 data
3.2.1 Available gauge records
The daily hydrological records used for this study are from the Water Survey of Canada’s (WSC) 2007 archived hydrometric database (HYDAT 2007). The stream gauge on the Bow River at Banff (Table 3.1, Figure 3.1) has the longest, continuous, high elevation unregulated streamflow record in the Canadian Cordillera (Hopkinson & Young, 1998), extending from 1909 to the present. It monitors an area of 2210 km2 and, although there are shorter records available for an upstream station at Lake Louise, the length and continuity of the Banff record make it the primary target for analysis. Hopkinson and Young (1998) carried out a limited assessment of annual streamflow volumes for the 1951-1993 period. The hydrological records for the Athabasca headwaters are shorter and more fragmentary and have not been analyzed previously. The Bow River at Banff as well as the available gauge records for the Athabasca with a minimum of 25
consecutive years are shown in Table 3.1 and Figure 3.2. Following early recording periods in the 1910s and 1920s, many gauges were discontinued and monitoring was not resumed until the 1970s. In addition several rivers are only gauged seasonally (usually
Figure 3.2: Gauge records for the Bow River at Banff and gauges in the Upper
April – October). The Athabasca near Jasper was selected as the primary station of interest as it contains sporadic records from the 1914-1930 period and a continuous record from 1971-2005. Although the record from Hinton is longer, especially if it could be combined with the Entrance record upstream, the drainage area to these gauges is much larger and includes considerable discharge from tributaries in the Front Ranges and Foothills downstream of Jasper, areas with relatively little glacier cover and of lower elevation. Therefore the Jasper record is more comparable with the Bow record. Moreover, the Jasper gauge is only a short distance downstream of the confluence with the Miette River near Jasper. These two basins have relatively similar physiography but marked differences in glacier cover, ca. 7% (Athabasca) and 0.2% (Miette, Dr Roger Wheate, pers. comm.) As no tributaries enter the Athabasca in the short distance between the Miette Junction and the Athabasca gauge, the contribution of the two basins can be separated by simple subtraction.
The Sunwapta River is one of the main headwater tributaries of the Athabasca River and has been gauged seasonally for almost 50 years at the outlet of the small proglacial lake
in front of the Athabasca Glacier. The lake basin presently has ca. 61%3 glacier cover and the gauge was only ca. 0.2 (1950s) to 1km (presently) from the glacier toe. Although the record is only seasonal (May – October) and at times incomplete, it is the longest discharge record for a pro-glacial river in Canada. The records from the Athabasca, Miette and Sunwapta rivers in the Athabasca headwaters are of comparable or greater length than those records used by Demuth and Pietroniro in their 2003 study of the North Saskatchewan River. In addition, the complete Bow record provides a regional reference record that covers most of the last century.
The HYDAT gauge records are classified in this study as having ‘full year data’ where streamflow values listed in the WSC record are available for all 365 days of the Julian year. WSC streamflow estimates included in the HYDAT records are not counted as missing data in this study. Full year data for the CT analyses utilize those years with 365
3
days of data between October 1st and September 30th (the hydrological year). Records classified as ‘seasonal data’ have daily data from June 1st
to September 30th. WSC estimates short periods of missing data in these records using their own procedures and calculations (Water Survey of Canada, 2001) and also adjusts records to compensate for relocation of gauges or changes in recording method (e.g. manual to instrumental). Although it would be possible to improve the completeness of some records by replacing short periods of missing data remaining in these archived records, this would necessitate using different interpolation techniques and, as these data gaps did not meet the WSC criteria for replacement, further changes were considered unwarranted. Using the interpolation techniques outlined in Rood et al (2005) could only add a maximum of six years to the Athabasca River record and two years to the Bow record. Based on the requirements that data need be present in the years prior and subsequent to the missing data an attempt to extend the record or the ‘seasonal’ period for the Sunwapta River is not
possible. All analyses were performed using daily instrumental streamflow data in order to determine changes at the highest resolution possible.
Microsoft EXCEL software was used to derive mean annual flow, date and volume of peak daily discharge, mean monthly and total discharge, seasonality of discharge, and date of centre timing of mass of annual flow (CT) from the daily HYDAT data. The technique used to determine CT is that developed in Stewart et al, 2005. It is calculated using their formula
Equation 3-1: Center of mass of annual flow (CT) date
CT = ∑(tίqί)/∑qί
where tί is the number of days since the beginning of the water year (day 1= October 1)
and qί represents the discharge value of the water year at day ί. These analyses were
carried out for ‘full water year’ (October 1st
3.3
Comparison of the Bow and Athabasca Rivers
The Bow River at Banff gauge record begins in 1909 although ‘full year data’ are not
available until 1911and are continuous until 2005. It provides a comprehensive record of hydrologic change during the 20th century and provides a benchmark against which other records can be compared. The record from the Upper Athabasca watershed is shorter and more fragmented; the gauge at Jasper is at the Maligne Bridge and operated from 1913-1931 and 1970-2005. It has full Julian year data for 1914-1921, 1924, 1926-1930, and 1971-2005. Comparison of this discontinuous record with that at Banff may provide context for the analysis of changes in the Athabasca record as both rivers drain similar high alpine environments. The Athabasca basin is larger, has a greater glacier cover and greater water yield per unit area (Table 3.2). Approximately 80% of discharge in both rivers occurs between May and October with the largest amount (ca. 65%) in June, July, and August although the Bow has a greater percentage of discharge in June, whereas the Athabasca has relatively greater discharge in July and August. Over the 1971-2005 interval the date of the 50th percentile of flow for Jasper (July 18th) is 11 days later than Banff (July 7th, Figure 3.3) but the annual hydrographs and flow accumulation curves are similar (Figure 3.4).
Table 3.2: Annual and Summer (JJA) Discharge values for the Bow and Athabasca
Rivers for the entire period of record for each station.
Station Name Drainage Area (km2)
Glacier Cover %**
Annual Yield (Q per km2)
Avg. Mean Annual Flow (m3/s)
Avg. Mean June Flow (m3/s)* / % of Annual Q
Avg. Mean July Flow (m3/s)* / % of Annual Q
Avg. Mean August Flow (m3/s)* / % of Annual Q Bow River at
Banff
2210.0 3.3 6.50 39.3 124.7 / 26% 106.1 / 23% 66.2 / 14%
Athabasca River near Jasper
3872.7 7 8.23 87.3 236.3 / 22% 263.3 / 26% 204.3 / 20%
* Mean monthly values are based on years where ‘full Julian year data’ is available
Figure 3.3: Flow accumulation curve of the Athabasca River near Jasper and the
Bow River at Banff for the common 1971-2005 period.
Figure 3.4: Mean Annual Hydrograph (1971-2005) for the Athabasca River near
Individual analyses and comparative studies of the Bow and Athabasca records were carried out using four measures; mean annual flow, date of peak discharge, peak daily discharge, and CT date (Figures 3.5-3.7) over three time periods; the entire record (1910 or 1914-2005, the common period 1971-2005 and the period 1977-2005. Measures of the “spring pulse” are commonly used to indicate changes in streamflow timing trends
(Stewart et al, 2005, Knowles et al, 2006). In this study the date of peak discharge was chosen to represent the peak of the spring melt event in both basins. However, the peak discharge of the Athabasca in 1978 is on September 5th, rather than within the normal range between mid-May and mid-July. Approximately 66 mm of precipitation fell in Jasper between Sept 2nd-6th, 1978 (mean September precipitation is only 35 mm)
indicating that this discharge peak is probably related to a major fall rainstorm, the effects of which are also recorded in the Miette and Sunwapta records (see below). Therefore the
Figure 3.5: Comparison of mean annual discharges for the Athabasca and Bow
rivers. Correlation is between annual discharge values, * denotes a significant
discharge data for June 6th (413 m3/s) were substituted for September 5th (439 m3/s) in the peak discharge analysis for the Jasper record.
Figure 3.5 shows the annual discharge records for the Athabasca and Bow and
correlations between these streamflows over different time periods. The long Bow record has a significant decreasing trend through the 20th century. This confirms the general picture of 20th century decreases in discharge in the Cordillera reported in previous regional studies, some of which have used these data. Although there are no data for the Athabasca between 1930 and 1970, the entire record shows a similar negative trend which falls marginally below the 0.95 significance level. Both records are highly variable but strongly correlated (r2=0.51). Trends over the shorter 1971-2005 interval are slightly
Figure 3.6: Peak daily discharge records for the Athabasca and Bow Rivers.
Correlation is between peak daily discharge values, * denotes a significant
negative but none are statistically significant given the high variability and relatively low
number of observations. Over the shortest 1977-20054 period the trend is effectively zero.
Both rivers show significant decreases in the magnitude of their peak daily discharges over the 20th century and though both show a greater rate of decrease over the shorter 1971-2005 interval only the Bow record is statistically significant (Figure 3.6). However, if the high streamflows immediately prior to the 1976 shift are excluded, neither river’s trend is significant over the 1977-2005 period. The dates of peak discharge were
analyzed but showed a poor relationship between the rivers (r2 = 0.23, results not shown) and no significant trends. However, the dates of centre of mass of flow (CT, Figure 3.7) show a similar pattern to the trends in discharge magnitude (Figure 3.5). Both rivers
Figure 3.7: Date of centre of mass (CT) of annual flow of the Athabasca and Bow
Rivers. Correlation is between CT dates, * denotes a significant correlation.
4
show a shift to an earlier CT of ca. five (Athabasca) and seven days (Bow) over the entire record (ca. 90 years) but similar values (greater change) over the 1970-2004 period, although the trend in the Athabasca record is not significant. However, once again
neither trend is significant for the shorter 1977-2004, post 1976 shift, period and the slope of the best fit line is reduced. The trend in the long continuous Bow record of CT dates is highly significant at the 99% confidence level demonstrating a striking movement
towards earlier streamflow timing in the Bow watershed. The lower discharge volumes in the system decrease discharges and movement to an earlier CT date confirms that less water is moving through the system. As the Bow record is the longest high elevation record available for the southern Canadian Cordillera evaluation of these changes over time indicate that there are transformations occurring in the streamflow regimes in the mountains which will affect water availability though the entire watershed.
Figures 3.5-3.7 indicate similar trends and changes in streamflow volume, peak daily discharge and CT between the Athabasca and Bow records over their entire records and for the shorter contiguous intervals post 1971. However, the higher streamflow variability and shorter records for the Athabasca result in trends which are not statistically
significant, particularly in the post 1976 interval when the higher streamflows of the “cold” 1947-1976 phase of the PDO are excluded. Generally there has been an overall
decrease in streamflow volumes and an earlier date for the centre of mass on both rivers. Overall the general similarities between the Athabasca and Bow River data sets hold and, although the magnitude of their streamflow levels and timing of CT differ, the trends are similar. It seems reasonable to assume that changes in the Athabasca over the 20th century would have been similar to those that have occurred in the longer Bow record.
3.4
Comparison of the Athabasca and Miette Rivers
The Athabasca above Jasper carries meltwater from the Columbia, Chaba, and Hooker Icefields and the basin has ca. 8% glacier cover. The Miette basin has a glacial cover of ca. 0.2% and ranges in elevation from 1050m (Jasper) to 3100m above sea level. Both the Miette and Athabasca gauge records have ‘full Julian year data’ for 1915-1920 and 1976-2005. Although the earlier six year period is too short for trend analysis the data
Figure 3.8: The junction of the Athabasca and Miette Rivers. Photo courtesy of Dr
Brian Luckman.
between the two rivers over this short interval are comparable but are not used in this study as the focus here is on changes in long term trends. Therefore the major comparison uses data from the 1976-2005 common period entirely within the “warm phase” of the PDO. Although the Athabasca basin is about five times larger and has a
Table 3.3: Annual and summer (JJA) discharge for the Athabasca and Miette
Rivers for the 1976-2005 period of record.
Station Name Drainage Area (km2)
Glacier Cover %** Annual Yield (Q per km2)
Avg. Mean Annual Flow (m3/s)
Avg. Mean June Flow (m3/s)* / % of Annual Q
Avg. Mean July Flow (m3/s)* / % of Annual Q
Avg. Mean August Flow (m3/s)* / % of Annual Q
Athabasca River near Jasper
3872.7 7 8.23 87.3 236.3 / 22% 263.3 / 26% 204.3 / 20%
Miette River near Jasper
628.5 0.2 6.14 10.4 40.5 / 32% 27.2 / 22% 13.4 / 11%
Athabasca River above Japer
3244.2 8 8.60 75.6 192.9 / 21% 226.9 / 25% 184.7 / 21%
* Mean monthly values are based on years where ‘full year data’ is available ** Glacier Cover values from Dr. Roger Wheate, personal communication
Figure 3.9: Flow accumulation curve of the Athabasca River above Jasper and the
Miette River near Jasper for the common 1976-2005 period.
Figure 3.10: Monthly Fractional Flow of the Miette River near Jasper for
1976-2005.
Figure 3.11: Monthly Fractional Flow of the Athabasca River above Jasper for