Simulation of Optimized RES Based Power
Transfer and Storage System in Cooperative
Multi Area Network
Soujanya S, Amanulla
Student, Department of EEE, Ghousia College of Engineering, Ramanagaram, India
Asst. Professor, Department of EEE, Ghousia College of Engineering, Ramanagaram, India
ABSTRACT: In this paper work, we are using renewable energy sources in order to fulfill load demands in spite of disturbances and loses. In case of sudden congestion, storage of energy will help in fulfilling the required demand. Storage of energy is done frequently so that it will help in case of emergency. Storage of energy is done in flexible manner. In this system, we are using two Renewable energy sources for power generation system. i.e., PV-Array and Wind Mill. Addition of this two Renewable energy sources is fed as input to the system. We are using buck converters to have efficient Battery storage system, as the input voltage level of the PV-Array cell and wind mill is increased to the voltage consumption level of battery, to preserve the battery lifetime this converter will buck the input DC and store it into the battery. One port of the input is given to Converters part and other port of input is given to the Grid. For all our aim is to improve efficiency in renewable power systems and achieve the transmission ranges are improved by using the power station called "Transmission System Operators". Simulation work will be carried out using MATLAB/Simulink in order to achieve the transmission ranges are improved by using the power station, TSO and also improves efficiency.
KEYWORDS: Transmission System Operator, Optimal Power Flow, Multiarea, Optimization, Battery storage system, Predictive Model, Redispatch.
I. INTRODUCTION
The energy obtained from natural resources like sunlight, wind, geothermal heat etc is called Renewable Energy. As these are from natural occurrence it is limitless. The use of renewable energy sources to full extent in order to fulfill load demands in spite of disturbances and loses. In case of sudden congestion, storage of energy will help in fulfilling the required demand. Storage of energy is done frequently so that it will help in case of emergency. Storage of energy is done in flexible manner. The transmission system operator estimates the day a head schedule In this system, we are using two Renewable energy sources for power generation system. i.e., PV-Array and Wind Mill. Addition of this two Renewable energy sources is fed as input to the system. We are using buck converters to have efficient Battery storage system, as the input voltage level of the PV-Array cell and wind mill is increased to the voltage consumption level of battery, to preserve the battery lifetime this converter will buck the input DC and store it into the battery. One port of the input is given to Converters part and other port of input is given to the Grid.
Simulation work will be carried out using MATLAB/Simulink. By including “Battery Storage System” we can get rid of congestion. Our aim in this project is to have efficient usage of renewable power systems and achieve the Congestion relief disturbing the load fulfillment. For this system we design the PV Array and Wind Mill based power generation system, which provides power to the system and we have to use the boost converter to convert the low power DC input into high power DC output and send it to gird. Apart of input power is given to Buck Converter part of Battery Storage system. If the input voltage level of system is increased to the voltage consumption level of battery, this system will buck the input DC and store it into the battery to preserve the battery lifetime.
The transmission system operator (TSO) estimates the day-ahead schedule in order to give secure operation of transmission without any interruption, in case of sudden congestion arises; the Transmission System Operator is needed to alter the power flow in the network with all possible means. It means the network changes as per its requirements like the use of AC transmission systems which are flexible in nature. i.e., it can be altered as per requirement, the act of limiting redispatch of generated energy source in order to avoid unwanted losses.
However, redispatch events happens often and it is important as the flexibility of normal generation
and
storage devices is increased.The Complete system is simulated using MATLAB/SIMULINK and results are presented in this paper.
II. POWER MODEL REPRESENTATION
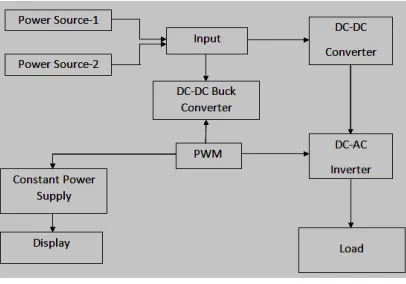
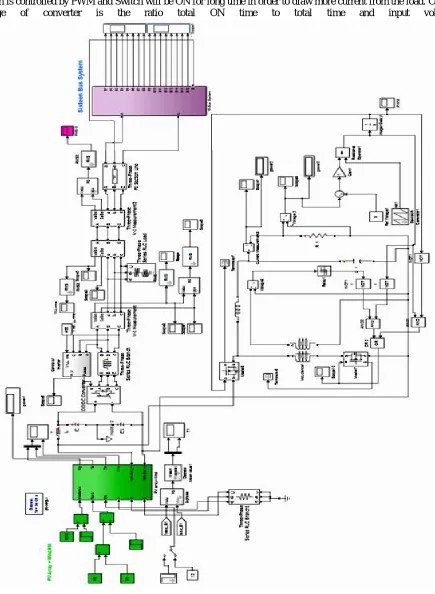
In model predictive, we will design system using Solar PV and wind generation system which provides power supply to entire system. The block diagram representation of “Simulation of optimized RES based power transfer & Battery Storage in Multiarea”.
Fig 1: Basic Block Diagram Representation
In above block diagram, Here Renewable Sources are used as the power sources. The Renewable energy is PV–Array and Wind Energy, the generated energy is used as input to the system and given to DC-DC converter in order to convert pulsating dc voltage into direct dc voltage and also increase voltage level. Filters are used before sending pulses so that it can eliminate the distortion/noises then sent to inverter. Buck converters are also inserted at appropriate place, so that it dispatches and re-dispatch power in order to have constant power supply in load center with appropriate voltage level.
We are using Power Optimization Algorithm and Model Predictive Control (MPC) Algorithm. Apart from this we are using one of important main Algorithm used in this system, in order to fulfill load end demands is “Battery Energy Optimization”.
The main Aim of the project is to fulfill load demands using Battery Energy Optimization. We Collect the power from different energy sources and convert into AC power source. Due to Global Energy crisis, more renewable energy sources are introduced.
(A) Power Sources to the system.
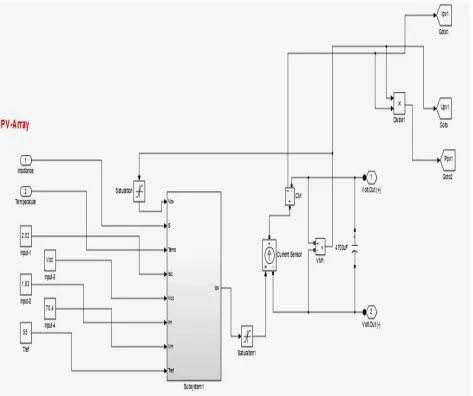
Power sources to system used are renewable energy sources. i.e., PV Array and Windmill are designed separately in a Sub-System block. In PV array subsystem, includes set of six subsystem blocks that you replace with a single subsystem block. In order to avoid, increases in size and complexity, we are using subsystems.
(a) PV Array
can be used in two ways, as solar thermal energy by captured heat and other form is by converting into electrical energy.
A photovoltaic array uses solar panels to convert solar energy to electrical energy. This PV array is made up of semiconductor materials. Each solar cell generate very low voltage around 0.5V. Hence, PV Array consists of series and parallel combination of Photovoltaic cells. Series combination is connected to have more voltage rating and parallel combination is connected to have appropriate current specification. This arrangement is responsible for generation of desired electric power depending on its parameters.
The Output voltage of photovoltaic cell depends on solar irradiation level during operation and Temperature. There are mainly two input port to Sub system-1
(i) Irradiance : It is the power obtained from Sun which is the electromagnetic radiation. In general, it is used to find Sunlight. Total Solar irradiance is the measure of solar energy per unit area incident on the Earths atmosphere. The SI unit of irradiance is watt per meter square.
(ii) Temperature : It Records the available temperature so that array observe it.
Input 1,2,3,4 and Tref are the 'Constant value' parameter. If 'Constant value' is a vector as 1-D', when this vector is on,
then 1-D is consider to be arrayOr else same Dimension matrix output is said constant value. Saturation Level is the Intermediate Level between Maximum and Minimum range of temperature in PV array. Saturation level is connected at input of the subsystem and also connected at output of the subsystem, to maintain it between the limits. From saturation level it is connected to Current sensors. These Current sensors are used to detect and convert current to measure output voltage easily and this is proportional to the current through the measured path.
Current measurement and voltage measurement are very important in this power system. This is connected at the output end in order to record the appropriate value at every interval of time. Current sensing is used for protection and control. This results into monitoring and increases its performance. Current sensing can be performed in two ways. i.e., Direct Sensing and Indirect Sensing. Ohms law is applied for direct sensing and Faradays & Amperes Law is employed for Indirect sensing. Here, Direct sensing is the measurement of voltage drop with current passing through passive elements of the circuit is performed. Practically, Capacitor is connected at the positive and negative terminal of PV Array in order to avoid unwanted capacitance between module and earth.
The output of PV Array is mentioned as IPV as current output, VPV as voltage output and PPV for Power indication. In the figure 6(a) represents the DC Output from PV Array. And it also shows that DC Output voltage varies wrt to time mainly depends on the temperature and irradiance. i.e., the Generation from the PV Array is not constant. In today’s system design, in order to yield high DC Voltage PV Arrays are connected in series modules
(b) Windmill
Wind power is a momentum, as moving object whose speed is multiplied in a particular direction. This can be used from small to large scale development. Small scale wind system is more flexible and its investment is less. It provides power to few areas with less rating. Capturing of wind energy for wind power generation is one of the important task, which is difficult to perform. Wind energy extracted from wind energy conversion system (WECS). This includes wind turbine, a generator, a power electronic converter and corresponding system. Electrical energy is obtained from conversion of kinetic energy of wind turbine to mechanical energy, which in turn converted to electrical energy in electric generator. Permanent magnet synchronous generators (PMSGs) are used to achieve High efficiency, High reliability and Lower cost generation of wind power.
Here, we have given two output ports for generator. The One output port of the generator is then given to DC - DC converter and other output port of generator is given to Battery storage system. The total excitation synchronous generator input power is the product of Tgand ωg .The power flow equation can be defined as,
TABLE I
Parameter of PM Synchronous Motor
Item Value
Flux linkage of stator winding (λm)
0.433 Vs/rad
PWM constant gain (Ka) 10
Viscous Friction coefficient (B) 0.0 Nm/sec Stator winding resistance (Ra) 0.425Ω
Stator winding inductance (L) 8.35mH
Motor Poles 8 pole
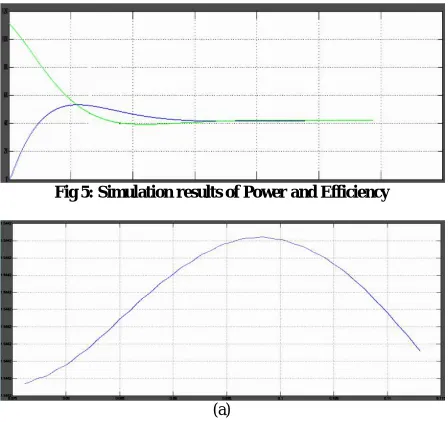
The power generated depends on the Rotation of the mill and based on this efficiency depends. In the below fig 8 represents two waveforms, the wave forms which is decreasing and reaches constant
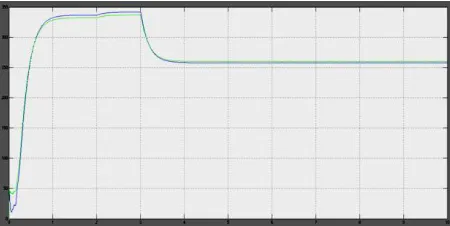
Presents the power generated based on Rotations and the waveform which is little raised represents the Efficiency of the system. In fig 6(b) represents the DC Output Voltage from the windmill.
Fig 3: Windmill representation in MATLAB/SIMULINK
(a)
(b)
Fig 4: Simulation Results of the (a) Speed versus Time and (b) Torque versus Time
Fig 5: Simulation results of Power and Efficiency
(b)
Fig 6: Simulation results of, (a) DC Output Voltage from PV Array and (b) DC Output Voltage from Wind mill
(B) DC - DC converter
In order to solve load matching problems, these converters are used. Hence it is connected between DC input and DC load. DC – DC Converter convert pulsating DC Output Voltage to the direct DC Output Voltage and it also boost the given Voltage. The Boost converter will boost the given input voltage. It raises to higher voltage level and reduces by few voltages and become constantoutput voltage.
Table II
Representation of Parameters In DC-DC Converter
Parameters Value
Power electronic Switch IGBT/ Diode
Inductor 0.1mH
Capacitor 2300µF
Resistance (RON) 1m Ω
(C) Inverter
Inverters are connected between Renewable energy sources and Grid. This connects generated power and grid. These inverters produce good quality output sine wave and they match up with the grid frequency. In order to achieve all this, Inverters will be in phase with the grid. The inverter is designed using PWM controlling IGBT module.
Inverters are connected between Renewable energy sources and Grid. This connects generated power and grid. These inverters produce good quality output sine wave and they match up with the grid frequency. In order to achieve all this, Inverters will be in phase with the grid. The inverter is designed using PWM controlling IGBT module.
The inverters connected to grid is introduced to control the in phase voltage with current in order to the power flow from variable dc source to power line always. A Single inverter is used for more than one module for few control of cost of that element.
Fig 8: Simulation Wave forms of Control of Inverter representing AC Voltage versus Time
RMS
RMS is abbreviated as “Root Mean Square”. RMS is used as filters in this system as it eliminates the distortion. RMS is used to identify and eliminate the distortion / Losses occurring in the waveform. RMS is fixed and continuous periodic wave.
The term RMS refers to the time varying sinusoidal voltages, currents or larger waveform where it changes with respect to the time. These are used only in AC Circuit Analysis whose magnitude will be constant always. This is said to be effective only when the RMS Voltage of alternating waveform supplies power to load as equivalent of the DC Circuits. RMS Voltage or RMS Current values of a sinusoidal can be calculated using Graphical method and Analytical Method. RMS Voltage can be defined as “the square root of the ratio of the sum of mid ordinates of voltage to the number of mid ordinates of voltages”. Graphical Method of analysis is easy manner. In Analytical method using peak voltages its been calculated. It is represented as,
VRMS = 0.7071 * Vm
Where, Vm is the peak valve.
The above formula can be used only when waveform is Sinusoidal and For Non - Sinusoidal waveform Graphical method is preferable but not Analytical Method.
Fig 9: Voltage measured from RMS
Fig 10: Current measured from RMS
(D) BUCK CONVERTER
Chopper consists of Power electronic switch device, here we are using MOSFET. MOSFET is connected in such a way that they produce required DC Voltage to load. The output voltage is obtained by adjusting ON time of the switch depending on ON time, pulse width is decided. Hence we have implemented Logical Gates, based on which pulse width is varied. Since we deal with Buck converter, further explanation is given below.
Switch is controlled by PWM and Switch will be ON for long time in order to draw more current from the load. Output voltage of converter is the ratio total ON time to total time and input voltage.
This method is more efficient as it increases the running time of the battery operated devices. The use of MOSFET switch along with PWM makes inverter suitable for all the types of load. A part of Output from PV Array and Wind Power is given to one input of MOSFET and other input of MOSFET is given from generated PWM.
Table III
Parameters and Its Value of DC-DC Converter
Parameters Value
Switch MOSFET
Inductor (L) 13mH
Load Resistor (Ω) 10Ω
Capacitor (F) 0.089µF
Drain Voltage(V) 40V
Snubber Resistance 1*105 Ω
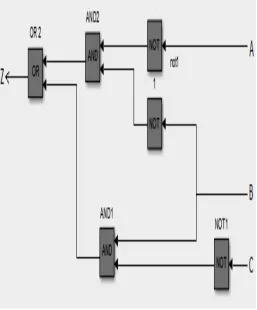
BOOLEAN EXPRESSION FOR LOGICAL CIRCUIT
Fig 12: Logic Devices-Generate Pulse Based On Relay
Boolean Expression for the above Logical circuit can be written as, A B + B C = A B + B C
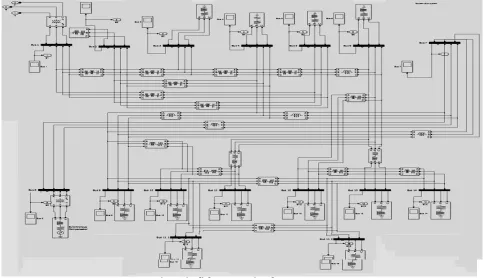
Fig 13: Simulink representation of 16 Bus-system
Table IV
Truth Table For The Above Given Expression
A B C F
0 0 0 1
0 0 1 1
0 1 0 1
0 1 1 0
1 0 0 0
1 0 1 0
1 1 0 1
1 1 1 0
So in the truth table for the values A, B, C is (0, 0, 0) and (0, 0, 1) is represented for A ˄ B and its final result will be ‘1’. In the truth table for representing (B ˄ C) the values of A, B, C will be (0, 1, 0) and (1, 1, 0) and its final value will be ‘1’. Expect in above two situations all other final values will be ‘0’. Ripple Voltage on output is dependent not only on output smoothing but more importantly on the input filter capacitor. Input and output filtering in Switch mode is more important because of swing that occurs at the input.
V. CONCLUSION
Decentralized Optimization has several issues. Hence will designing the system lot of care must be taken due to network constraints. The technique used in this paper gives secure operation which results in safe and efficient way of dispatch and practically it solves the problems at load end whenever sudden congestion occurs in the system. The Battery Storage algorithm is employed. The operation of the algorithm is shown with the implementation of the Buck Converters.
The technique used in this system will reduce dispatch and redispatch cost and hence provide flexibility to grid operation.
REFERENCES
[1] A. Nussler, “Congestion and redispatch in Germany. A model-based analysis of the development of redispatch,” Ph.D. dissertation, University of Cologne, Cologne, Germany, 2012.
[2] O. Galland, “The short-run security constrained economic dispatch,” Master's thesis, KTH Stockholm, Stockholm, Sweden, 2012.
[3] Matthias Kahl, Claudius Freye, and Thomas Leibfried, Member, IEEE, “A Cooperative Multi-Area Optimization With Renewable Generation and Storage Devices” IEEE TRANSACTIONS ON POWER SYSTEMS, VOL. 30, NO. 5, SEPTEMBER 2015.
[4] Amakye Dickson, N Mensah Sitti, Daniel Owusu Donkor, Nina Pearl Doe and Ernest A. Amakye, IJISET, “Grid Connected Inverter with Unity Power Factor for Renewable Energy (PV) Applications” IJISET TRANSCATION, VOL. 1 Issue 3, May 2014.
[5] Mohammad Ali Adelian, IJERGS, “Mixing Wind Power Generation System with Energy Storage Equpiments” IJERGS, VOL 2, Issue 3, April-May 2014.
[6] Esther Glory.S, Dhivya.P.S, Sivaprakasam.T. “Solar Powered High Efficient Dual Buck Converter For Battery Charging” IJIREEICE, Vol.1, Issue 9, December 2013
[7] K. Heussen, S. Koch, A. Ulbig, and G. Andersson, “Unified system level modeling of intermittent renewable energy sources and energy storage for power system operation,” IEEE Syst. J., vol. 6, no. 1, pp. 140–151, 2012.
[8] R. Findeisen, F. Allgöwer, and L. T. Biegler, Assessment and Future Directions of Nonlinear Model Predictive Control. Berlin, Germany: Springer, 2007, vol. 358.
[9] P. Biskas, A. Bakirtzis, N. Macheras, and N. Pasialis, “A decentralized implementation of DC optimal power flow on a network of computers,” IEEE Trans. Power Syst. vol. 20, no. 1, pp. 25–33, 2005.
[10] A. Venkat, I. Hiskens, J. Rawlings, and S. Wright, “Distributed mpc strategies with application to power system automatic generation control,” IEEE Trans. Control Syst. Technol., vol. 16, no. 6, pp. 1192–1206, Nov. 2008.
[11] IEEE Standard for Calculating the Current-Temperature of Bare Overhead Conductors, IEEE Std. 738-2006 (revision of IEEE Std738-1993), IEEE, 2007, vol. 1, pp. c1-59.
[12] J. Lofberg, “Yalmip: A toolbox for modeling and optimization in matlab,” in Proc. 2004 IEEE Int. Symp. Computer Aided ControlSystems Design, 2004, pp. 284–289.
[13] www.electronics-tutorials.ws [14] www.irena.org
[15] www.electroschematics.com
BIOGRAPHY
Soujanya S received the BE Degree in Electrical and Electronics Engineering from the Reva Institute of Technology, Bengaluru, Karnataka, India, in 2014. She is currently a student at Ghousia College of Engineering, Ramanagaram, Karnataka, India. Her areas of interests are in Power System Operation and Control, Reliability analysis and in alternative energy sources, State Estimation, Real time optimization, Plant wide control and monitoring.