Scholarship@Western
Scholarship@Western
Electronic Thesis and Dissertation Repository
6-29-2012 12:00 AM
The effect of multitalker background noise on speech intelligibility
The effect of multitalker background noise on speech intelligibility
in Parkinson's disease and controls
in Parkinson's disease and controls
Talia M. Leszcz
The University of Western Ontario Supervisor
Dr. Scott Adams
The University of Western Ontario
Graduate Program in Health and Rehabilitation Sciences
A thesis submitted in partial fulfillment of the requirements for the degree in Master of Science © Talia M. Leszcz 2012
Follow this and additional works at: https://ir.lib.uwo.ca/etd
Part of the Other Rehabilitation and Therapy Commons, Speech and Hearing Science Commons, and the Speech Pathology and Audiology Commons
Recommended Citation Recommended Citation
Leszcz, Talia M., "The effect of multitalker background noise on speech intelligibility in Parkinson's disease and controls" (2012). Electronic Thesis and Dissertation Repository. 628.
https://ir.lib.uwo.ca/etd/628
This Dissertation/Thesis is brought to you for free and open access by Scholarship@Western. It has been accepted for inclusion in Electronic Thesis and Dissertation Repository by an authorized administrator of
THE EFFECT OF MULTITALKER BACKGROUND NOISE ON SPEECH INTELLIGIBILITY IN PARKINSON’S DISEASE AND CONTROLS (Spine title: The Effect of Background Noise on Speech Intelligibility)
(Thesis format: Monograph)
by
Talia Michelle Leszcz
Graduate Program in Health & Rehabilitation Sciences
A thesis submitted in partial fulfillment of the requirements for the degree of
Master of Science
The School of Graduate and Postdoctoral Studies The University of Western Ontario
London, Ontario, Canada
THE UNIVERSITY OF WESTERN ONTARIO School of Graduate and Postdoctoral Studies
CERTIFICATE OF EXAMINATION
Supervisor
______________________________ Dr. Scott Adams
Supervisory Committee
______________________________ Dr. Allyson Dykstra
______________________________ Dr. Mandar Jog
Examiners
______________________________ Dr. Allyson Dykstra
______________________________ Dr. Lisa Archibald
Randi Fisher, MSc, SLP
______________________________ Dr. Julie Theurer (Examination Chair)
The thesis by
Talia Michelle Leszcz
entitled:
THE EFFECT OF MULTITALKER BACKGROUND NOISE ON SPEECH INTELLIGIBILITY IN PARKINSON’S DISEASE AND CONTROLS
is accepted in partial fulfillment of the requirements for the degree of
Master of Science
iii
Abstract
This study investigated the effect of multi-talker background noise on speech intelligibility in participants with hypophonia due to Parkinson’s disease (PD). Ten individuals with PD and 10 geriatric controls were tested on four speech intelligibility tasks at the single word, sentence, and conversation level in various conditions of background noise. Listeners assessed speech intelligibility using word identification or orthographic transcription
procedures. Results revealed non-significant differences between groups when intelligibility was assessed in no background noise. PD speech intelligibility decreased significantly relative to controls in the presence of background noise. A phonetic error analysis revealed a distinct error profile for PD speech in background noise. The four most frequent phonetic errors were glottal-null, consonant-null in final position, stop place of articulation, and initial position cluster-singleton. The results demonstrate that individuals with PD have significant and distinctive deficits in speech intelligibility and phonetic errors in the presence of
background noise.
Keywords
iv
Acknowledgments
An undertaking like this could not have been completed without the help and support from a number of people. First and foremost, I would like to express gratitude towards my
supervisor, Dr. Scott Adams. Thank you for encouraging me to pursue this Master’s degree. I will carry this experience and the knowledge I gained with me through the rest of my life. Your commitment, support, patience and passion for research were constant sources of inspiration and guidance throughout this entire process.
I would also like to thank my lab mates, Jenna Clark and Teresa Valenzano for your friendships and for always reminding me that I am not the only person who, at times, feels lost in the process.
I would like to acknowledge Lana Goldberg, Monica Schell, Leah Deniehl McCorkill and all of my research participants for assisting me with data collection and analysis.
Finally, I am especially indebted to my loving and incredibly committed parents, Bonny and Molyn Leszcz. I would not be where I am today without your endless support and
v
Table of Contents
CERTIFICATE OF EXAMINATION ... ii
Abstract ... iii
Acknowledgments... iv
Table of Contents ... v
List of Tables ... viii
List of Figures ... x
List of Appendices ... xii
Chapter 1 ... 1
1 Introduction ... 1
1.1 Parkinson’s Disease ... 1
1.2 Hypokinetic Dysarthria ... 2
1.3 Hypophonia ... 4
1.4 Intelligibility ... 6
1.5 Intelligibility Measurement ... 7
1.6 Intelligibility in Noise ... 9
1.7 Lombard Effect ... 11
1.8 Intelligibility and Parkinson’s Disease ... 12
1.9 Rationale ... 13
1.10Objectives and Hypotheses ... 14
Chapter 2 ... 16
2 Methods ... 16
2.1 Participants ... 16
2.2 Apparatus ... 19
vi
2.4 Speaker Procedures ... 23
2.5 Listener Procedures ... 24
2.5.1 Correct Word Identification ... 25
2.5.2 Orthographic Transcription ... 27
2.6 Speech Intensity ... 28
2.7 Measures and Analyses ... 28
Chapter 3 ... 31
3 Results ... 31
3.1 Speech Intelligibility Results ... 31
3.2 Main Effects: Group, Noise Conditions and Test Type ... 32
3.3 Interactions: Group, Noise Conditions and Test Type ... 36
3.4 Additional Analyses Involving the Extra 75 dB Noise Condition ... 40
3.4.1 DFD... 41
3.4.2 PIT... 42
3.4.3 SIT... 44
3.4.4 Conversation ... 46
3.5 Reliability ... 47
3.6 Phonetic Error Analysis ... 48
3.7 Speech Intensity Results ... 53
3.8 Main Effects: Group, Noise Conditions and Test Type ... 55
3.9 Interactions: Group, Noise Conditions and Test Type ... 59
Chapter 4 ... 63
4 Discussion ... 63
4.1 Speech Intelligibility ... 63
4.2 Speech Intelligibility Tests ... 65
vii
4.3.1 University of Western Ontario Distinctive Features Differences Test
(DFD). ... 74
4.3.2 Phonetic Intelligibility Test (PIT) ... 75
4.4 Speech Intensity ... 80
4.5 Lombard Effect ... 82
Chapter 5 ... 84
5.1 Limitations of the Current Study... 84
5.2 Future Directions ... 86
5.3 Clinical and Research Implications ... 87
5.4 Summary and Conclusions ... 88
References ... 91
Appendices ... 101
viii
List of Tables
Table 1. Description of PD Participants ... 16
Table 2. Description of Control Participants ... 17
Table 3. Overall Mean Intelligibility Scores (%) ... 32
Table 4. Mean Intelligibility Scores (%) by Group ... 33
Table 5. Mean intelligibility scores (%) in each noise condition ... 34
Table 6. Mean Intelligibility Scores (%) by Test ... 35
Table 7. Mean Speech Intelligibility Scores (%) Noise by Group Interaction ... 37
Table 8.Mean Speech Intelligibility (%) Test by Group Interaction ... 38
Table 9. Intelligibility Scores (%) Test by Noise Interaction ... 39
Table 10. DFD intelligibility scores (%) ... 42
Table 11. PIT Intelligibility Scores (%) ... 43
Table 12. SIT Intelligibility Scores (%) ... 45
Table 13. Conversation Task Intelligibility Scores (%) ... 46
Table 14. Inter and Intra-Judge Reliability ... 48
Table 15. Number of DFD Consonant Errors (65 dB Noise Condition) ... 49
Table 16. Average PIT Error Rate (%) ... 51
Table 17. Overall Mean Speech Intensity Levels (dB) ... 54
Table 18. Group Speech Intensity Levels (dB) ... 56
ix
Table 20. Speech Intensity Levels (dB) by Test ... 58
Table 21. Speech Intensity Levels (dB) Group by Noise Interaction ... 59
Table 22. Speech Intensity Levels (dB) Test by Group Interaction ... 60
x
List of Figures
Figure 1. Experimental Setup ... 21
Figure 2. Mean intelligibility scores (%) ... 32
Figure 3. Mean intelligibility scores (%) by group ... 34
Figure 4. Mean intelligibility scores (%) in each noise condition ... 35
Figure 5. Mean intelligibility scores (%) by test ... 36
Figure 6. Effect of background noise on intelligibility scores (%) ... 37
Figure 7. Effect of test on intelligibility scores (%) ... 39
Figure 8. Effect of background noise on intelligibility scores (%) ... 40
Figure 9. Effect of background noise on DFD intelligibility scores (%) ... 42
Figure 10. Effect of background noise on PIT intelligibility scores (%) ... 44
Figure 11. Effect of background noise on SIT intelligibility scores (%) ... 45
Figure 12. Effect of background noise on the Conversation intelligibility scores (%) 47 Figure 13. Number of times a sound was in error on the DFD (65 dB) ... 50
Figure 14. Group average error rate (%) on the PIT ... 51
Figure 15. Error rates for the three most severe PD participants ... 53
Figure 16. Overall speech intensity levels (dB) ... 55
Figure 17. Group speech intensity levels (dB) ... 57
Figure 18. Speech intensity levels (dB) by noise condition ... 58
xi
Figure 20. Effect of background noise on speech intensity levels (dB) ... 60
Figure 21. Effect of test on speech intensity levels (dB) ... 61
xii
List of Appendices
Appendix A. UWO Ethics Approval ... 101
Appendix B. Participant Letter of Information ... 102
Appendix C. Participant Consent Form ... 105
Appendix D. Listener Letter of Information ... 106
Appendix E. Listener Consent Form ... 109
Appendix F. 3-way Intelligibility ANOVA ... 110
Appendix G. 2-way ANOVA Intelligibility Measure ... 112
Appendix H. DFD Errors (65 dB) ... 117
Appendix I. PIT phonetic contrasts ... 118
Appendix J. PIT T-Test ... 119
Appendix K. Mean PIT errors - three most severe participants ... 121
Appendix L . 3 Way ANOVA Speech Intensity ... 122
Chapter 1
1
Introduction
1.1 Parkinson’s Disease
Parkinson’s disease (PD) is a progressive neurodegenerative disorder associated with various motor control and speech impairments. The disorder is named after James Parkinson whose essay The Shaking Palsy, first published in 1817, highlights the key features of the illness (Parkinson, 2002). PD onset usually occurs later in life with a mean onset age of 55 and much higher incidence by 70 years of age (Dauer & Przedborksi, 2003). Reported incidence rates are between 8-18 per 100 000 persons (de Lau & Breteler, 2006). Currently there are over 5 million diagnosed cases of PD in the world, a number that is predicted to increase to around 9 million by 2030 due to the world’s ageing population (Dorsey et al., 2006). The term Parkinsonism refers to the clinical symptoms of the disease regardless of the etiology, whereas PD traditionally refers only to the idiopathic form of the disease (Duffy, 2005). The disease is characterized by the degeneration of dopaminergic neurons in the substania nigra. PD is commonly known as a disease of motor control and about 75% of all individuals with PD suffer from a speech or voice disorder (Ramig, Countryman, O’Brien, Hoehn, & Thompson, 1996). Dopamine reduction is present in all individuals with PD and it is responsible for the diminished motor and speech control observed in this population (Spencer, Morgan, & Blond, 2009).
predominates, individuals with PD can also develop tremor during actions and postures throughout the course of the disease (Gelb et al., 1999). Akinesia can include
bradykinesia (slowness of movement), hypokinesia (reduced movement amplitude) and a reduction in spontaneous or associative movements. Akinesia also can manifest as a lack of facial animation and a rigid, unsmiling and expressionless face (Dauer & Przedborski, 2003; Duffy, 2005). Postural instability usually occurs later in the disease, and can be associated with an increase in falling and difficulty supporting oneself as well as a shuffled gait (Gelb et al., 1999). Individuals with PD also experience difficulty writing due to their increased rigidity, inability to control motor coordination and reduced movement amplitude. Writing is often illegible and very small, a symptom known as micrographia (Gelb et al., 1999).
1.2 Hypokinetic Dysarthria
Hypokinetic dysarthria is the motor speech disorder that Darley, Aronson and Brown (1969) used to describe the speech impairments associated with idiopathic PD. It is a disease of the basal ganglia control circuit, which plays an important role in
movement control. Damage to this area can affect all levels of the speech system (Duffy, 2005). Although the term hypokinetic dysarthria was originally developed to describe the speech of idiopathic PD it is frequently used to describe the Parkinson-like speech of other similar degenerative disorders such as progressive supranuclear palsy (PSP), multi-system atrophy (MSA), and parkinsonism due to vascular or infectious causes (Duffy, 2005).
in PD. The characteristics of hypokinetic dysarthria include reduced loudness (i.e., hypophonia), monopitch, monoloudness, disordered rate of speech, prosodic
abnormalities, impaired articulation and abnormal voice quality (Darley, et al., 1969). These speech deficits result in the generation of a distorted acoustic signal and as a result, reduced intelligibility.
As the disease progresses, speech degrades, however at a variable rate from motor impairments. Speech intelligibility becomes increasingly reduced making communication difficult, which can limit social interactions, interfere with employment and consequently may have a detrimental effect on the individual’s quality of life (Brod, Mendelsohn & Roberts, 1998).
Hypokinetic dysarthria is most frequently manifested in prosodic, articulation and voice impairments (Duffy, 2005). Prosodic impairments such as monopitch and
include spirantization, and the timing of vocal onset and offset (Adams & Dykstra, 2008). Spirantization refers to the presence of fricative like noise during stop consonants and is a characteristic unique to Parkinsonian dysarthria. Individuals with PD show higher rates of spirantization than healthy geriatrics, particularly of stop consonants that are not normally spirantized. Individuals with PD often demonstrate longer voice onset times and voicing through closure during voiceless stops due to their reduced force of movement and inability to make adequate vocal fold closure to produce clearly articulated stops (Weismer, 1984). Voice disorders are the most frequently occurring PD speech
impairment. Voice disorders, such as, hoarseness, roughness, tremulousness, breathiness and harshness occur in almost 90% of individuals with PD (Logemann et al., 1978). Disordered voice quality is measured acoustically using phonatory instability measures such as jitter, shimmer and harmonics-to-noise ratio. (Ramig et al., 2001; Ramig et al., 2004). Laryngeal disorders have also been observed. Less commonly, resonance problems such as hypernasality or fluency disorders (i.e., stuttering) can occur in some individuals. Dysfluencies typically include syllable repetitions, prolonged or shortened syllables and abnormally long pauses (Logemann et al., 1978).
1.3 Hypophonia
Hypophonia is a common problem in individuals with PD that has the potential to impact speech intelligibility and inevitably, effective communication. Hypophonia refers to reduced speech intensity and has been well documented anecdotally as well as
themselves despite thinking that they are speaking at a normal volume (Adams, 1997; Ho, Bradshaw & Iansek, 2000).
Hypophonia is recognized as a distinctive feature of Parkinsonian dysarthria, however the acoustic correlates of these perceptual features have been difficult to find. Individuals with hypophonia have been shown to demonstrate speech intensity levels that are significantly lower (2-3 decibels (dB)) than healthy adults (Adams et al., 2006b; Adams, Haralabous, Dykstra, Abrams & Jog, 2005; Fox & Ramig, 1997). A 2-4 dB decrease in speech intensity is perceived as a 40% reduction in speech volume (Fox & Ramig, 1997). Individuals with PD also demonstrate significantly lower maximum speech intensity (6-7 dB) than healthy adult controls (Adams et al. 2006b). In addition, Ho, Iansek & Bradshaw (2001) demonstrated a progressive decrease in speech intensity throughout the span of individual utterances similar to the decrease in amplitude of sub-movements within a motor sequence. The authors suggest that hypophonia is the speech analogue of hypokinesia, however this hypothesis has yet to be systematically tested (Ho, Iansek, & Bradshaw, 2001; Ho, Bradshaw, & Iansek, 2008).
The lack of accord between perceptual and acoustic measures suggests that there may be additional parameters contributing to the perception of reduced speech intensity in individuals with PD (Adams, 1997). One factor contributing to the lack of acoustic measures of reduced speech intensity may be due to the difficulty obtaining natural speech samples in laboratory settings and the lack of standardization in intensity
impairment, poor voice quality and a higher signal to noise ratio may contribute to the perception of reduced loudness in PD.
1.4 Intelligibility
The concept of speech intelligibility is of primary importance in dysarthria because reduced intelligibility is a frequent and almost universal consequence of dysarthric speech (Yorkston & Beukelman, 1984). Intelligibility has also been
investigated extensively in the areas of military systems, electronic and hearing-impaired speech recognition (Kryter, 1994). Intelligibility assessment of hypokinetic dysarthria and hypophonia associated with PD is a central issue in speech therapy with the ultimate goal of intervention to increase intelligibility (Connolly, 1986; Yorkston & Beukelman, 1980). Intelligibility may serve as an index of disease severity and allow for examination of the extent and nature of speech impairments.
Intelligibility is broadly viewed as successful oral communication and the ability of the listener to comprehend the speakers’ message. Specifically, intelligibility has been defined by Kent, Weismer, Kent & Rosenback (1989) “as the degree to which the
topic (De Bodt, Hernandez-Diaz, & Van de Heyning, 2002). These authors suggest that intelligibility can be viewed as a linear combination of each of these factors. It is imperative to control all variables when assessing intelligibility in order to identify the breakdown in communication contributing to the reduced intelligibility.
1.5 Intelligibility Measurement
Intelligibility is a perceptual measure that is based on the accuracy with which listeners are able to understand a spoken utterance. It varies along a prothetic continuum because it is a stimulus that is additive in nature and is assessed as a quantity rather than as a quality dimension (Kent et al., 1989). An intelligibility score can provide useful clinical information such as a quantification of the severity of a speech disorder. It can also be used to evaluate the effects of treatment, document disease progression, and in some specialized testing procedures (i.e., phonetic or phonemic intelligibility tests) it can provide insight into speech subsystem impairments including respiration, phonation, articulation and resonation (Hustad, 2007).
Traditionally, intelligibility has been measured by three basic methods;
Each method of measurement can reveal different elements that contribute to intelligibility deficits in dysarthric speakers. Measurement of intelligibility is challenging and can be somewhat unreliable due to interactions between the myriad of factors
involved in communication. It is critical when measuring intelligibility that all variables are tightly controlled such as stimuli, listener context, testing environment and variability between objective and subjective measures and stimulus presentation. Accurate
measurement of intelligibility is critical because of its implications for clinical decision-making.
1.6 Intelligibility in Noise
To maintain adequate intelligibility in the presence of background noise it is necessary for speakers to increase the level of their speech relative to that of the noise. Signal-to-noise ratio refers to the effect of background noise on speech transmission and has far reaching implications in the area of speech intelligibility. It has been studied extensively in areas such as hearing impairments, soldiers in combat, aircraft pilot communications, speech transmission systems and speech recognition technology (Kryter, 1994). Increasing levels of background noise exerts a distorting or masking effect on the frequencies and acoustic qualities of speech (Kryter, 1994; Miller &
Niceley, 1955). Acoustically, loud speech is characterized by an increase in fundamental frequency (F0) and sound pressure level (SPL). Loud speech requires an increase in buildup of subglottal pressure and is associated with spectral and temporal changes (Huber, Chandrasekaran & Wolstencroft, 2005; Turner, Martin & de Jonge, 2008). Loud speech, as well as amplified speech in PD has been associated with increases in
PD often have respiratory and/or phonatory impairments consequently resulting in problems of reduced speech intensity and hypophonia and difficulty maintaining intelligible speech in the presence of background noise. Adams and colleagues (2008) demonstrated that individuals with PD will modulate their speech intensity in the presence of background noise, but continually show reduced signal-to-noise ratios relative to controls. Individuals with PD consistently demonstrated signal-to-noise ratios that were 2-3 dB lower than controls and were associated with 20-30% reductions in conversational speech intelligibility (Adams et al., 2008).
The systematic investigation of masking noise on speech perception allows for the development of confusion matrices to quantify the perceptual elements of speech sounds based on similar sounds with which they are commonly confused (Phatak, Lovitt & Allen, 2008) The development of confusion matrices for English sounds in different noise contexts aids in the understanding of speech recognition systems and has far reaching implications in the development of hearing aids and automatic speech
recognition devices and provides insight into human speech recognition. Unfortunately, the perception of speech in noise and the development of confusion matrices for
dysarthric speech have received minimal investigation.
1.7 Lombard Effect
The Lombard effect refers to the automatic and involuntary increase of speech intensity as levels of background noise increase in order to maintain comprehensible speech for the listener as well as the speaker (Ho, 1999; Zhao, & Jurafsky, 2009, Lane & Tranel, 1971). The Lombard effect has been demonstrated consistently in a number of populations however conflicting results exist regarding the extent of the Lombard effect in individuals with PD. Ho et al. (1999) found that individuals with PD find it difficult to regulate speech intensity and demonstrate an abnormal pattern of volume regulation. Individuals with PD demonstrated a reduced or absent Lombard effect when pink noise was presented as masking noise. However, Adams et al. (2008) compared speech
Lombard-induced speech for healthy individuals is accompanied by a hyperarticulation of phonetic segments to increase comprehensibility of spoken words. However Lombard speech in individuals with PD is only moderately associated with a significant increase in intelligibility (Zhao & Jurafsky, 2009; Adams & Lang, 1992, Adams et al., 2008). It is important to investigate the nature of intelligibility deficits in the Lombard-induced speech of individuals with PD.
1.8 Intelligibility and Parkinson’s Disease
Intelligibility is almost inevitably impaired in individuals with hypokinetic dysarthria due to PD. Reduced intelligibility in PD is associated with hypophonia, monopitch, monoloudness, disordered speaking rate and imprecise articulations (Duffy, 2005). Intelligibility assessments frequently serve as an index of severity and as an overall indicator of speech adequacy (Yorkston & Beukelman, 1981).Speech distortions in dysarthric speech arise from movement impairments and do not involve language-based or word-retrieval problems. Rather, reduced intelligibility is due to a problem of information transfer, impaired articulatory function and reduction in fine motor control (Yorkston, Dowden & Beukelman,1992).
When assessing dysarthria, it has generally been assumed that the characteristics of dysarthria occur consistently across speech tasks. However, Kempler and Van Lacker (2002) suggest that dysarthria does vary across speech tasks. These researchers
the spontaneous utterances suggesting that dysfluencies are a prominent impediment to intelligible speech. These dramatic speech task effects suggest that an ecologically valid assessment of intelligibility in PD may require extensive and comprehensive sampling of different speech tasks, speaking conditions and social contexts.
1.9 Rationale
Hypophonia is a highly prevalent speech impairment in PD patients and
depending on the nature of the hypophonia, is relatively resistant to drug and behavioral therapies. Individuals with PD report that hypophonia has a large and negative impact on their day-to-day communication, the effects of which are dramatically more apparent in increasing levels of background noise (Adams et al., 2006b). Combined with prosodic and articulatory impairments, individuals with PD appear to find it extremely difficult to maintain intelligible speech in the presence of background noise (Adams et al., 2008, Dykstra (2012), Adams, Jog (2012). Unfortunately, this observation has received limited systematic attention in previous studies of PD.
Intelligibility assessments mustattempt to accurately measure the difficulties that individuals with PD face in daily communication however the measurement of
previous research provided a general measure of the effect of background noise on speech intelligibility but did not provide a detailed evaluation of the phonetic, acoustic or articulatory features that were responsible for the intelligibility deficit. A major focus of the present study is to obtain a more comprehensive evaluation of the speech
intelligibility deficit associated with PD and to develop a detailed phonetic explanation of the effect of background noise on speech intelligibility in individuals with PD.
1.10 Objectives and Hypotheses
The primary goal of the present study was to examine the impact of background noise on speech intelligibility in individuals with PD as well as controls.
The first objective of this study was to examine the effects of quiet and loud multi-talker background noise (65dB and 75dB) on speech intelligibility in PD and control participants. It was hypothesized that both PD and control participants will show a reduction in speech intelligibility in the presence of background noise. However, it was hypothesized that the speech intelligibility of participants with PD will show a greater reduction relative to controls.
The third objective was to investigate the relationship between speech intensity modulation in the presence of background noise and measures of speech intelligibility. It is hypothesized that individuals with PD will modulate their speech intensity in the presence of background noise, but that this will not contribute to maintaining speech intelligibility at the level of control participants.
Chapter 2
2
Methods
2.1 Participants
Speakers. The study included 10 participants between 62 and 79 years old (M = 72.4, SD = 5.06) diagnosed with mild to moderate idiopathic Parkinson’s disease who suffer from hypokinetic dysarthria and hypophonia as reported by a neurologist. There were a total of five males and five females. All participants with PD were classified between stages 1-3 of the Hoehn and Yahr System for staging Parkinsonism (Hoehn & Yahr, 1967). Participants with PD were all patients of neurologist, Dr. Mandar Jog at the Movement Disorders Clinic, London Health Sciences Centre in London, Ontario, Canada and were recruited by Dr. Scott Adams. PD participant demographic information is listed in Table 1. The study also included 10 age-equivalent healthy control subjects between 65 and 83 years old (M = 74.7, SD = 5.29). Control participants were recruited from the Retirement Research Association and the Canadian Centre for Activity and Aging at the University of Western Ontario by Professor Scott Adams and Talia Leszcz. The control participants were in overall good health with an absence of any speech, language, hearing or neurological impairments. Control participant demographic information is listed in Table 2.
Table 1. Description of PD Participants
Participant Age Gender Years Since Diagnosis
Previous Occupation
P21 73 M 5 Bank Account Manager
Sinemet
P22 77 M 4 Engineer Sinemet
P23 70 F 5 Supervisor Sinemet
P24 79 M 1 Mechanic Sinemet
P25 75 M 14 Labourer Levodopa
P26 76 F 16 Teacher Sinemet
P27 62 M 16 Salesman Sinemet
P28 72 F 7 Secretary Levodopa
P29 74 F 3 Teacher Levodopa
P30 67 F 9 Teacher Levodopa
Table 2. Description of Control Participants
Participant Age Gender Previous Occupation
P1 83 F N/A
P2 80 M Techincal Director
P3 72 M Teacher
P4 65 F Teacher
P6 72 M Surveyor
P7 71 M Financial Advisor
P8 77 M Professor
P9 72 F Art Therapist
P10 76 M Engineer
All participants were given a letter of information (Appendix B) about the study, along with a consent form (Appendix C) before agreeing to participate. All participants passed a 40 dB HL hearing screening and demonstrated functional reading ability. All participants were native English speakers and had not received speech therapy for at least one year prior to experimental testing. None of the participants reported previous history of a speech, language, hearing impairment or neurological disorder aside from PD. Any participant with a history of an additional neurological disorder other than PD (e.g., stroke) was excluded from the study. Participants with PD were stabilized on their anti-parkinsonian medication and were tested approximately one hour after taking their regularly scheduled anti-parkinsonian medication.
Listeners. Twenty listeners (18-30 years) were recruited to evaluate the speech intelligibility of both the Parkinson and control participant speech samples using orthographic transcription and/or correct word identification procedures. Listeners
literacy skills are assumed. All listeners were given a letter of information (Appendix D) about the study, along with a consent form (Appendix E) before agreeing to participate.
2.2 Apparatus
Each PD and control participant completed all of the experimental procedures during a single, 60-minute session in the Speech Movement Disorders Laboratory in Elborn College at the University of Western Ontario. During the experimental session, each participant was tested under three noise conditions (no noise, low-moderate (65dB) and high-moderate (75dB) multi-talker background noise) while performing four
different speech tasks. During the experimental procedures, subjects were seated in an audiometric sound-proof booth (Industrial Acoustic Company) with the examiner present. Throughout the session the participant was positioned between a loudspeaker and a boom-mounted, microphone. The participant, the loudspeaker and the microphone were arranged in an equilateral triangle involving a 150 cm distance on each side (see Figure 1). The loudspeaker presented free-field multi-talker background noise (Audiotech – 4 talker noise) at two sound pressure levels (SPL), 65 dB and 75 dB. The experimenter controlled the SPL of the noise using a laptop computer that played previously calibrated files (.wav) of multi-talker noise through the output of the computer’s sound card, which was connected to an audio amplifier and loudspeaker. The boom-mounted floor
speech without the inclusion of the background noise. The headset microphone served as a secondary recording and was used as a reference for the participants’ intended
Figure 1. Experimental Setup
2.3 Materials
Background Noise. Each participant completed four different speech tasks including three standard intelligibility tests, and a conversational speech task. Each of these four speech tasks were completed in two different background noise conditions; no noise and 65 dB SPL. The conversational speech task and sentence intelligibility task were also completed in the presence of 75 dB SPL of multi-talker noise. Only two of the tasks were completed in the high level of multi-talker background noise due to difficulty with time constraints and the stress placed on participants to speak at very high intensities for extended periods of time. The multi-talker noise was obtained from a standard
connector of a laptop computer’s sound card that was connected to an audio amplifier and loudspeaker located within an audiometric booth (Industrial Acoustic Company). This calibrated laptop-based playback system was used to set the intensity level of the multi-talker noise in the 65 and 75 dB SPL noise conditions. The order of the speech tasks and noise conditions was randomized for each participant. All of the speech tasks and noise conditions were audio-recorded.
Audio Recording. During the experimental speech tasks and noise conditions, the participants’ speech was audio recorded using the boom-mounted floor microphone (Shure SM48) and the headset microphone (AKG C-420) attached via dual XLR
presentation to the listeners. The sentence utterances and conversation audio files were compiled into Windows Media Player (version 12) for presentation to listeners.
2.4 Speaker Procedures
The Univerisity of Western Ontario Distinctive Features Differences Test
(DFD) (Cheesman & Jamieson, 1996) is a feature-based test that assesses the
intelligibility of 21 intervocalic consonant phonemes from the English language. Feature based testing is highly sensitive to small differences in speech perception. The test provides researchers and clinicians with an overall measure of intelligibility as well as a diagnostic measure with which to identify and estimate the frequency of specific types of consonant confusion errors made over time or in various listening conditions. The
examiner presented a single nonsense word on an index card (10cm x 15cm) in the form “aCil” in which C represents one of the 21 target consonants always presented in a word-medial context. The participant was instructed to read the word aloud and then read aloud the same word in the following repeated carrier phrase “Point to the word _____, point to the word _____.” Order of target consonants was randomized among subjects and between noise conditions.
Phonetic Intelligibility Test (PIT) (Kent et al., 1989). The PIT was originally designed as a phonetically-oriented assessment of the intelligibility of dysarthric speakers. The PIT was developed as a multiple choice single word test that
in the following repeated carrier phrase “I’ll say ____ again. I’ll say ____ again”. The complete list of 70 PIT words and the repeated carrier phrase was read aloud by each participant in each noise condition. Two possible word orders were randomized among participants and within each noise condition.
Sentence Intelligibility Test (SIT) (Yorkston & Beukelman, 1996). The SIT is one of the most widely used tests of sentence intelligibility that has been developed for the assessment of dysarthria. The SIT is a revised, shortened version of the Assessment of Intelligibility of Dysarthric Speech (AIDS) (Yorkston & Beukelman, 1981). The SIT consists of 11 randomly generated sentences ranging in length from 5 to 15 words. One sentence at each of the 11 word lengths (5-15 words) is randomly selected from a pool of 100 sentences of each length (i.e. total sentence pool is 1100 sentences). Each participant was given three unique lists of the 11 sentences printed on a page and asked to read the sentences aloud. Each page of sentences was read in a different noise condition.
Conversational speech task. Conversations were initiated by the examiner and maintained for approximately 2 to 3 minutes in each of the three noise conditions.
Participants were instructed to talk about anything they wished. Possible topics included; hobbies, family members, occupational experiences, and recent or future vacations.
2.5 Listener Procedures
the correct word identification listening tasks employed in the DFD and PIT. Each listener listened to both tests in both noise conditions (n = 4) from a single participant. They then listened again to one of the four tests from that same participant and one of the four tests from another participant to obtain ratings of inter and intra judge reliability. One listener completed all of the orthographic transcription of the conversation and sentence tasks. One month later, that listener judged 10% of the conversation and SIT tests a second time to obtain a rating of intra judge reliability. A second listener listened to 25% of the conversation and SIT tests to obtain a rating of inter judge reliability. Listeners were not informed if they listened to a speech sample from a disordered or normal speaker. The listening procedures and intelligibility evaluations associated with each of the four speech tasks will be described in the following sections.
2.5.1 Correct Word Identification
Twenty listeners were used to listen and judge the participants’ DFD and PIT based on correct word identification. Listener intelligibility assessments were based on the participants’ words in isolation, rather than in the carrier phrase. This method was selected due to concerns about listeners’ time commitments and because the DFD and PIT were originally designed as single word intelligibility tests. Accordingly, a similar method was employed as described by the authors of the tests (Kent et al. 1989;
Cheesman, & Jamieson, 1996). The use of the carrier phrases has potential benefits and will be discussed later.
familiarity is likely to inflate listeners’ perceptions of intelligibility (Walshe et al., 2009). In order to limit this potential listener familiarity effect, a one-to-one listener to speaker ratio was used. Each listener was presented with DFD tests and PIT tests obtained from a single participant under each of the two noise conditions (no noise and 65 dB) for a total of 2 DFD tests (42 DFD words) and 2 PIT tests (140 words) per listener. Additionally, each listener re-listened to one of the four tests they initially judged and one of the four tests from a different participant in order to examine inter-rater and intra-rater reliability.
University of Western Ontario Distinctive Feature Differences Test (DFD).
The listeners were required to correctly identify the target phoneme in each presentation from the list of the 21 possible consonants. The results of the DFD provided an error profile score across 21 different phonemic errors. The DFD also provides a percent intelligibility score based on the number of correctly identified target words.
2.5.2 Orthographic Transcription
One of the listeners who evaluated the DFD and PIT was selected to evaluate the SIT and the conversation task for intelligibility. Additionally this listener re-evaluated 10% of the speech samples to obtain a measure of intra-rater reliability. Another listener who evaluated the DFD and PIT was selected to evaluate 25% of the participants’ conversation and SIT tasks to obtain a measure of inter-rater reliability. Listeners orthographically transcribed the SIT and conversations based on the floor microphone recordings.
Sentence Intelligibility Test.The SIT listening task required the listener to orthographically transcribe each audio-recorded sentence that was spoken by the
participant during the SIT task in each of the three noise conditions (no noise, 65 dB and 75 dB). The words in the transcribed sentences were compared to the words in the
printed test sentences. An intelligibility score was obtained for one SIT (11 sentences) per noise condition. The number of correctly transcribed words on one SIT out of the total number of words spoken (110) was expressed as a percentage score for each participant under each of the three noise conditions.
speech. Thus two transcriptions (the reference and the tested) were obtained from every conversational speech sample in each of the three noise conditions for all participants. An overall intelligibility score for each subject was calculated by comparing the transcribed words from the headset microphone (reference transcription) to those from the floor microphone recordings (tested transcription). The following formula from Adams et al. (2008) will be used,
Intelligibility = # of floor mic words that match headset mic. words x 100 # headset mic. words
2.6 Speech Intensity
Speech intensity measures were obtained for each participant in each noise condition (no noise, 65 dB and 75 dB), on each test (DFD, PIT, SIT, conversation). The speech intensity values were measured using PRAAT software (version 5.2.14; Boersma & Weenink, 2011). Average speech intensity measures were obtained by averaging the speech intensity between the onset of voicing and the offset of voicing in each utterance. These average utterance values were then averaged within a condition in order to obtain an average speech intensity value for each condition for each participant. All speech intensity measures were based on the mouth microphone recordings that had been calibrated to a 70dB reference intensity signal that was 15cm from the participant’s mouth.
2.7 Measures and Analyses
participant group as the between groups factor with two levels (control, PD). The two within group factors included background noise (no noise, 65dB and for some tasks, 75dB) and type of intelligibility test (DFD, PIT, SIT and conversation).
In order to assess the secondary objective of this study investigating different testing procedures used for measuring speech intelligibility, a set of four separate two-way ANOVA’s were performed with the participant group (PD and control) as the between group factor and the background noise (no noise, 65dB and sometimes 75dB) as the within group factor. This analysis also examined the effects of the noise conditions in more detail and allowed for the inclusion of the 75dB condition (when available) in the analyses.
The third objective of this study investigated the phonetic errors associated with intelligibility deficits in background noise. This phonetic error analysis was examined during the no noise and 65dB background noise conditions using the DFD and PIT tests. To investigate phonetic errors on the DFD a descriptive error analysis was undertaken to investigate the types of errors made by each group. To investigate phonetic errors on the PIT a series of independent t-tests were conducted to compare the results of the PD and control participants on each of the phonetic contrasts in the 65 dB noise condition.
To assess the final objective of this study, the investigation of the impact of background noise on the speech intensity, average speech intensity measures were
Chapter 3
3
Results
3.1 Speech Intelligibility Results
Table 3. Overall Mean Intelligibility Scores (%)
DFD
Group NN 65 dB
Control
91.42 (8.43)
69.99 (19.34)
PD 87.14
(9.54)
48.08 (22.26)
Note. NN = no noise. Standard deviation scores appear in parentheses below the means.
Figure 2. Mean intelligibility scores (%)
3.2 Main Effects: Group, Noise Conditions and Test Type
The main effect for
illustrated in Figure 3 with associated means and standard error scores presented in Table
40 50 60 70 80 90 100 110
DFD nnDFD 65
In te ll ig ib il it y s c o re s ( % )
. Overall Mean Intelligibility Scores (%)
Intelligibility Tests
PIT SIT
65 dB NN 65 dB NN 65 dB
69.99 (19.34) 94.28 (4.1) 80.67 (11.17) 99.73 (.44) 89.73 (9.28) 97.08 (2.86) 48.08 (22.26) 89.68 (7.52) 69.29 (23.25) 93.55 (10.22) 59.46 (34.6) 93.07 (9.94)
. NN = no noise. Standard deviation scores appear in parentheses below the means.
. Mean intelligibility scores (%)
Main Effects: Group, Noise Conditions and Test Type
for group was significant, F(1,18) = 7.445, p =.014,
with associated means and standard error scores presented in Table
DFD 65 PIT nn PIT 65 SIT nn SIT 65 Convo nn
Convo 65
CONVO
NN 65 dB
97.08 (2.86) 85.45 (21.74) 93.07 (9.94) 58.07 (35.15)
. NN = no noise. Standard deviation scores appear in parentheses below the means.
Main Effects: Group, Noise Conditions and Test Type
=.014, and is
with associated means and standard error scores presented in Table
Control
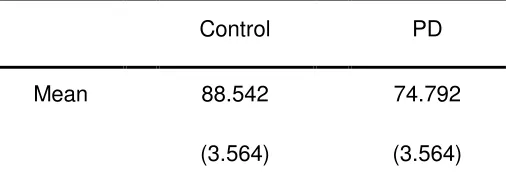
4. As illustrated in Figure 2 the results indicate that PD participants had lower intelligibility scores than control participants across all conditions of the study. The results related to the main effect of the noise conditions are shown in Figure 4. The descriptive statistics related to the noise conditions are provided in Table 5. The main effect of the noise condition factor was found to be significant, F(1, 18) = 41.877, p =.00. This indicates that speech intelligibility decreased significantly as the level of the
background noise increased. The results for the main effect of the type of test are shown in Figure 5 with associated means and standard error scores listed in Table 6. The main effect for the type of test was found to be significant, F(3, 54) = 4.809, p =.005. This result indicates that significantly different intelligibility scores were obtained for the different types of intelligibility tests. The DFD had the lowest mean intelligibility score and the SIT had the highest mean intelligibility score.
Table 4. Mean Intelligibility Scores (%) by Group
Control PD
Mean 88.542 74.792
(3.564) (3.564)
Figure 3
Table 5. Mean intelligibility
Mean
Note. Standard error scores appear in parentheses below
means.
65 70 75 80 85 90 95
In
te
ll
ig
ib
il
it
y
s
c
o
re
s
(
%
)
3. Mean intelligibility scores (%) by group
ntelligibility scores (%) in each noise condition
No Noise 65 dB
Mean
93.24 70.09
(1.0) (4.25)
Standard error scores appear in parentheses below .
Control PD
group
Figure 4. Mean
Table 6. Mean Intelligibility Scores (%) by Test
Mean
Note. Standard error means 60 65 70 75 80 85 90 95 100 In te ll ig ib il it y S c o re ( % )
ean intelligibility scores (%) in each noise condition
. Mean Intelligibility Scores (%) by Test
Intelligibility Test
DFD PIT SIT Convo
74.16 (3.31) 83.4 (2.56) 85.61 (3.49) 83.42 (3.7)
Note. Standard error scores appear in parentheses below
No Noise 65dB
intelligibility scores (%) in each noise condition
o
Figure
3.3 Interactions: Group, Noise Conditions and Test Type
The results for the noise by gro =.022. This indicates that the
different pattern in the PD
as the level of the background noise increased there was a relatively greater reduction in the intelligibility scores of the PD participants than the
Descriptive statistics can be found in Table 7
slope in the intelligibility versus background noise function for the PD participants relative to the control participants.
60 65 70 75 80 85 90 95 100 DFD In te ll ig ib il it y s c o re ( % )
Figure 5. Mean intelligibility scores (%) by test
Interactions: Group, Noise Conditions and Test Type
The results for the noise by group interaction was significant, F(1,18) = 6.303, . This indicates that the effect of the noise conditions on intelligibility showed a different pattern in the PD participants than it did in the controls. Figure 6
as the level of the background noise increased there was a relatively greater reduction in the intelligibility scores of the PD participants than there was in the control participants. Descriptive statistics can be found in Table 7. Thus, there appears to be a greater negative slope in the intelligibility versus background noise function for the PD participants relative to the control participants.
DFD PIT SIT
Interactions: Group, Noise Conditions and Test Type
F(1,18) = 6.303, p
noise conditions on intelligibility showed a 6 suggests that as the level of the background noise increased there was a relatively greater reduction in
control participants. ere appears to be a greater negative slope in the intelligibility versus background noise function for the PD participants
Table 7. Mean Speech Intelligibility Scores (%) Noise by Group Interac
Noise Condition
No Noise
65 dB
Note. Standard error scores appear in parentheses
Figure 6. Effect of background noise on
The results for the test by group i
=.456. This indicates that both PD and control participants had a similar response pattern across all tests. Figure 7 suggests that PD particip
scores relative to the control participants in both noise conditions regardless of the test condition. Descriptive statistics can be found in Table 8
30 40 50 60 70 80 90 100 110 No Noise In te ll ig ib il it y S co re s (% )
. Mean Speech Intelligibility Scores (%) Noise by Group Interac
Noise Condition Control PD
No Noise 91.42 (8.34) 87.14 (9.54)
65 dB 69.99 (29.31) 48.08 (22.26)
Standard error scores appear in parentheses next to means.
. Effect of background noise on intelligibility scores (%)
The results for the test by group interaction was not significant, F(3, 18) = .882, . This indicates that both PD and control participants had a similar response pattern
suggests that PD participants always had reduced intelligibility scores relative to the control participants in both noise conditions regardless of the test
Descriptive statistics can be found in Table 8. The PD participants had
No Noise 65 dB
PD
Control
. Mean Speech Intelligibility Scores (%) Noise by Group Interaction
48.08 (22.26)
means.
intelligibility scores (%)
F(3, 18) = .882, p
. This indicates that both PD and control participants had a similar response pattern ants always had reduced intelligibility scores relative to the control participants in both noise conditions regardless of the test
The PD participants had
significantly lower speech intelligibility scores on each test, however the pattern of change in speech intelligibility appears to be parallel across tests.
Table 8.Mean Speech Intelligibility (%) Test by Group Interaction
Intelligibility Test
DFD PIT SIT CONVO
Control 80.71 (4.29) 87.48 (3.63) 94.73 (4.94) 91.26 (4.77)
PD 67.61 (4.29) 79.48 (3.62) 76.5 (4.94) 78.64 (4.77)
Figure 7. Effect of test on intelligibility
The results for the test by noi
=.042. This indicates that the noise conditions had different effects four intelligibility tests. For example, Figure
to the 65 dB noise condition produced a greater reduction in the DFD test than it did on the other 3 intelligibility tests. found in Table 9.
Table 9. Intelligibility Scores (%) Test by Noise Interaction
Noise Condition DFD 60 65 70 75 80 85 90 95 100 105 DFD In te ll ig ib il it y S co re s (% )
. Effect of test on intelligibility scores (%)
The results for the test by noise interaction was significant, F(3, 54) = 2.919, . This indicates that the noise conditions had different effects on the
four intelligibility tests. For example, Figure 8 suggests that the change from the no noise dB noise condition produced a greater reduction in the intelligibility scores for the DFD test than it did on the other 3 intelligibility tests. Descriptive statistics can be
lity Scores (%) Test by Noise Interaction
Intelligibility Test
DFD PIT SIT CONVO
PIT SIT CONVO
F(3, 54) = 2.919, p
the results of the suggests that the change from the no noise
intelligibility scores for Descriptive statistics can be
CONVO
CONVO
control
No Noise 89.38 (8.99)
65 dB 59.03 (23.19)
Note. Standard deviation scores appear in parentheses beside means
Figure 8. Effect of background noise on
The three-way interaction involving the group, noise and te significant, F(3, 54) = 1.567,
3.4 Additional Analyses Involving the Extra 75 dB Noise
Condition
In order to examine the effects of the noise conditions in more detail and to allow for the inclusion of the 75dB condition (when avai
separate two-way ANOVA’s were performed. This included a separate two
40 50 60 70 80 90 100 110 DFD In te ll ig ib il it y S co re s (% )
89.38 (8.99) 91.98 (6.35) 96.64 (7.72) 95.08 (7.41)
59.03 (23.19) 74.98 (18.7) 74.59 (29.14) 71.56
Standard deviation scores appear in parentheses beside means
. Effect of background noise on intelligibility scores (%)
way interaction involving the group, noise and test factors was not F(3, 54) = 1.567, p =.208.
Additional Analyses Involving the Extra 75 dB Noise
In order to examine the effects of the noise conditions in more detail and to allow for the inclusion of the 75dB condition (when available) in the analyses, a set of four
way ANOVA’s were performed. This included a separate two
PIT SIT Convo
95.08 (7.41)
71.56 (31.72)
scores (%)
st factors was not
Additional Analyses Involving the Extra 75 dB Noise
In order to examine the effects of the noise conditions in more detail and to allow lable) in the analyses, a set of four way ANOVA’s were performed. This included a separate two-way
No noise
ANOVA for each intelligibility test. Detailed ANOVA results can be found in Appendix G.
Each two-way, repeated measures ANOVA included the participant group as the between group factor and the background noise as the within group factor. The group factor had two levels (PD and control) and the background noise factor had two or three levels (no noise, 65dB and sometimes 75dB). Two of the tests (DFD and PIT) were performed in two noise conditions (no noise and 65dB) and while the conversation task and SIT were performed in three noise conditions (no noise, 65dB and 75 dB). The results of the two-way ANOVAs for each test are presented in separate sections.
3.4.1 DFD
The DFD test investigated single word intelligibility of 21 non-sense words in two noise conditions (no noise, 65 dB). The descriptive statistics related to the DFD test are shown in Table 10. The results for the DFD test are summarized in Figure 9. The main effect of group was significant, F(1,18) = 4.648, p =.045. This significant main effect indicates that speech intelligibility scores were lower for the PD participants than the control participants. The main effect of noise was also significant, F(1,18) = 62.674, p
Thus, there appears to be a greater negative slope in the intelligibility versus background noise function for the PD pa
Table 10. DFD intelligibility scores
Noise condition
No Noise
65 dB
Note. Standard error scores appear means.
Figure 9. Effect of background noise on DFD intelligibility scores (%)
3.4.2 PIT
The PIT test investigated single word intelligibility o
words in two noise conditions (no noise, 65 dB). The descriptive statistics related to the PIT are to shown in Table
30 40 50 60 70 80 90 100 110 No Noise In te ll ig ib il it y S co re s (% )
Thus, there appears to be a greater negative slope in the intelligibility versus background noise function for the PD participants relative to the control participants.
. DFD intelligibility scores (%)
Noise condition Control PD
No Noise 91.42 (8.34) 87.14 (9.54)
65 dB 69.99 (19.32) 48.08 (22.26)
Standard error scores appear in parentheses next to
. Effect of background noise on DFD intelligibility scores (%)
The PIT test investigated single word intelligibility of 70 monosyllabic English words in two noise conditions (no noise, 65 dB). The descriptive statistics related to the PIT are to shown in Table 11. The results for the PIT are summarized in Figure
No Noise 65 dB
PD
Control
Thus, there appears to be a greater negative slope in the intelligibility versus background rticipants relative to the control participants.
87.14 (9.54)
48.08 (22.26)
. Effect of background noise on DFD intelligibility scores (%)
70 monosyllabic English words in two noise conditions (no noise, 65 dB). The descriptive statistics related to the
. The results for the PIT are summarized in Figure 10. The
main effect of group was not significant, F(1,18)=2.43, p =.136. This non-significant main effect indicates that intelligibility scores for the PD participants are not significantly lower than control participants on the PIT. The main effect of noise was significant F(1,18) = 27.148, p = .000. This indicates that the introduction of 65 dB background noise resulted in a reduction in the PIT intelligibility scores. The interaction between noise condition and group on the PIT was not significant, F(1,18) = 1.079, p = .313. This finding indicates that the effect of the background noise conditions produced a similar pattern of effects on intelligibility in the PD and control participants. Overall, these results suggest that the PIT may not be highly sensitive to the effects of 65dB multi-talker background noise on hypophonia.
Table 11. PIT Intelligibility Scores (%)
Noise condition Control PD
No Noise 94.28 (4.1) 89.68 (7.52)
65 dB 80.67 (11.17) 69.29 (23.25)
Figure 10. Effect of background noise on
3.4.3 SIT
The SIT investigated
sentences ranging in length from 5 to 15 words in three noise conditions (no noi 75 dB). The descriptive statistics related to the SIT are shown in Table
the SIT are summarized in Figure 1
12.102, p =.003. This significant main effect indicates that sp
were lower for PD participants than control participants. The main effect of noise also significant, F(2,36) = 57.263,
especially of 75 dB of background noise resulted
scores. The interaction between noise condition and group
F(2,36)=6.98 p=.003. This finding indicates that there was a different pattern in the effects of background noise on the PD and contro
appears that as the level of the background noise increased
there was a relatively greater reduction in the intelligibility scores of the PD participants
60 65 70 75 80 85 90 95 100 105 In te ll ig ib il it y S co re s (% )
Effect of background noise on PIT intelligibility scores
The SIT investigated the sentence intelligibility of 11 computer-generated sentences ranging in length from 5 to 15 words in three noise conditions (no noi 75 dB). The descriptive statistics related to the SIT are shown in Table 12 the SIT are summarized in Figure 11. The main effect of group was significant,
. This significant main effect indicates that speech intelligibility scores were lower for PD participants than control participants. The main effect of noise
F(2,36) = 57.263, p = .000. This indicates that introduction of 65dB and especially of 75 dB of background noise resulted in a reduction in the SIT intelligibility scores. The interaction between noise condition and group was also significant,
. This finding indicates that there was a different pattern in the effects of background noise on the PD and control participants. More specifically,
as the level of the background noise increased, from none to 65db and 75dB, there was a relatively greater reduction in the intelligibility scores of the PD participants
No Noise 65 dB
PD
control
PIT intelligibility scores (%)
generated
sentences ranging in length from 5 to 15 words in three noise conditions (no noise, 65 dB, 12. The results for ffect of group was significant, F(1,18) =
eech intelligibility scores were lower for PD participants than control participants. The main effect of noise was
. This indicates that introduction of 65dB and in a reduction in the SIT intelligibility
was also significant, . This finding indicates that there was a different pattern in the
l participants. More specifically, it , from none to 65db and 75dB, there was a relatively greater reduction in the intelligibility scores of the PD participants
PD
than there was in the control parti
slope in the intelligibility versus background noise function for the PD participants relative to the control participants.
Table 12. SIT Intelligibility Scores (%)
Noise Condit
No Noise
65 dB
75 dB
Note. Standard error scores appear in parentheses next to means
Figure 11. Effect of background 0 20 40 60 80 100 No Noise In te ll ig ib il it y S co re s (% )
control participants. Thus, there appears to be a greater negative slope in the intelligibility versus background noise function for the PD participants relative to the control participants.
. SIT Intelligibility Scores (%)
Noise Condition Control PD
No Noise 99.73 (.44) 93.55 (10.22)
65 dB 89.73 (9.28) 59.46 (34.6)
75 dB 63.46 (28.06) 19.99 (25.5) Standard error scores appear in parentheses next to means
. Effect of background noise on SIT intelligibility scores (%)
No Noise 65 dB 75 dB
cipants. Thus, there appears to be a greater negative slope in the intelligibility versus background noise function for the PD participants
93.55 (10.22)
59.46 (34.6)
19.99 (25.5) Standard error scores appear in parentheses next to means
noise on SIT intelligibility scores (%) PD
3.4.4 Conversation
The conversational intelligibility test investigated speech intelligibility in a conversational context. An average of 130 words of consecutive conversational speech obtained in three noise conditions (no noise, 65 dB, 75 dB) was used to obtain the intelligibility scores for each participant. The descriptive statistics related to these conversational intelligibility tests are shown in Table 13. The results for the
conversational intelligibility test are summarized in Figure 12. The main effect of group was significant, F(1,17) = 5.564, p = .031. This significant main effect indicates that speech intelligibility scores were lower for PD participants than in control participants. The main effect of noise was also significant, F(2,34) = 36.243, p=.000. This indicates that the introduction of 65dB and especially of 75 dB background noise resulted in a reduction in the conversation intelligibility scores. The interaction between noise
conditions and group was also significant, F(2,34) = 4.568, p=.017. This finding indicates that there was a different pattern in the effects of the background noise on the PD and control participants. Specifically, it appears that as the level of the background noise increased, from none, to 65db and 75dB, there was a relatively greater reduction in the conversational intelligibility scores of the PD participants than there was in the control participants. Thus, there appears to be a greater negative slope in the conversational intelligibility versus background noise function for the PD participants relative to the control participants.
Table 13. Conversation Task Intelligibility Scores (%)
No Noise
65 dB
75 dB
Note. Standard deviation appears in parentheses next to means
Figure 12. Effect of background noise on the Conversation intelligib scores (%)
3.5 Reliability
To determine reliability of intelligibility measures, a portion of the data was re analyzed by the same listener and a portion of the data was reanalyzed by a second listener. For the PIT and DFD tests, each listener reanalyzed 25% o
they originally judged, and 25% of another participant’s data. For the Conversation task and the SIT, 10% of the data was reanalyzed by the original listener and 25% of the data was analyzed by a second listener. A bivariate correl
0 20 40 60 80 100 120 No Noise
97.08 (2.86) 92.75 (10.49)
85.45 (21.74) 64.51 (30.35)
68.03 (22.35) 31.63 (35.94) Standard deviation appears in parentheses next to means
. Effect of background noise on the Conversation intelligib
To determine reliability of intelligibility measures, a portion of the data was re analyzed by the same listener and a portion of the data was reanalyzed by a second listener. For the PIT and DFD tests, each listener reanalyzed 25% of the participant’s data they originally judged, and 25% of another participant’s data. For the Conversation task and the SIT, 10% of the data was reanalyzed by the original listener and 25% of the data was analyzed by a second listener. A bivariate correlation analysis revealed high
65 dB 75 dB
PD
Control
92.75 (10.49)
64.51 (30.35)
31.63 (35.94)
. Effect of background noise on the Conversation intelligibility
To determine reliability of intelligibility measures, a portion of the data was re-analyzed by the same listener and a portion of the data was rere-analyzed by a second
f the participant’s data they originally judged, and 25% of another participant’s data. For the Conversation task and the SIT, 10% of the data was reanalyzed by the original listener and 25% of the data
ation analysis revealed high
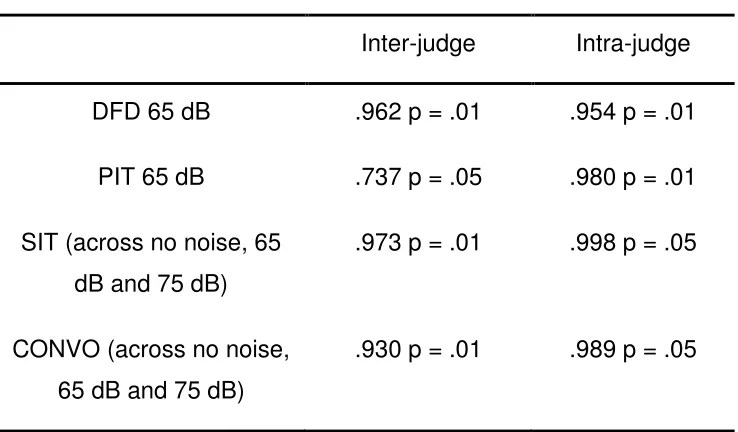
intrajudge reliability for measurement of speech intelligibility ranging from .954 - .998 and high interjudge reliability ranging from .737 - .973. Table 14 summarizes the results of the correlation analyses used to obtain inter-judge and intra-judge estimates of
reliability. These correlation coefficients demonstrate overall good reliability between and within judges for speech intelligibility.
Table 14. Inter and Intra-Judge Reliability
Pearson Correlation Coefficients
Inter-judge Intra-judge
DFD 65 dB .962 p = .01 .954 p = .01
PIT 65 dB .737 p = .05 .980 p = .01
SIT (across no noise, 65 dB and 75 dB)
.973 p = .01 .998 p = .05
CONVO (across no noise, 65 dB and 75 dB)
.930 p = .01 .989 p = .05
3.6 Phonetic Error Analysis
A secondary objective of this study was to investigate the phonetic errors