Artificial Neural Network based Automatic
Traffic Regulation System
Mrs.V.Gandhimathi
1, Mrs.P.Sujatha
2Associate Professor, Dept. of ECE, VRSCET, Villupuram District, Tamilnadu, India1
Associate Professor, Dept. of ECE, VRSCET, Villupuram District, Tamilnadu, India2
ABSTRACT: The main goal of Traffic Sign Detection and categorization is to regulate traffic signs, warn a driver, and command or prohibit certain actions. Automatic recognition of traffic signs is also important for an automated intelligent driving vehicle or for driver assistance systems. Traffic signs or road signs are signs erected at the side of or above roads to give instructions or provide information to road users. There are many more other types of traffic signs such as special regulation signs, signs for direction and position, welcome sign etc. This paper aims to present a color segmentation approach for traffic sign recognition based on LVQ neural network and also focuses on triangular edge detection and feature extraction based on Hough transformation and HOG respectively. Individual text characters are detected as MSERs and are grouped into lines, before being interpreted using optical character recognition. Recognition accuracy is vastly improved through the temporal fusion of text results across consecutive frames. Additionally we using ultrasonic sensor to regulate the speed of vehicle if, two vehicles runs closely each other
KEYWORDS: LVQ, MSER, HOG, SVM, Ultrasonic Sensor.
I. INTRODUCTION
The automatic detection and recognition of traffic signs is a challenging problem, with a number of important application areas, including advanced driver assistance systems, road surveying, and autonomous vehicles. While much research exists on both the automatic detection and recognition of symbol-based traffic signs, this could be partly due to the difficulty of the task caused by problems, such as illumination and shadows, blurring, occlusion, and sign deterioration. Without the use of additional temporal or contextual information, there is few information to determine traffic signs from non traffic signs on the fly, while driving, other than basic features, such as shape or color. On this basis, the number of false positives (FPs) likely to occur in a cluttered image, such as a road scene, is high. This is demonstrated in the example , where although the traffic sign present in both images is successfully detected, more FPs are detected by the system (in the top scene) when additional structural and temporal information is not deployed. We approach this problem by detecting large numbers of text-based traffic sign candidates using basic shape and color information. This over detection is important to ensure that no true positives (TPs) are missed. We then reduce the large number of detected candidate regions by making use of the structure of the scene, as well as its temporal information, to eliminate unlikely candidates. The proposed system comprises two main stages: detection and recognition. The detection stage exploits knowledge of the structure of the scene, i.e., the size and location of the road in the frame, to determine the regions in the scene that it should search for traffic text signs. These regions are defined once the vanishing point (VP) of the scene and, hence, the ground plane are determined. Potential candidate regions for traffic signs are then located only within these scene search regions, using a combination of MSERs and hue, saturation, and value (HSV) color thresholding. By matching these regions through consecutive frames, temporal information is used to further eliminate FP detected regions, based on the motion of regions with respect to the camera and the structure of the scene.
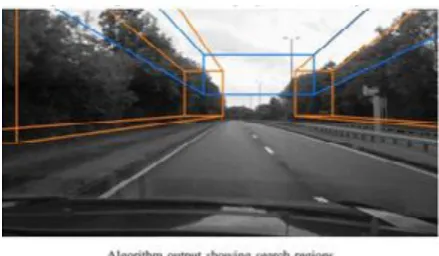
Without the use of additional temporal or contextual in- formation, there is few information to determine traffic signs from nontraffic signs on the fly, while driving, other than basic features, such as shape or color. On this basis, the number of false positives (FPs) likely to occur in a cluttered image, such as a road scene, is high. This is demonstrated in the example in Fig. 1, where although the traffic sign present in both images is successfully detected, more FPs are detected by the system (in the top scene) when additional structural and temporal information is not deployed.
We approach this problem by detecting large numbers of text-based traffic sign candidates using basic shape and color information. This overdetection is important to ensure that no true positives (TPs) are missed. We then reduce the large number of detected candidate regions by making use of the structure of the scene, as well as its temporal information, to eliminate unlikely candidates.
III. PROPOSED SYSTEM
The proposed system comprises two main stages: detection and recognition. The detection stage exploits knowledge of the structure of the scene, i.e., the size and location of the road in the frame, to determine the regions in the scene that it should search for traffic text signs. These regions are defined once the vanishing point (VP) of the scene and, hence, the ground plane are determined.
Potential candidate regions for traffic signs are then located only within these scene search regions, using a combination of MSERs and hue, saturation, and value (HSV) color thresh- olding. By matching these regions through consecutive frames, temporal information is used to further eliminate FP detected regions, based on the motion of regions with respect to the camera and the structure of the scene.
Figure. 1. System output showing detection of traffic signs (left) without and (right) with the use of structural and temporal information
Fig. 2. Pipeline for detection and recognition stages of the proposed approach.
IV. DETECTION OF TEXT-BASED TRAFFIC SI GNS
The first stage of the proposed system detects candidates for text-based traffic signs. This consists of three phases: de- termination of search regions (regions of interest where the text sign is expected to be found), detection of all possible candidates within these regions, and reduction of candidates using contextual constraints. Search regions of interest for traffic signs are found within the image, by first locating the sides of the road in the image and then defining 3-D search boxes, which are projected back onto the original 2-D frame.
A. Finding Sides of Road and VP
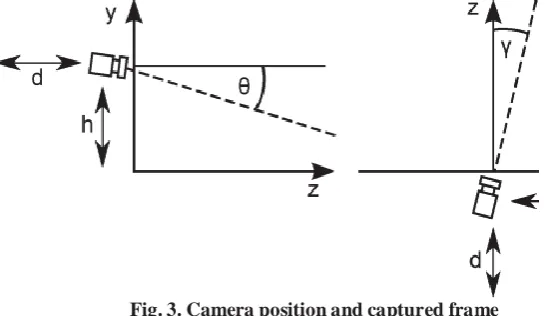
In order to determine search regions for traffic signs in each frame, the sides of the road and the road VP must be detected. Our approach to VP detection is traditional and popularly used in other works. First, the Canny edge detector is used to detect edges in the image, which is followed by the Hough transform to locate straight lines. The total number of Hough lines is then reduced by eliminating lines that are too short, that do not approximately pass through the center of the frame, or (for the purposes of our application) that appear near the top of the image; an example frame is shown in Fig.3
Fig. 3. Camera position and captured frame
Fig.4. Output of various stages of algorithm to define search regions.
The set of IPM Hough lines are then further reduced by eliminating lines that are not approximately vertical and lines that are below a certain length. This set of lines is then divided into two groups, for the left- and right- hand sides of the image. The mean of all lines, weighted by line length, is then calculated for each side of the image. These average lines are taken as approximations of the sides of the road. Estimates for the VP and sides of the road are detected in every frame, and they are then tracked throughout subsequent frames using the Kalman filter.
B. Defining Search Regions within the Original Frame
Once the sides of the road are detected, the size and location of the search regions can be defined. Three search regions are used, i.e., one to the left-hand side of the road, one to the right, and one above. The dimensions of these regions are determined empirically through analysis of the validation data set and kept constant throughout our experiments. The top search region is defined to be the width of the road, given that overhead gantries, which appear in this region, never extend beyond the sides of the road. Therefore, the width of this region is determined dynamically based on the detected positions for the sides of the road. The dimensions and height of the roadside regions are fixed, but their horizontal positions change dynamically to position them by either side of the road.
The real-world dimensions of these regions can be roughly estimated, by assuming that the distance between the overhead gantry and the ground is approximately 5.1 m, i.e., the mini- mum legal unmarked gantry height in the U.K., and using this as a reference. These dimensions are stated in Table 1.
TABLE 1
V. EXPERIMENTAL RESULTS
The proposed method currently runs at an average frame rate of 14 frames/s, under Open Source computer Vision OpenCV), on a 3.33-GHz Intel Core i5 CPU. A considerable existing algorithm. These were the methods
proposed by Reina et al. and González et al. Since both methods were designed to recognize Spanish road signs,
which are blue and white, it was necessary to adapt the algorithms to detect U.K. road signs, which also feature
green and brown backgrounds. The method of González et al. detected blue road signs as MSERs in the blue channel
of a normalized red, green, and blue (RGB) image. Therefore, to extend this to green road signs, MSERs were also detected in the green channel. Brown road signs were detected as dark-on-light MSERs in a grayscale frame. The
method of Reina et al. uses hue, saturation, and intensity (HSI) thresholding to find candidate blobs for blue road
signs. Therefore, additional thresholds were added to their method for the detection of brown and green road signs. These algorithms were optimized using the same validation data set used to develop our proposed method.
These data comprised nine video sequences, with a total of 23 130 frames, at a resolu×tion of 1920 1088 pixels. The ground truth for d e t e c t i o n was based on human observation; therefore, distant or heavily blurred traffic signs, which were unreadable by the eye, were ignored. The data set used for testing was entirely separate from the validation set used for the development and parameter tuning of the proposed and implemented systems. Regions were determined to be candidate traffic signs, if detected for at least five subsequent frames. The results of this comparison are shown in Table.2
TABLE 2
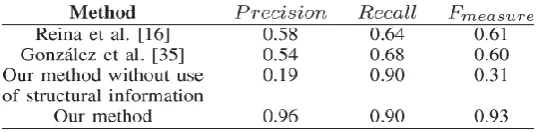
RESUL TS OF COMPAR ATIVE ANALYSIS FOR THE DE TEC TION STAGE
It can be seen from these results that the proposed method achieves an Fmeasure of 0.93, whereas Reina et al.
and González et al. reach the considerably lower values of 0.61 and 0.60, respectively. The use of geometrical,
contextual, and temporal information in our system allows the total number of FPs to be reduced, thus
increasing its precision and Fmeasure.Also included in Table 2 are results for our text-based traffic sign
detection method without the use of structural information.
As expected, the resulting increase in FPs causes a huge reduc- tion in precision, whereas the recall stays the same. In addition to reduced precision, the computational expense means that the frame rate drops from 14 frames/s to 6 frames/s. This is due to both the increased search area for candidate traffic signs and the slow down created by the increased number of detected FPs that it is necessary to process.
TABLE III
perspective correction method described in Section IV-A, OCR after application of our temporal fusion method described in Section IV-D, and then against OCR after the application of both perspective correction and the temporal fusion method. The results are presented in Table III and show that use of our perspective recovery and temporal fusing methods vastly improve the recognition accuracy. It can be seen that temporal fusing improves the precision but not the recall; this is due to the rejection of low-confidence words by the system. The total system performance, i.e., for both detection and recognition stages, based on the number of individual words recognized in
all traffic signs, in all video sequences, gave a precision value of 0.97, a recall value of 0.80, and an Fmeasure
value of 0.87.
IV.CONCLUSION
A novel system for the automatic detection and recognition of text in traffic signs based on MSERs, LVQ
and HSV thresholding has been proposed. The search area for traffic signs was reduced.
REFERENCES
1. S. Maldonado-Bascón, S. Lafuente-Arroyo, P. Gil-Jimenez, H. Gomez- Moreno, and F. Lopez-Ferreras, “Road-sign detection and recognition based on support vector machines,” IEEE Trans. Intell. Transp. Syst., vol. 8, no. 2, pp. 264–278, Jun. 2007.
2. F. Zaklouta and B. Stanciulescu, “Real-time traffic-sign recognition using tree classifiers,” IEEE Trans. Intell. Transp. Syst., vol. 13, no. 4, pp. 1507– 1514, Dec. 2012.
3. J. Greenhalgh and M. Mirmehdi, “Traffic sign recognition is using MSER and random forests,” in Proc. EUSIPCO, Aug. 2012, pp. 1935–1939.
4. J. Greenhalgh and M. Mirmehdi, “Real-time detection and recognition of road traffic signs,” IEEE Trans. Intell. Transp. Syst., vol. 13, no. 4, pp. 1498–1506, Dec. 2012.
5. A. Møgelmose, M. M. Trivedi, and T. B. Moeslund, “Vision-based traffic sign detection and analysis for intelligent driver assistance systems: Per- spectives and survey,” IEEE Trans. Intell. Transp. Syst., vol. 13, no. 4, pp. 1484–1497, Dec. 2012.
6. M. A. García-Garrido et al., “Complete vision-based traffic sign recogni- tion supported by an I2V communication system,” Sensors, vol. 12, no. 2, pp. 1148–1169, Jan. 2012.
7. P. Clark and M. Mirmehdi, “Recognising text in real scenes,” Int. J. Document Anal. Recog., vol. 4, no. 4, pp. 243–257, Jul. 2002. 8. C. Merino and M. Mirmehdi, “A framework towards real-timedetection and tracking of text,” in Proc. CBDAR, 2007, pp. 10–17.
9. S. Hanif and L. Prevost, “Text detection and localization in complex scene images using constrained AdaBoost algorithm,” in Proc. ICDAR, Jul. 2009, pp. 1–5.
10. L. Neumann and J. Matas, “A method for text localization and recognition in real-world images,” in Proc. ACCV, 2010, pp. 9–11.
11. B. Epshtein, E. Ofek, and Y. Wexler, “Detecting text in natural sceneswith stroke width transform,” in Proc. CVPR, 2010, pp. 2963–2970. [12] J.-J. Lee, P.-H. Lee, S.-W. Lee, A. Yuille, and C. Koch, “AdaBoost fortext detection in natural scene,” in Proc. ICDAR, Sep. 2011, pp. 429– 434. 12. C. Yi and Y. Tian, “Text string detection from natural scenes by structure- based partition and grouping,” IEEE Trans. Image Process., vol. 20,
no. 9, pp. 2594–2605, Sep. 2011.
13. J. Zhang and R. Kasturi, “Character energy and link energy-basedtext extraction in scene images,” in Proc. ACCV, 2010, no. 2, pp. 308– 320, Springer.
14. W. Wu, X. Chen, and J. Yang, “Detection of text on road signs from video,” IEEE Trans. Intell. Transp. Syst., vol. 6, no. 4, pp. 378–390, Dec. 2005.
15. A. Reina, R. Sastre, S. Arroyo, and P. Jiménez, “Adaptive traffic roadsign panels text extraction,” in Proc. WSEAS ICSPRA, 2006, pp. 295– 300. 16. A.González, L. Bergasa, a n d J . Yebes, “ Text d e t e c t i o n a n d r e c o g n i t i o n on traffic panels from street-level imagery using visual
appearance,” IEEE Trans. Intell. Transp. Syst., vol. 15, no. 1, pp. 228–238, Feb. 2014.
17. X. Chen, J. Yang, J. Zhang, and A. Waibel, “Automatic detection and recognition of signs from natural scenes,” Trans. Image Process., vol. 13, no. 1, pp. 87–99, Jan. 2004.
18. J. Shi and C. Tomasi, “Good features to track,” in Proc. CVPR, 1994, pp. 593–600.