The case for predictable media quality in networked multimedia
applications
Anna Bouch
*, M. Angela Sasse
Dept. of Computer Science, University College London, Gower Street, London, WC1E 6BT UK
*Correspondence: Email: [email protected]; www.cs.ucl.ac.uk/staff/A.Bouch; Telephone: +44 (0)20 7679 1371
ABSTRACT
Shared networks are now able to support a wide range of applications, including real-time multimedia. This has led the networking community to consider a wider range of network Quality of Service (QoS) guarantees and pricing schemes. To date, the QoS required by networked multimedia applications has been described in terms of technical parameters. We argue that, in order to maximize the realized quality of any network, the QoS requirements of networked multimedia applications should be based on the value that users ascribe to the media quality they receive in the context of a particular task. This argument is supported with results from a set of studies in which users’ perceptions of media quality was investigated for a listening task. We found that users’ expectancies of quality directly influenced their ratings: low expectancies produce higher ratings for the same level of objective quality - provided that quality is predictable. In conclusion, we outline the implications of our studies for the design of networked multimedia applications and the network services that support them.
Keywords:Networked multimedia, Quality of Service, audio quality, quality assessment, predictability
1.
INTRODUCTION
Shared networks, such as the Internet, can now support many applications, ranging from data-driven applications (such as email) to real-time applications (such as multimedia conferencing). In the networking community, different technical Quality of Service (QoS) requirements have been ascribed to these applications: real-time multimedia is an example of an inelastic application, requiring a relatively rich set of performance guarantees. Elastic applications, on the other hand, are less dependent on the speed at which data is delivered1.
The increase of demanding real-time traffic may seriously threaten the ability of the ‘best-effort’ service of the Internet to deliver acceptable levels of QoS to many users2. To tackle this problem, it has been suggested that traffic produced from different applications can be characterized through an associated payment2,3,4. For example, high-volume video may be sent as priority traffic by associating it with a high-priced stream. Users could thus indicate the importance of their interaction by indicating their willingness to pay for certain levels of QoS. The value that users associate with a certain level of quality can therefore be used to partition network resources. The levels of quality supported by wide area networks are currently relatively variable5, and advocates of dynamic (as opposed to flat-fee) pricing have argued that users should be able to indicate their QoS preferences according to current network conditions6,7. Such schemeswould allow users to judge the utility of QoS received in a dynamic fashion. For example, if the user is involved in a video conference with business partners, the utility of received QoS is probably high. If the network is congested, he can choose to increase the levels of quality received, for that task, at that particular time
.
Two assumptions underpin such pricing schemes:
(1) That the amount and type of quality implementable within the network is identical to the quality required by the user. Previous research has shown that quality is described by users according to a variety of dimensions8. The salience of these dimensions is determined, not by the fact that they are technically implementable, but by their semantic value to users9. In networked multimedia applications in particular, variations in quality at the network level are not directly linked to the subjective assessment of quality received by the user10. Users judge the QoS received in terms of the media quality they require, and the level of media quality required may vary within the same application, depending on the task11.
number of factors intervene in users’ decisions to pay for the QoS they receive. If the QoS received is predictable, users develop confidence that the QoS they will receive will concur with theirexpectancies
. Users’ confidence
was shown to encourage their acceptance of QoS and the pricing mechanisms that enable the selection of this quality.2.
THE IMPORTANCE OF PREDICTABILITY
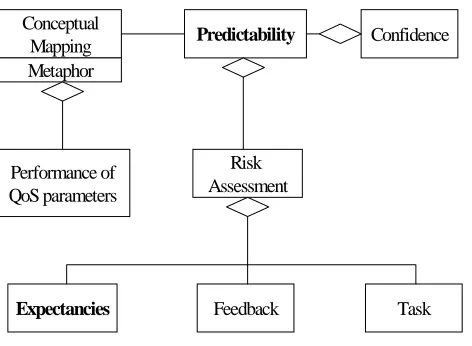
Previous research has established users’ attitudes to Internet QoS and pricing8. The results from these studies yielded a set of models that describe the relationship between the concepts that users draw on when assessing the QoS of networked applications. Figure 1 shows a summary version of the model applicable to users with limited experience of network use.
The model presented in Figure 1 states that:
• Quality received must be predictable in order for users to
gain confidence in actions such as the sanctioning of dynamic payment.
• Users assess how predictable QoS might be, against their
expectancies.
• Users assess the predictability of a system by comparing
the quality received to the quality expected.
• Predictability mediates between the performance of
technical QoS parameters (such as audio packet loss) and users’ level of confidence. This means that the predictability of quality received is likely to effect the extent to which a task can be performed efficiently.
This paper reports a survey and set of experimental studies that are part of a longer-term effort to test the applicability of these concepts to networked multimedia applications. The aim of this particular study was to explore the influence of users’
expectancies of media quality on their subsequent perception of the media quality presented to them. A second,
complementary, aim of the studies was to validate the central role of the concept of predictability in users’ perception of media quality. We have chosen to focus on assessment of audio quality, as this is regarded as the critical factor for user acceptance of multimedia conferencing applications10. The paper begins with a description of the methods used to obtain data; sections 4 and 5 provide a detailed account of the results obtained. We conclude that, although further work is needed to confirm the importance of predictable quality for other media and tasks, predictability seems to be an important determinant for the acceptability of networked multimedia applications and the network services that support them.
3.
EXPERIMENTAL METHOD
3.1.Participants
Twenty-four participants took part in both the survey and experimental parts of the study. They had no previous experience with real-time audio applications, and had limited knowledge of networking.
3.2.Tools
Different loss patterns were generated on audio files, each particular level of loss being stable for 17 seconds. This time interval was chosen so that the experiment could address a range of loss rates whilst avoiding participants becoming over-familiarized with any particular rate. The samples were recorded using the Sun Audio Tool, using linear 16 mono 8kHz and saved as .au files. The .au headers were stripped with Sun audioconvert and played out on a SGI INDY running IRIX 6.2. Participants were able to control the volume of the audio via the Robust Audio Tool, rat12.
To date, most studies on users’ perception of audio quality have relied on a single assessment taken after users have performed a real-time task. However, when using this method it is difficult to assess to which part of the audio passage users
are referring when expressing their opinions13,14. To reflect users’ opinions of dynamically changeable media quality
Confidence
Predictability
Conceptual Mapping Metaphor
Performance of QoS parameters
Expectancies Feedback Task Risk
Assessment
10 15
10 20
25 20
30
1 2 3 4 5 6 7
Rating Interval
L
oss Valu
e
Figure 2: QUASS interface
Figure 5: Objective loss rates: Condition 4
accurately, it is necessary to gather quality ratings in a continuous fashion. A recording slider, the QUality ASsessment Slider, QUASS, was developed for this purpose15. Figure 2 shows this tool.
3.3.Procedure
An adapted version of the SERVQUAL analysis16 was administered to see if there was any difference between participants’ expectancies of the audio quality they were to receive. This form of analysis, applied successfully in many market research contexts, requires respondents to rate their expectancies of future quality, using an interval scale. The level of expectancy indicated in the SERVQUAL analysis can be compared to the ratings provided for audio quality received during the experiment. The SERVQUAL questionnaire contained questions about different QoS parameters. The definition and relevance of these parameters had been previously established8. To ensure that participants were assessing similar aspects of the audio quality they received, part of the initial SERVQUAL questionnaire asked participants to identify the QoS dimensions they considered important when assessing audio quality.
Participants were told that the experiment was designed to establish when audio quality becomes unacceptable. All participants heard 4 passages of speech of 2 minutes each, in 4 corresponding conditions. Participants were asked to use
QUASS (Figure 2) to continuously assess the variable objective quality they
received. The pattern of audio packet loss generated on these narratives is shown in Figures 3 - 5. In each case, ‘Rating Interval’ refers to the 17-second time intervals during which the loss rate remained stable.
4.
THE EFFECT OF EXPECTANCY ON AUDIO
QUALITY ASSESSMENT
A strong correlation was found between ratings for expectancies obtained from the SERVQUAL questionnaire and dynamic ratings obtained during the experiment*. Similar trends were identified for each condition in the experiment. This phenomenon, however, was observed only for the first 3 and, in a limited number of cases, the first 4 rating intervals during the experiment. Dynamic ratings obtained for the remaining intervals were of a similar magnitude regardless of the ratings obtained for expectancy.
Results indicate that, when participants expect a low level of audio quality, subsequent ratings are comparatively high; similarly, when participants expect a high level of audio quality, subsequent ratings are comparatively low. This trend is
0 5
10 15
10
5
0
1 2 3 4 5 6 7
Rating Interval
L
oss Valu
e
0 5
0 10
15
10 20
1 2 3 4 5 6 7
Rating Interval
L
oss Valu
e
0 20 40 60 80 100 120
1 2 3 4 5 6 7 8 9 10 11 12
R ating Interval
S
ubjective QoS Ratin
g
Low E xpec tanc y H igh E xpec tanc y
Figure 6: Dynamic QoS Ratings by Expectancy: A
illustrated in Figure 6 and Figure 7, which compare the scores obtained for individual participants whose expectancy ratings differed in the SERVQUAL analysis.
These results show that participants base their dynamic assessment of audio quality on an assessment of future quality. The evolving nature of this assessment is shown in the fact that the correlation between initial expectancies and dynamic ratings becoming statistically insignificant as the experiment progresses. This indicates that participants alter their expectancies based on the pattern of loss received during their interaction with the system. How accurate users’ expectancies may turn out to be depends on the extent to which the audio quality received is predictable at the time when such expectancies were formed.
Results from the SERVQUAL analysis therefore verify the central influence of users’ preformed expectancies concerning QoS, and the role of this anticipation on the perception and assessment of the audio quality received. These results have been obtained by analysing the magnitude of subjective ratings given during the experiment. However, in order to investigate the impact of predictability upon users’ assessment of media quality, it is necessary to investigate the dynamic variation of ratings for subjective audio quality in more detail. This requires analysing the pattern - in addition to the magnitude - of ratings given during the experiment.
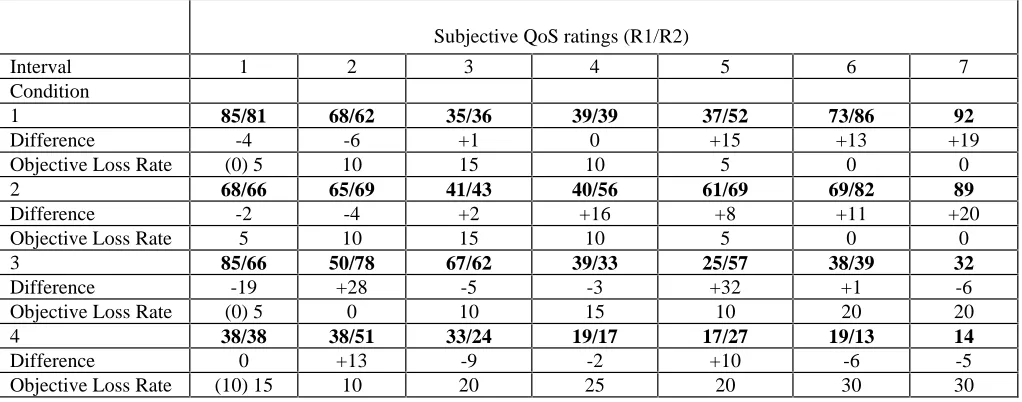
Table 1: Average Subjective QoS Ratings
Subjective QoS ratings (R1/R2)
Interval 1 2 3 4 5 6 7
Condition
1 85/81 68/62 35/36 39/39 37/52 73/86 92
Difference -4 -6 +1 0 +15 +13 +19
Objective Loss Rate (0) 5 10 15 10 5 0 0
2 68/66 65/69 41/43 40/56 61/69 69/82 89
Difference -2 -4 +2 +16 +8 +11 +20
Objective Loss Rate 5 10 15 10 5 0 0
3 85/66 50/78 67/62 39/33 25/57 38/39 32
Difference -19 +28 -5 -3 +32 +1 -6
Objective Loss Rate (0) 5 0 10 15 10 20 20
4 38/38 38/51 33/24 19/17 17/27 19/13 14
Difference 0 +13 -9 -2 +10 -6 -5
Objective Loss Rate (10) 15 10 20 25 20 30 30
0 20 40 60 80 100 120
1 2 3 4 5 6 7 8 9 10 11 12
S
ubjective QoS Ratin
g
Low Expectancy High Expectancy
Rating Interval
5.
THE PREDICTABILITY EFFECT
In order to examine the role of predictability in users’ audio quality assessment, two figures were extracted from the subjective ratings, for each interval of audio.
It is hypothesized that, if predictability is an important determinant of users’ subjective assessment, such ratings should rise during the time when the objective loss rate remain stable. Indeed, such a result would suggest that predictability is a more salient determinant of perceived quality than the absolute objective loss rate received. The first figure (R1) extracted from the ratings provided by each participant corresponds to a 7 second time lapse after an objective change in the amount of loss received. This interval was provided because an examination of overall ratings showed that all participants registered and reacted to an objective change in quality by this time. The second figure (R2) extracted from the ratings of subjective QoS provided by each participant corresponded to the second before a change in objective loss occurred. During the period between the two measurements the objective loss remained stable. The data was therefore analyzed in R1/R2 pairs. The final rating given by participants during the experiment was also recorded. The timing of this rating varied between participants (depending on the exact time when the experiment was terminated), but invariably represented a situation where the objective loss rate had been stable for at least thirty seconds.
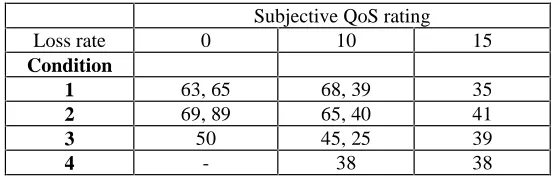
Table 1 shows the average subjective quality ratings obtained from each condition. The objective loss rate is shown in order that a comparison can be made between objective and subjective scores. With the exception of the final score, the subjective ratings are presented in R1/R2 pairings. In considering the predictability of loss rates, it was important to acknowledge the wider trend of loss received by participants. The initial value of objective loss is therefore presented in the first column. Table 1 shows that, within each condition, the average subjective ratings given by participants correlate with the objective loss received at any one time. However, perhaps the most important finding is that the overall pattern of loss throughout a passage has more influence on participants’ subjective quality ratings than the absolute amount of objective loss. This is shown by the fact that a subjective quality rating given for a high objective loss rate can be higher than a rating given for a comparatively low objective loss rate. Table 2 illustrates average subjective quality ratings, for various objective loss rates, amongst conditions. This figure illustrates that widely different ratings are given for identical loss rates. The scores correspond to participants’ initial responses to changes in objective loss (R1).
Table 2: Subjective QoS
Subjective QoS rating
Loss rate 0 10 15
Condition
1 63, 65 68, 39 35
2 69, 89 65, 40 41
3 50 45, 25 39
4 - 38 38
These results show that subjective quality ratings given at any one time are relative to the overall pattern of loss received for preceding intervals. It could be argued that positioning the QUASS slider bar prior to a rating could have influenced the value of that rating. If this was the case, we would expect a second rating to always follow a previous rating in terms of magnitude. In fact, ratings of in the ranges of 78,24,74 were typical, i.e. participants had to move the slider bar over a considerable length of the slider interface. This suggests that the slider position did not confound the validity of results. A second argument against the validity of results could be that scores given for any one rating simply depend on the loss received immediately before that time, and not on a wider pattern of events. However, widely different ratings were given for a certain loss rate, where the preceding loss rate was identical, but where the overall pattern of loss preceding that time was different.
Header for SPIE use
0 20 40 60 80 100
1 2 3 4 5 6 7
R ating Interval
S
ubjective QoS Ratin
g
In itia l resp o n se S eco n d re spo n se O b jective lo ss
0 2 0 4 0 6 0 8 0 1 0 0
1 2 3 4 5 6 7 8
R a t in g in t e r v a l
S
ubjective QoS Ratin
g
In i ti a l r e s p o n s e S e c o n d r e s p o n s e O b je c ti v e l o s s
To produce the observed increasing in ratings, there must be a certain value in this quality dimension to participants. From the user’s point of view, the value of stability is that the present events can be linked to those events that can be expected to occur in the future − the predictability of future events.
Figures 8 and 9 illustrate the predictability effect. For every condition, the effect was most noticeable for the latter intervals of loss. Indeed, on closer examination of results, we found that the predictability effect was seen only for those loss rates that had previously been experienced by participants. Thus, where the pattern of objective loss was 0, 5, 0, 10, 15, 10, 20, 20 the effect was seen when objective loss rates of 0 and 10 were configured. For loss rates that had not previously been encountered, ratings for R2 were lower than those for R1. This effect was replicated in all four conditions that were run in the experiment.
The predictability effect was not seen for the highest configuration of objective loss. This occurred in both the third condition (20% loss) and in the fourth condition (30% loss). Comments obtained from the SERVQUAL questionnaire and during the experiments suggest that these loss rates rendered the speech received unintelligible. For condition 3 and 4, the objective loss rate did not recover from this maximum figure. It makes sense that subjective ratings of quality for unintelligible audio did not rise.
One argument against our interpretation of these results could be that ratings in the second condition showed the
predictability effect because participants adjusted to the duration for which each loss rate would be received. This argument
entails that the effect would be seen most prominently in the latter conditions. It is, however, seen prominently in both the latter and former conditions. It is therefore unlikely that the effect is due to participants’ habituating to the duration of loss values they received.
6.
CONCLUSIONS AND FURTHER WORK
The results reported in this paper demonstrate that predictability plays an important role in users’ assessment of real-time audio quality: an objective level of quality will be judged as being of a comparatively higher subjective quality if it is stable. It is therefore likely that a lower level of stable quality will be accepted. Stable quality is a criterion that can be applied to many lower level QoS parameters, such as audio packet loss. Our findings have consequences for the configuration of dynamically adaptive applications. The quality delivered by these applications changes dynamically in line with network conditions. Whilst this mechanism is representative of the fluctuating nature of network quality it is essential that those applications employ traffic shaping at the application level in order to provide a consistent service.
We have also shown that users base their assessment of audio quality on their pre-formed expectancies of network performance. Users’ expectancies of quality change during the course of their interaction with the network. This strongly suggests that feedback is important to ensure that users’ expectancies are accurate. Supplying users with appropriate feedback may encourage them to form a cognitive link between the operations of the application, the network, and the real-world task metaphor to which those operations correspond8. Further research will explore the influence of different amounts and type of
feedback on users’ subjective perceptions of media quality, and their acceptance of certain pricing mechanisms.
The distinction between providing quality to users that is in accordance with their expectancies and providing a guaranteed service has been acknowledged by previous research into optimizing network quality17. The traditional multiplexed nature of shared networks, such as the Internet, makes it difficult to provision hard guarantees. The suggested scheme is to tag traffic according to levels of expected service17. Those packets that are not tagged as being within a certain profile will receive a
congestion pushback notification. Our research has shown that basing mechanisms for resource allocation on the
expectancies of users is a viable option. Primarily we have shown that there is likely to be a sufficient amount of
heterogeneity between users in terms of their expectancies, to warrant the construction of multiple traffic profiles. Further work should now establish how levels of expectancy translate into objective ranges between which QoS metrics can vary without causing significant user dissatisfaction.
Much current debate in the networking community has centered around the costs and benefits of providing differentiated versus integrated services7,18,19. We have shown that, potentially, users − or the applications that represent their preferences − require feedback concerning future quality in order to make accurate assessments of that quality. This entails that any realizable service scheme must abstract much of the complexity involved in maintaining information about network congestion away from the core of the network. The provision of differentiated service mechanisms is therefore preferable to integrated services, the latter involving maintenance of state within the routers, and therefore potentially incurring scalability problems.
The listening task given to participants in these experiments has shown that particular characteristics of quality determine acceptable levels of service, for that task. Work is needed to address users’ subjective quality perceptions whilst they are engaged in a task that they have chosen to perform, and to which they attribute functional value. Media quality actively requested by users may more closely reflect users’ true requirements in tasks such as multimedia conferencing. As the stability of received quality is a QoS parameter that is common to lower level objective QoS parameters (i.e. frame-rate, packet-loss, latency) it is likely that similar preferences toward predictable service will be shown in future studies.
Previous research has suggested that quality assessments made by users vary with their level of networking knowledge and experience20. Further work is required to establish the salience of the predictability effect for users with more advanced theoretical knowledge and experience with real-time network applications. Preliminary studies indicate that individuals with a high level of experience of multimedia conferencing have much lower expectancies of media quality than those who have limited experience in this environment.
Our studies have demonstrated that users can make media quality assessments in a continuous fashion. To assess a dynamically variable system, such as real-time multimedia over the Internet, dynamic rating may be the only reliable and ecologically valid method to employ. We are currently conducting experiments in which QUASS allows users to dynamically control (rather than just assess) the media quality they receive. These experiments extend initial ideas by introducing a penalty mechanism in the form of a budget that diminishes according to the level of quality requested by the user. Additionally, since it has been shown that users’ assessment of audio quality is influenced by the presence of video in conferencing tasks11, these experiments are investigating a potential interaction effect between the two media.
Further investigations into the effect of providing predictable service on users’ perceptions of the quality of that service are the subject of much recent and ongoing research. The recently announced ‘WebQoS’ scheme, combines predictable service with admission control21. The system defers users from a site but makes a prediction of exactly how long it will be before they can be admitted, thus encouraging them to accept a lower level of QoS in return for a predictable service. Our research provides evidence for the potential success of this system.
Although focused on audio, the conclusions of these findings have implications for the design and implementation of networked multimedia applications and the underlying network. For example, in accordance with user and task requirements, an application might request feedback from the network only if a specified amount of change occurred to the internal network state. This implicates the need to configure agent software, at the application level. Currently suggested software that fits the flexible needs of users may act as a ‘QoS-Broker’, thus encapsulating much of the complexity of dealing with variable
network congestion within an automated process22,23. Much of the detail needed to support a predictable service could
therefore be configured at the application level, avoiding unnecessary computational overheads in the network itself. Thus, a user-requirement to increase media quality levels does not necessary mean a corresponding increase in bandwidth provisioning, or functionality at the network layer.
ACKNOWLEDGEMENTS
The authors would like to acknowledge the contribution made by Anna Watson (UCL) to the design and conduct of experiments.
REFERENCES
1. S. Shenker, “Fundamental design issues for the future Internet,” IEEE Journal on Selected Areas in Communication,13,
2. D. Hazlett, “An interim solution to Internet congestion,” Social Science Computing Review, 15, pp. 181-189, 1997.
3. J.K. Mackie-Mason, and H.R. Varian, “Some economics of the Internet,” Proceedings 10th Michigan Public Utility
conference, West Michigan University, Michigan, 1993.
4. R. Cocchi, S. Shenker, D. Estrin, and L. Zhang, “Pricing in computer networks: Motivation, formulation and example,”
IEE/ACM Transactions on networking, 1, pp. 614-627, 1993.
5. F. Kelly, “Charging and accounting for bursty connections,” In L.W. McKnight, and J.P. Bailey, Internet Economics, MIT Press, 1997.
6. R. Bohn, H.W. Braun, and S.Wolff, “Mitigating the coming Internet crunch: Multiple service levels via precedence,”
Applied Network Research Technical Report, GA-A21530, University of California, 1994.
7. A. Gupta, D.O. Stahl, and A.B. Whinston, “Priority pricing of integrated services networks”. In L.W. McKnight, and J.P. Bailey, Internet Economics, MIT Press, 1997.
8. A. Bouch, and M.A. Sasse, “It ain’t what you charge, it’s the way that you do it: A user perspective of network QoS and pricing”. Proceedings of IM’99, pp. 639-654, Boston, 1999.
9. J.K. Mackie-Mason, and H.R. Varian, “Economic FAQs about the Internet,” Journal of Economic Perspectives, 8, pp.
24-36, 1994.
10. A. Watson, and M.A. Sasse, “Measuring perceived quality of speech and video in multimedia conferencing
applications,” Proceedings of ACM Multimedia’98, pp. 55-60, Bristol,1998.
11. A.Watson, and M.A. Sasse, “Evaluating audio and video quality in low-cost multimedia conferencing systems,”
Interacting with Computers, 8, pp. 255-275, 1996.
12. V. Hardman, M.A. Sasse, and I. Kouvelas, “Successful multiparty audio communication over the Internet,”
Communications of the ACM, 41, pp. 74-80, 1998.
13. A. Lee, and, F.H. Lochovsky, “Command line reference behavior: Locality versus recency,” Proceedings INTERACT’98
Human-Computer Interaction, pp. 121-128, 1990.
14. B.M. Perrin, B.J. Barnett, L.C. Walrath, Proceedings of the Human Factors and Ergonomics Society, 37th Annual
meeting, pp. 1117-1121, 1993.
15. A. Bouch, A. Watson, and M.A. Sasse, “QUASS – A tool for measuring the subjective quality of real-time multimedia
audio and video,”In J. May, J. Siddiqi, J. Wilkinson, HCI’98 Conference Companion, pp. 94-95, 1998.
16. A. Parasuraman, L.L. Berry, and V.A. Zeithaml, “SERVQUAL: A multiple-item scale for measuring consumer
perceptions of service quality”. Journal of Retailing, 64, pp. 12-40, 1998.
17. D. Clark, “Internet cost allocation and pricing,” In L.W. McKnight, and J.P. Bailey, Internet Economics, MIT Press, 1997.
18. Z. Wang, “User-share differentiation (USD) scalable bandwidth allocation for differentiated services,”
http:www/ietf.org/internet-drafts/draft-wang-diff-serv-usd-00.txt, 1997.
19. K.Nichols, and S. Blake, “Differentiated services operational model and definitions,” http://www.ietf.org/internet-drafts/draft-nichols-dsopdef-00.txt, 1998.
20. C. Perry, “Travelers on the Internet: A survey of Internet users,” Online, 19, pp. 29-32, 1995. 21. L. DiCarlo, “HP moves to safeguard online retailers against crashes,” News-Online, June 21, 1999.