Article
Harvest Stage Recognition and Potential Fruit Damage
Indicator for Berries based on Hidden Markov Models
and the Viterbi Algorithm
Marcos E. Orchard1,3,† , Carlos Muñoz1,∗,† , Juan Ignacio Huircan1, Patricio Galeas2,† and Heraldo Rozas3,†,
1 Department of Electrical Engineering, Universidad de La Frontera, Temuco 4811230, Chile;
2 Department of Computer Science, Universidad de La Frontera, Temuco 4811230, Chile;
3 Department of Electrical Engineering, Faculty of Physical and Mathematical Sciences, Universidad de Chile,
Santiago, Chile; [email protected] (M.O.); [email protected] (H.R.) * Correspondence: [email protected]; Tel.: +56-45-232-5531
† These authors contributed equally to this work.
1 2
3 4 5
6 7 8
9
Abstract: Thisarticleproposesamonitoringsystemthatallowstotracktransitionsbetweendifferent stagesintheberryharvestingprocess(berrypicking,waitingfortransport,transport,andarrivaltothe packing)solelyusinginformationfromtemperatureandvibrationsensorslocatedinthebasket. The monitoringsystemassumesacharacterizationoftheprocessbasedonHiddenMarkovModelsanduses theViterbialgorithmtoperforminferenceandestimatethemostlikelystatetrajectory. Theobtained statetrajectoryestimateisthenusedtocomputeapotentialdamageindicatorinreal-time.Theproposed methodologydoesnotrequireinformationabouttheweightofthebaskettoidentifyeachofthedifferent stages,whichmakesiteffectiveandmoreefficientthanotheralternativesavailableintheindustry.
Keywords: Berry harvesting stages; Markov chains; Viterbi algorithm; monitoring; fruit damage indicator.
10
1. Introduction 11
Chile is the main exporter of fresh fruit in the Southern Hemisphere (ODEPA), generating 59.3% of the
12
total production [1]. Worldwide, Chile exports more than 75 different species to more than 100 countries
13
around the world, being a leader in the export of table grapes, plums, apples, blueberries and peaches.
14
In this regard, any improvement in productive processes of fresh fruit harvesting for exportation has a
15
significant impact on the national economy. Those improvements should help to efficiently manage the
16
whole chain of the productive process: crop, harvest, packing, and transport to the destination market.
17
The fruit produced in Chile, is mainly harvested manually (hand picking), but this process requires
18
numerous personnel. Although the personnel working in harvesting processes is continuously trained,
19
the vast majority of these workers are employed solely during the productive season. The coordination of
20
this activity requires highly trained personnel in the process of manual harvest, since the fruit can suffer
21
damage, mainly mechanical. Indeed, authors such as Li et al. [2] state that fresh fruit is susceptible to
22
mechanical damage during the whole process, from harvesting in the harvest stage, the transfer to the
23
packing, its passage through it, and also during the transport that takes it to its final destination. This
24
produces a decline in its quality and, therefore, economic damage. In strawberry studies, 51% of this
25
damage occurs in the harvesting operation, 32% in transport to the destination market and only 17% in
26
packing [3]. Several researchers have proposed that the mechanical damage in the fruit is given by three
27
factors: the impact, the vibration and the pressure by the weight of the fruit [4], [5]. In the case of cherry,
28
the processes that cause the loss of quality are three times faster at 20◦C than at 10◦C, and hence the
29
importance of placing them fast in cooling chambers when the harvest temperature is high. For its part,
30
[6] states that the damage in the cranberry is a product of mechanical damage and storage temperature.
31
However, according to authors in [7], the definition of mechanical damage is not completely clear and
32
the authors give different definitions. However, there is a general coincidence: mechanical damage is
33
caused by one or more types of load (shock or load pressure) [8,9]. In this way, [10] described two different
34
types of mechanical damage during post-harvest handling: (a) impacts during the process of harvesting,
35
selecting, handling and transporting the fruit; and (b) compression loads during packing or storage lines.
36
In the post-harvest stage, from the packing to the destination markets, solutions for the monitoring
37
and monitoring of agricultural products mainly aim at measuring the humidity and temperature within
38
the transport vehicles. These studies incorporate Global Positioning Systems (GPSs) to pinpoint the
39
location of the transport vehicle, General Packet Radio Services (GPRSs) for the communication of the
40
transport vehicle with the monitoring station, and the use of Radio Frequency Identification (RFID) for
41
the identification of the products [11]. Some of these technological solutions are commercially available,
42
guaranteeing that the fruit will be transported under appropriate conditions and following the schedule
43
committed by the company. Logistics during the harvest stage, however, are much more difficult to
44
monitor, due to the relatively small number of personnel assigned to supervision tasks compared to the
45
large number workers associated.
46
Ampatzidis et al., [12,13] addresses the problem of the integration of technologies in fruit orchards,
47
with the inclusion of Radio Frequency Identification (RFID) technology and bar codes in harvest bins
48
and orchard trees of cherries. With the help of an electronic scale and Differential Global Positioning
49
Systems (DGPSs) in the tractors that transport the harvest bins, measurements of the weight associated
50
with the harvested fruit are efficiently acquired. This allows to establish productivity indicators of the
51
orchards and harvest personnel. This research effort recognizes that the weighing process, by means of an
52
electronic scale on the tractor that transports the recollection bins, increases the loading time by almost
53
33%, and proposes to solve this issue by acquiring these measurements directly at harvesting baskets
54
automatically. However, this strategy does not take into account the fact that losses in the logistics chain,
55
and the management of resources, are also related to the harvest personnel.
56
Some orchards in Chile use bar code technologies to identify the harvest baskets and the personnel
57
that collect the fruit, by recording the number of baskets used by each collector and the time between
58
each full basket delivery. However, the collected data does not provide information about the damage
59
underwent by the fruit during this process [7]. Moreover, this approach does not consider relevant
60
variables such as temperature and vibrations during harvesting, which can produce mechanical damage
61
to the fruit, accelerating the dehydration process and finally decreasing the shelf life of the product.
62
Galeas et al. [14] presented a low complexity prototype of a basket with built-in sensors of weight,
63
vibrations, and temperature. The main result was the identification of transition stages of the basket based
64
only on the signals acquired. The transition stages shown useful to identify the time that the basket is in
65
fruit picking, in waiting for transportation, in transportation to the packing and in the packing. Some
66
of the sensors used were low-cost and not invasive, such as the IMUs and temperature, because they
67
are based on MicroElectroMechanical (MEM) devices; however, the weight sensor requires supporting
68
the strain gauges with mechanical parts inside the harvest basket, impacting directly on the fabrication
69
costs. This design needs improvement by finding a way of removing the mechanical component without
compromising the functionality of the basket. To achieve this development is required to identify the
71
harvest’s time transitions without using the fruit’s weight. Length of the time elapsed by each one of the
72
harvest phases are useful to avoid high temperatures during prolonged periods of waiting times.
73
Time transition identification is a challenging problem, in particular for this settling because, as is
74
shown in Galeas [14], the harvest phases go sequentially, and due the data provided is gathered from
75
low-cost instrumentation, the problem is well suited for the use of Hidden Markov Chains methods, and
76
following the work of Rabiner [15], for this particular problem the Viterbi algorithm is one of the best
77
suited.
78
In this regard, the objective of this article is to propose a novel monitoring system for berry harvesting
79
processes that is solely based on the use of temperature and vibration sensors to perform inference and
80
estimate the most likely trajectory and switch times between each harvesting process stage. The obtained
81
trajectory estimate will be then used to compute a potential damage indicator for the fruit in terms both of
82
the registered temperature and vibration energy.
83
The article structure is as follows. Section2focuses on providing theoretical background on Markov
84
Chains and the Viterbi algorithm. Section3.4presents a description of the experimental setup that allowed
85
to acquire real-time vibration and temperature measurements directly from berry harvesting bins (i.e., the
86
Smartbins) and the proposed methodology for online recognition of different harvesting stages, as well as
87
the definition of a potential fruit damage indicator. Section4shows an analysis of the obtained results in
88
terms of data acquired from a field experimental campaign and Section5presents main conclusions of this
89
research effort.
90
2. Theoretical Background 91
2.1. Markov Chains 92
The proposed harvesting stage detection algorithm is built on the assumption that this sequence of
93
stages can be modeled as a Hidden Markov Model (HMM). Before going into the details that support this
94
assumption, though, it is important to define the concept of a first-order Markov Process. A Markov process
95
is a stochastic process that satisfies the Markov property (sometimes characterized as “memorylessness"),
96
that basically states that one can make predictions for the future of the process based solely on its present
97
state; i.e., conditional on the present state of the system, its future and past states are independent [15].
98
A first-order Markov Chain is a particular case of a Markov Process [15]. To define it properly, let us
99
consider a system such that its condition at any time instant can be characterized by a finite set of states
100
S1,S2,· · ·,SN. At any time, this system can change its operational condition in time (i.e., the system makes 101
a transition from one “state" to another), with transition probabilities that are conditional to the current
102
state. We denote the state transition times ast=1,· · ·, and the state at any given timetasqt[15].
103
The probabilistic model for system state transitions for the specific case of a discrete first-order Markov
104
Chain is completely described by the State Transition MatrixAand the initial state probability distribution
105
Π, where:
106
P[qt=Sj|qt−1=Si] =aij, 1≤i,j≤N, (1) and where:
107
• aij ≥0
108
• ∑Nj=1aij=1.
This Markov Process is denominated “observable" since the system output is a state that can be
110
directly measured. The probability of a given sequence can be computed in this case using the following
111
straightforward procedure:
112
P(O={Sn0,Sn1,· · ·,Snl}|Model) =P[Sn0]·P[Sn1|Sn0]· · ·P[Snl|Snl−1]
=π0(n0)·an0n1· · ·anl−1nl
(2)
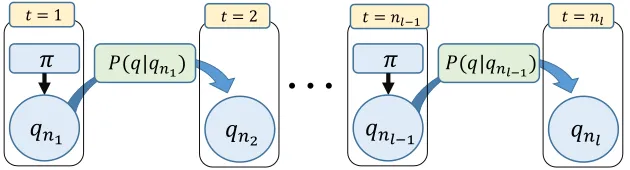
Figure1shows a graphical representation of a single realization of this stochastic process. Please note
113
that state transition probabilities are completely determined by the current system state [15].
114
𝜋
𝑡 = 1𝑞
𝑛1𝑞
𝑛2𝑡 = 2
𝑃(𝑞|𝑞𝑛1)
𝜋
𝑡 = 𝑛𝑙−1
𝑞
𝑛𝑙−1𝑞
𝑛𝑙𝑡 = 𝑛𝑙
𝑃(𝑞|𝑞𝑛𝑙−1)
…
Figure 1.Graphical representation of a first-order Markov Chain realization.
2.2. Hidden Markov Models (HMMs) 115
In many practical cases, the system state cannot be directly measured and must be estimated. These
116
cases can be well characterized through the concept of Hidden Markov Models (HMMs). The adjective
117
“hidden" refers to the state sequence through which the model passes, not to the parameters of the
118
model; the model is still referred to as a hidden Markov model even if these parameters are known
119
exactly. Measurements are linked to the system states via a conditional probability density function. As
120
a consequence, the resulting model has two sources of uncertainty that affect the inference problem: (i)
121
hidden state dynamics and (ii) measurement noise [15].
122
A discrete HMM is characterized by the following parameters:
123
• N: Number of states. The set of possible states can be denoted byS={s1,· · ·,SN}. The state of the
124
system at timetis denotedqt.
125
• M: Number of measurements associated with each state. Each measurement corresponds to a
126
physical outcome from the system that can be acquired using appropriate sensors.
127
• The transition probability distribution between system statesA={aij}where:
128
P[qt=Sj|qt−1=Si] =aij, 1≤i,j≤N (3) • The measurement probability distribution conditional on the statej,B={bj(k)}:
129
bj(k) =P[Ok|qt=Sj], 1≤j≤N
1≤k≤M (4)
• The initial probability distribution of system statesπ, where: 130
Considering all of the above, for convenience the following compact notation is typically used to
131
denote the entire set of parameters that characterizes the HMM:
132
λ= (A,B,π) (6)
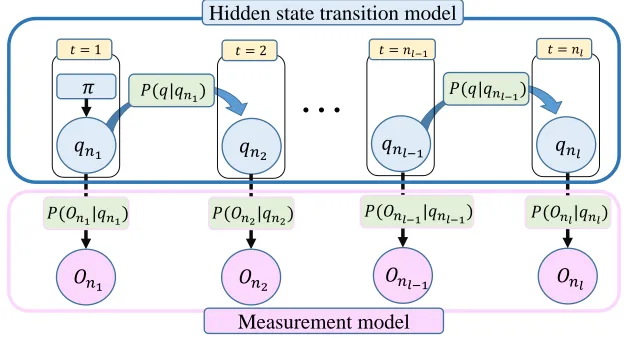
A realization of a HMM is graphically depicted in Figure2. It is important to note that part of
133
the system dynamics are hidden to the observer ("hidden evolution model"). These dynamics follow a
134
similar pattern as the one depicted in Figure1. In addition, in a HMM there is an observational model,
135
which is conditional on the state trajectory. The objective in an inference problem based on HMMs is to
136
estimate the sequence of hidden statesS ={s1,· · ·,SN}conditional on a set of system measurements
137
O={O1,· · ·,ON}[15].
138
𝜋
𝑡 = 1
𝑞𝑛1 𝑞𝑛2
𝑡 = 2
𝑃(𝑞|𝑞𝑛1)
𝑡 = 𝑛𝑙−1
𝑞𝑛𝑙−1 𝑞𝑛𝑙
𝑡 = 𝑛𝑙
𝑃(𝑞|𝑞𝑛𝑙−1)
…
𝑂𝑛1 𝑃(𝑂𝑛1|𝑞𝑛1)
𝑂𝑛2 𝑃(𝑂𝑛2|𝑞𝑛2)
𝑂𝑛𝑙−1
𝑃(𝑂𝑛𝑙−1|𝑞𝑛𝑙−1)
𝑂𝑛𝑙 𝑃(𝑂𝑛𝑙|𝑞𝑛𝑙)
Hidden state transition model
Measurement model
Figure 2.Graphical representation of a discrete HMM.
2.3. Viterbi Algorithm 139
The Viterbi Algorithm (VA) [16], [17], [18] was proposed as a solution to the decoding of convolutional
140
codes by Andrew J. Viterbi in 1967. This algorithm had a great impact in the fields of communications
141
and signal processing, extending its influence to other domains such as the problem of state estimation
142
in stochastic nonlinear systems. The Viterbi Algorithm (VA) aims at finding the optimal estimate for a
143
sequence of hidden states (called the Viterbi path) in a HMMs, conditional on a set of system measurements.
144
This task is achieved using a dynamic programming formulation, where the inference problem is divided
145
in a series of small stages (indexed by the time associated with each observation). At each stage, the VA
146
finds the optimal value for the state within the sequence, and it continues the analysis to the next stage in
147
an inductive manner. Formally speaking, to find the optimal sequence of hidden statesQ∗={q∗1q2∗· · ·q∗T} 148
in a realization of a HMM, conditional on a sequence of system measurementsO={O1O2· · ·OT}, the
149
following variable is defined: [15,16]:
150
δt(i) = max q1,q2,···,qt−1
P[q1,q2,· · ·,qt−1,O1O2· · ·OT|λ], (7) whereδt(i)is the most likely path for the HMM at timet, considering the firsttobservations and the state
151
Sias terminal condition. By induction, it is possible to write:
152
δt+1(i) = [max
Therefore, the inference problem can now be solved in an iterative manner by running the following
153
the Pseudo-code:
154
Algorithm 1Viterbi Algorithm(λ= (A,B,π),O) Inputs:λ= (A,B,π),O
Output:Q∗={q∗1,q∗2,· · ·,q∗T}
1: fori=1,· · ·,Ndo . Initialization
2: δ1(i) =πibi(O1) 3: ψ1(i) =0
4: forj=1,· · ·,N,t=2,· · ·,Tdo . Recursion
5: δt(j) = max
1≤i≤N[δt−1(i)aij]·Bj(Ot)
6: ψt(i) =argmax
1≤i≤N
[δt−1(i)aij]
7: P∗= max 1≤i≤N[δT(i)]
8: q∗T=argmax 1≤i≤N
[δT(i)]
9: fort=T−1,T−2,· · ·, 1do . Reconstruct state sequence
10: q∗t =ψt+1(q∗t+1) 11: returnQ∗
3. Materials and Methods 155
3.1. The Blueberry Harvesting Process 156
The experiment is carried out inside the Boldo S.A. orchard. This orchard has 50 hectares planted
157
with blueberries and is located in Yungay, Chile, in coordinates Lat: −37.1149584, Long:−72.1973101.
158
As shown in Figure3, its packing is located at the center of the garden and there are roads that divide
159
the plantation of blueberries into 3 sectors and each of these sectors is divided into 7 sub-sectors for the
160
irrigation process. Each sector has different varieties, including: Duke, Rabiteye, Brightwell, Tifblue,
161
O’neal and Brigitta.
162
The process of picking fresh blueberries is done manually and begins by assigning a crew of collectors
163
in each sector of the garden (see Figure4). The collectors walk through the orchard arranged in rows
164
of approximately 100 meters in length, provided with a plastic box of 3.5 liters hung from the neck by a
165
harness. The harvesting process has a duration of 20 to 40 minutes depending on the experience of the
166
harvester and how much fruit is in the bushes. Once filled the plastic box, the collector goes to the first
167
storage center (place provided with shade to temporally store the boxes previous to delivery at the local
168
packing site). In the reception center, another worker increase the accounting of the number of boxes
169
harvested by the collector and records the time when it was received. Finally the collector is provided
170
with an empty box to restart the picking process.
Figure 3.Blueberry orchard in Yungay, Chile.
Figure 4.Picture of the blueberry orchard.
The boxes full of fruit are stored in this storage center awaiting for a truck with a trailer to take them
172
to the local packing site. Once arrived to the packing the net weight of fruit picked is recorded using an
173
electronic scale. Then, the filled boxes are entered into the packing throughout a freezing tunnel to lower
174
the temperature of the berries. Inside the packing, the boxes are emptied over a classification table and the
175
boxes are recycled to begin a new harvest cycle.
176
3.2. A Modular Distributed Monitoring System for the Harvesting Process: The “Smartbin" 177
The proposed system has was developed, using a harvest basket of 3.5L, which incorporated two
178
components:
- A main device installed on one of its sides, which contains a SODAQ Autonomous microcontroller
180
card, real-time clock, temperature sensors and an inertial unit (IMU) to measure the vibrations of the
181
harvest basket and detect the shocks suffered by it. - A false base sustained with a load cell, to measure at
182
all times the weight carried by the basket.
183
The stand-alone SODAQ card uses an Atmel SAMD21J18 processor, with 256kbof Flash memory,
184
32kbof SRAM memory and a 32-bit processor running at 48Mhz. In addition, it has a socket for the use of
185
a micro SD card, which allows internal storage of the data. A real-time clock (DS1307) with the time and
186
date was added to this device, information that is attached to each captured data. The IMU used is based
187
on the MPU-9250 chip with accelerometer, gyroscope and 3-axis magnetometer. The unit also has two
188
temperature sensors based on the digital device DS18B20, whose accuracy is 0.5◦C. These temperature
189
sensors protrude like two tubes of the main device, glued to one of the internal walls of the harvest box
190
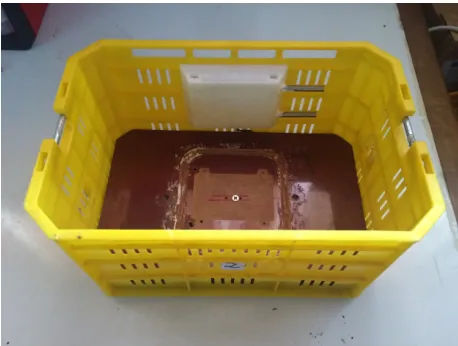
to measure the temperature of the berries at two heights, 6cmand 10cmfrom the base of the box (see
191
Figure5). The load cell located in the false base of the box is connected to an analog / digital converter
192
HX711 which in turn is connected to the autonomous SODAQ device. The system was provided with a
193
Li-Ion battery of 2300mAh/3.7V, for its energy autonomy, which was estimated at 30 hours of continuous
194
operation.
195
This main device works as a remote collection unit and as a data logger, transmitting wireless and
196
storing all the data collected in an SD Card installed in the Autonomous SODAQ card, with two types of
197
records, one that is written every 100 ms with the measurements of the IMU, date and time, and another
198
that is written every 15 seconds with measurements of temperature, weight, voltage of the battery, date
199
and time. These time measurements are taken to identify faults in the system, and correlate the tests with
200
the events that occurred during the day.
201
Figure 5.conditioned basket to on line measure of weight, 2 temperatures and accelerations.
3.3. Data acquisition campaign 202
Data from the experimental campaign was acquired using 5 “Smartbins" in an experimental set up
203
carried out during one day in the middle of the harvest season of blueberries in the “El Boldo" orchard
204
(see Figure3). Each one of the 5 “Smartbins" was used in two consecutive harvest cycles during the day of
205
the experiment. As a result, it was possible to record 10 complete harvesting cycles (each cycle finishes
206
with the bin returned in the hands of the picker after being emptied). The structure of the acquired data
207
set can be summarized as follows:
208
• Temp_1: Temperature measurement acquired every 15 seconds using a sensor that is located near
209
the bottom of the bin.
• Temp_2: Temperature measurement acquired every 15 seconds using a sensor that is located near
211
one of the four the external edges of the bin.
212
• Accx: Acceleration measurement inx-axis acquired ten times per second with an IMU located inside
213
the bin.
214
• Accy: Acceleration measurement iny-axis acquired ten times per second with an IMU located inside
215
the bin.
216
• Accz: Acceleration measurement inz-axis acquired ten times per second with an IMU located inside
217
the bin.
218
• Weight: Net weight of the “Smartbin" acquired every 15 seconds with sensor that is located at the
219
bottom of the bin.
220
In terms of nomenclature, and for all practical purposes, each harvesting cycle was labelled using the
221
following format:Nicj, wherei=1, 2, 3, 4, 5 refers to theithbin andj=1, 2 indicates the number of the
222
recorded cycle for that specific bin.
223
Eight of these cyclesNicj, wherei=2, 3, 4, 5,j =1, 2 were used as training data, while two cycles
224
where used for validation purposes (N1c1andN1c2, both corresponding to the 1stbin). 225
3.4. Proposed Methodology for Online Harvesting Stage Detection 226
The proposed methodology uses the Viterbi algorithm to perform inference of data sets and estimate
227
the most likely state trajectory in the harvesting process. Indeed, this case study allows to define a finite
228
number of possible “states" (each one associated with one stage of the harvesting procedure), making it a
229
perfect candidate for the implementation of inference schemes based on the assumption of HMMs. The set
230
of observationsOincorporate data from IMUs and temperature sensors. Although the entire process has
231
six “states" that can be identified (picking, waiting, transport (full bin), cooling, emptying, and transport
232
(empty bin)), only four of them are hereby considered. The latter, since solely the first 4 states are critical in
233
terms of quantifying the potential damage to the fruit during the harvesting procedure (the “emptying"
234
state is fully automated, and afterwards the bin is empty). These states are:
235
1) “Picking"(S1):The pickers, provided with a 3.5 liter plastic box hung around the neck by a harness,
236
cover the orchard prepared in rows approximately 100 meters long. Picking lasts 20 to 40 minutes
237
per box, depending on the picker’s experience and the volume of fruit on the shrubs. During this
238
stage it is possible to measure high energy vibration signals and high temperatures.
239
2) “Wait" (S2): When the box is full, the picker goes to the storing center (shaded area), where he/she
240
delivers the box for counting. The full boxes remain at the warehouse waiting for the tractor-trailer
241
to take them to the local packing area.
242
3) “Transport" (full bin)(S3): The tractor-trailer transports full boxes from the warehouse to the local
243
packing area.
244
4) “Cooling" (freezer tunnel) (S4): The fruit is admitted to packing via a conveyor table, where a
245
cooling system lowers its temperature using a freezing tunnel.
246
Considering all of the above, a HMM is trained for this case study using eight harvesting cycles
247
Nicj, wherei =2, 3, 4, 5, j= 1, 2. Ground truth for the transition times between states in training (and
248
also validation) data was defined by incorporating information acquired from the weight sensor that is
249
located at the bottom of the “Smartbin". Weight sensor measurements allow to simplify the detection of
250
state transitions because they help to determine the moment when the “Picking" stage is over (bin weight
251
measurements stabilize at a constant value, a condition that can be tested by a basic hypothesis testing
252
procedure), as well as the exact moment when the bin is emptied. Conditional to the latter transition
253
times, it is possible to discriminate the “cooling" stage just by detecting sudden drops in temperature
measurements, while “wait" and “transport" stages can be identified since they differ significantly in terms
255
of the associated energy in the IMU signal.
256
The challenge behind the proposed method for state transition detection is to avoid the usage of
257
weight measurements altogether (except, as in this case study, for purposes of determining ground truth
258
transition times in training data). The latter since it would be preferable and significantly cheaper to
259
eliminate this weight sensor from the original design of the “Smartbin". For this purpose, a HMM is
260
conceived to describe the transition between the stages of the harvesting process, where the observation
261
space is solely determined by the following sensor information:
262
1) Inertial Measurement Unit (IMU):data acquired by the IMU. A simple pre-processing algorithm is implemented to complement this information with an average of the total energy in the vibration signal every 15[s]over the time window containing the last 15 seconds of measures.
I MU_Energyt= t
∑
j=t−14
accx(j)2+accy(j)2+accz(j)2 (9)
2) Temperature Measurements: Besides the information provided by sensorsTemp_1 andTemp_2, a simple pre-processing algorithm is implemented to measure the difference in readings between both temperature sensors.
Delta_T(t) =Temp_2(t)−Temp_1(t) (10) Considering all of the above, and following the maximum likelihood estimation procedure explained
263
in [15] to determine the coefficients of state transition matrices in a HMM, it is possible to state that the
264
harvesting process can be characterized by the following matrices:
265
A=
0.9153 0.0847 0.0000 0.0000 0.0000 0.8169 0.1831 0.0000 0.0000 0.0000 0.6966 0.3034 0.0000 0.0000 0.0000 1.0000
(11)
π=
h
1 0 0 0i (12)
whereAis obtained by computing the expected residence time on each state in the training data set [15].
266
In this case,πis known since the HMM is always initialized in stateS1 (“Picking"). The characterization 267
of the entire process using a HMM allows to use the Viterbi algorithm for state transition time detection
268
purposes.
269
3.5. Proposed Methodology for Fruit Damage Indicator 270
A natural byproduct associated with the implementation of the Viterbi algorithm for estimation of the
271
most likely state path is that it is also possible to detect start and end times for each of the different stages
272
of the berry harvesting process. These start and ending times become critical information to characterize
273
the potential damage accumulated during “picking", “waiting", and ‘transport" stages since during that
274
lapse the fruit in the bin is exposed to higher level of vibrations and elevated temperatures. Inspired on
275
this fact, this research effort has proposed the following damage indicator to assess the potential damage
276
incurred by the fruit during the harvesting process:
DamageIndicator= 1
105·(
TS4
∑
i=0
Temp_2i+ TS4
∑
i=0
I MU_Energyi) (13)
whereI MU_Energyis a variable that indicates the energy associated with the vibration signal recorded
278
by sensors in the bin during a 15[s]sliding window. TS4corresponds to the moment in which the Viterbi 279
algorithm detects a transition from statesS3 toS4, measured in seconds. The temporal referencet=0 is
280
established to be synchronized with the start of the “picking" stage.
281
The proposed indicator for potential fruit damage offers robustness against disturbances in estimates
282
of transition times, since it solely depends onTS4for all practical purposes. Indeed,TS4determines the 283
start of the “cooling" stage and thus, it is expected to observe at that time simultaneous (and sudden)
284
drops in readings of sensorsTemp_1 andTemp_2, while the energy in the vibration signal should be small
285
compared to “picking" and “transport" stages. This evidence anticipates that errors in the estimate ofTS4 286
should be negligible in comparison to the total time allotted for the harvesting cycle, and therefore the
287
value of the propose damage indicator, which depends on the overall accumulation of stress on the fruit,
288
should not exhibit significant changes on its value.
289
4. Obtained Results in Experimental Campaign 290
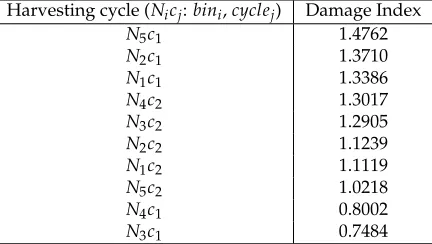
Table 1 and Figures6-15show the results obtained when applying the proposed scheme for harvest
291
stage recognition and potential fruit damage assessment on actual field data from an experimental
292
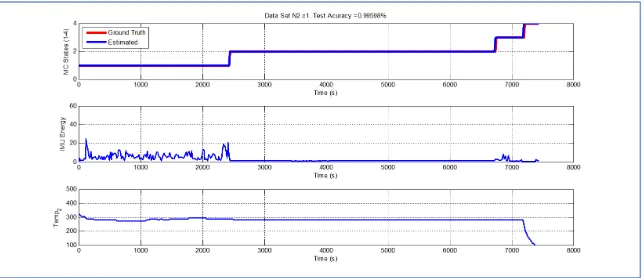
campaign. Each figure consists of three graphs that help to understand the manner in which the proposed
293
algorithm interprets the acquired data. The first graph shows the performance exhibited by the Viterbi
294
algorithm in the detection of transitions between each one of the first 4 stages of the harvesting process:
295
“picking", “wait", ‘transport", and “cooling". The second graph shows the energy of the IMU signal
296
(averaged over a 15[s]sliding window), and finally the third graph on each figure show the temperature
297
registered on the second temperature sensor inside the bin. Figures6-15are sorted in terms of the one that
298
represents the most potential fruit damage to the one that is more innocuous. Given the structure of the
299
proposed damage indicator, both the time of exposure of the fruit at ambient temperature (principally at
300
statesS1-S3) and cumulative energy of vibration signals (principally at stateS1) have critical influence on
301
the assessment of potential damage.
302
Table 1.Experimental campaign: Harvesting cycles ordered in terms of potential fruit damage.
Harvesting cycle (Nicj:bini,cyclej) Damage Index
N5c1 1.4762
N2c1 1.3710
N1c1 1.3386
N4c2 1.3017
N3c2 1.2905
N2c2 1.1239
N1c2 1.1119
N5c2 1.0218
N4c1 0.8002
N3c1 0.7484
Figure6illustrates a case where the potential fruit damage is the greatest. One of the reasons
303
that explain this statement is the fact that in this cycle the fruit was exposed to relatively high ambient
304
temperature for a lengthy lapse of time. Moreover, both during the “picking" and “transport" stages, the
305
energy of the IMU accelerometer signal is significant, indicating that the fruit in the bin could have been
shaken excessively. It is important to note that the Viterbi algorithm in this case fails to detect the transition
307
between statesS1 andS2 (overall efficacy in detection in this data set is 89.918%). Although this issue
308
affects the tractability of the bin in the system, it does not have an impact of the assessment of the potential
309
fruit damage since the transitions toS4 (“cooling stage") is perfectly detected.
310
Figure 6.Detection of berry harvesting stages. Data setN5c1
Figures7-8illustrate a case where the potential fruit damage is significantly high. Although the same
311
concepts explained in the previous case also apply here, it is important to note that the energy associated
312
to the vibration signal is lower than in the case of Figure6.Also, please note that the performance of the
313
Viterbi algorithm is high (overall efficacy in detection in these data sets is 99.396%), exhibiting a negligible
314
delay in the detection of the transition betweenS1 andS2 in data set N1c1, being the latter used for 315
validation purposes of the proposed approach.
316
Figure 8.Detection of berry harvesting stages. Data setN1c1
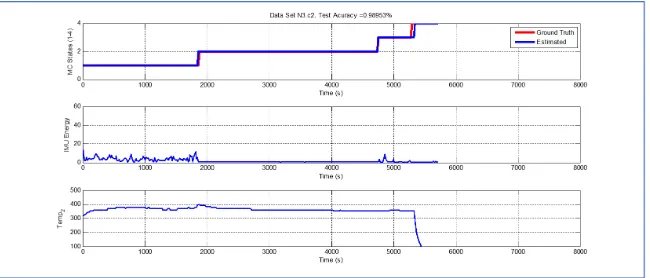
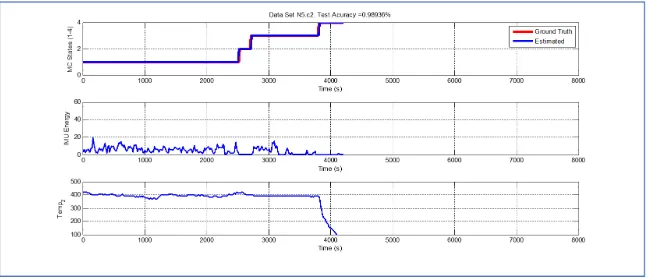
Although temperature associated with the data shown in Figures 9 - 11 is higher than their
317
predecessors, the lapse of time where the fruit was exposed to ambient temperature is considerably
318
smaller. In both cases, there is a small delay in the estimate of parameterTS4, but the performance of the 319
Viterbi algorithm is still beyond 98.95%.
320
Figure 9.Detection of berry harvesting stages. Data setN4c2
Figure 11.Detection of berry harvesting stages. Data setN2c2
Validation data set N1c2 (Figure 12) is the one where the Viterbi algorithm exhibits the lowest 321
performance (overall efficacy in detection in these data sets is 84.667%). Nevertheless, even in this case, the
322
error associated with the estimate of parameterTS4is 90[s], which represents 2% in a data set that records 323
4485[s]of operation.
324
Figure 12.Detection of berry harvesting stages. Data setN1c2
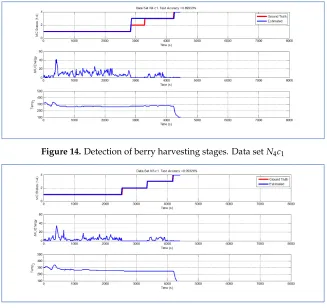
Last but not least, Figures13-15exhibit analogous performance in terms of the accuracy of the Viterbi
325
algorithm. Interestingly, in terms of potential fruit damage, the most innocuous data set corresponds to
326
one where the ambient temperature was low, and where the harvesting cycle lasted less than 4425[s].
327
Figure 14.Detection of berry harvesting stages. Data setN4c1
Figure 15.Detection of berry harvesting stages. Data setN3c1
5. Conclusions 328
This article proposes a monitoring system and a for berry harvesting solely based on the use of
329
temperature and vibration sensors. The monitoring system assumes a characterization of the process in
330
terms of a Hidden Markov Model and uses the Viterbi algorithm to perform inference and estimate the
331
most likely state trajectory.
332
The obtained state trajectory estimate is then used to compute a potential damage indicator for the
333
fruit in terms both of the registered temperature and vibration energy, with overall average efficacy in
334
detection for validation data sets of 91.937%, while errors in the estimates of the moment at which the bin
335
reaches the cooling stage were not larger than 2%, a fact that validates the proposed damage indicator as a
336
robust feature for characterization of the potential degradation in the quality of the fruit when used in
337
conjunction with the Viterbi algorithm for purposes of estimating the value ofTS4. 338
More importantly, the proposed procedure proves to be equivalent in terms of the effectiveness in
339
the characterization of the stages of the harvesting process to other alternatives found in the literature,
340
but significantly more efficient since it does not require information about the weight of the bin in which
341
the fruit is collected to identify the different stages of the harvesting process and determine indicators
342
that could help to assess if this harvesting process is being performed normally. It seems that the Viterbi
343
algorithm is a complex solution for this problem but is inexpensive to include those procedures in the
344
software running on the microprocessor of the “Smartbins", avoiding the need to measure weight and
345
consequently disregarding the strain gauges and the mechanical parts needed to support them. The fact
346
that it is possible to dispense the utilization of weight sensors in the design of “Smartbins", replacing it by
347
more advanced signal processing tools, has a significant economic impact in terms of the penetration of
these monitoring devices in the agricultural market as a right solution for some of the problems that the
349
industry has faced over these years
350
Author Contributions: Project administration, P.G.; Conceptualization, C.M., M.O and P.G.; Data curation, H.R.; 351
Formal analysis, M.O.; Investigation, P.G., C.M. and M.O.; Methodology, M.O, C.M. and P.G.; Validation, J.H.; 352
Visualization, M.O.; Writing—original draft, C.M and M.O.; Writing—review & editing, C.M and M.O. 353
Funding:This work has been supported by the FONDEF IDeA Project ID16I10206 and also by the Advanced Center 354
for Electrical and Electronic Engineering, AC3E, Basal Project FB0008, CONICYT. 355
Conflicts of Interest:The authors declare no conflict of interest. 356
References 357
1. Muñoz, M. Boletin frutícola avance Octubre 2018.Oficina de Estudios y Políticas Agrarias (Odepa) del Ministerio 358
de Agricultura, Gobierno de Chile2018. 359
2. Li, Z.; Thomas, C. Quantitative Evaluation of Mechanical Damage to Fresh Fruits. Trends in Food Science & 360
Technology1991,32, 138–150. doi:10.1016/j.tifs.2013.12.001. 361
3. Aliasgarian, S.; Ghassemzadeh, H.; Moghaddam, M.; Ghaffari, H. Mechanical Damage of Strawberry 362
during Harvest and Postharvest Operations. World Applied Sciences Journal 2013, 22, 969–974. 363
doi:10.5829/idosi.wasj.2013.22.07.798. 364
4. Vergano, P.; Testin, R.; Newall, C. Distinguishing among Bruises in Peaches Caused by Impact, Vibration, and 365
Compression. Journal of Food Quality1991,14, 285–298. doi:10.1111/j.1745-4557.1991.tb00069.x. 366
5. Lin, X.; Brusewitz, G. Peach Bruise Thresholds Using the Instrumented Sphere. Applied Engineering in 367
Agriculture1994,10, 509–513. doi:10.13031/2013.25880. 368
6. Sanford, K.; Lidster, P.; McRae, K.; Jackson, E.; Lawrence, R.; Stark, R.; Prange, R. Lowbush Blueberry Quality 369
Changes in Response to Mechanical Damage and Storage Temperature. Journal of the American Society for 370
Horticultural Science1991,116, 47–51. doi:10.21273/JASHS.116.1.47. 371
7. Martínez-Romero, D.; Serrano, M.; Carbonell, A.; Castillo, S.; Riquelme, F.; Valero, D.Production Practices and 372
Quality Assessment of Food Crops; Kluwer Academic Publishers, 2004; chapter Mechanical Damage During Fruit 373
Post-harvest Handling: Technical and Physiological Implications, pp. 233–252. 374
8. Gallardo, R.K.; Stafne, E.T.; DeVetter, L.W.; Q. Zhang, C.L.; Takeda, F.; Williamson, J.; Yang, W.Q.; Cline, 375
W.O.; Beaudry, R.; Allen, R. Blueberry Producers’ Attitudes toward Harvest Mechanization for Fresh Market. 376
Horttechnology2018,28, 10–16. doi:10.21273/HORTTECH03872-17. 377
9. Moggia, C.; Graell, J.; Lara, I.; González, G.; Lobos, G.A. Firmness at Harvest Impacts Postharvest Fruit 378
Softening and Internal Browning Development in Mechanically Damaged and Non-damaged Highbush 379
Blueberries (Vaccinium corymbosum L.). Front. Plant Sci2017,8, 1–11. doi:10.3389/fpls.2017.00535. 380
10. Timm, J.; Bollen, A.; Rue, B.D.; Woodhead, I. Apple Damage and Compressive Forces in Bulk Bins During 381
Orchard Transport. Applied Engineering in Agriculture1998,14, 165–172. doi:10.13031/2013.19366. 382
11. Swedberg, C. Driscoll’s Monitors Its Berry Shipments in Real Time. RFID J.2010, p. 1–2. 383
12. Ampatzidis, Y.G.; Vougioukas, S.G.; Whiting, M.D. A wearable module for recording worker position in 384
orchards. Comput. Electron. Agric.2011,78, 222–230. doi:10.1016/j.compag.2011.07.011. 385
13. Ampatzidis, Y.; Whiting, M.; Scharf, P.; Zhang, Q. Development and evaluation of a novel system for monitoring 386
harvest labor efficiency.Comput. Electron. Agric.2012,88, 85–94. doi:10.1016/j.compag.2012.06.009Get. 387
14. Galeas, P.; Muñoz, C.; Huircan, J.; Fernandez, M.; Segura-Ponce, L.A.; Duran-Faundez, C. Smartbins: 388
Using Intelligent Harvest Baskets to Estimate the Stages of Berry Harvesting. Sensors 2019, 19, 1361. 389
doi:10.3390/s19061361. 390
15. Rabiner, L.R. A tutorial on hidden Markov models and selected applications in speech recognition.Proceedings 391
of the IEEE1989,77, 257–286. doi:10.1109/5.18626. 392
16. Viterbi, A. Error bounds for convolutional codes and an asymptotically optimum decoding algorithm. IEEE 393
transactions on Information Theory1967,13, 260–269. doi:10.1109/TIT.1967.1054010. 394
18. The Viterbi Algorithm, 2009. doi:10.1007/978-0-387-73003-5_592. 396