R E V I E W
Open Access
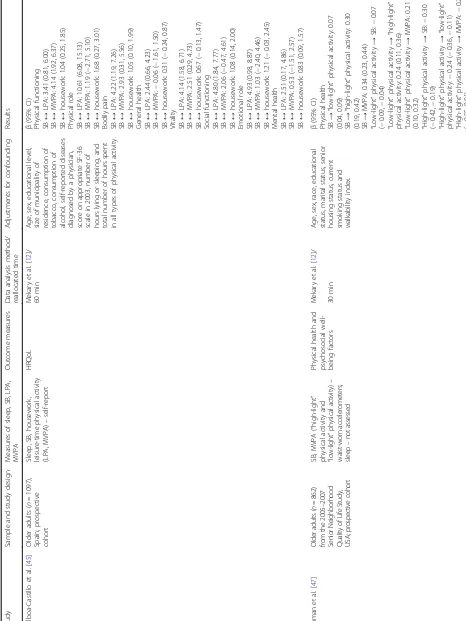
Health outcomes associated with
reallocations of time between sleep,
sedentary behaviour, and physical
activity: a systematic scoping review of
isotemporal substitution studies
Jozo Grgic
1, Dorothea Dumuid
3, Enrique Garcia Bengoechea
1,2, Nipun Shrestha
1, Adrian Bauman
4,
Timothy Olds
3and Zeljko Pedisic
1*Abstract
Background:
During a 24-h day, each given period is spent in either sedentary behaviour, sleeping, light physical
activity (LPA), or moderate-to-vigorous physical activity (MVPA). In epidemiological research most studies have
traditionally analysed the associations of these behaviours in isolation from each other; that is, without taking
into account the displacement of time spent in the remaining behaviours. In recent years, there has been a
growing interest in exploring how all the behaviours across the energy expenditure spectrum influence health
outcomes. A statistical model used to investigate these associations is termed an isotemporal substitution model (ISM).
Considering the increasing number of ISM-based studies conducted in all age groups, the present paper aimed to: (i)
review and summarise findings from studies that employed ISM in sleep, sedentary behaviour, and physical activity
research; (ii) appraise the methodological quality of the studies; and (iii) suggest future research directions in this area.
Methods:
A systematic search of ten databases was performed. The Newcastle
–
Ottawa scale was used to assess the
methodological quality of the included studies.
(Continued on next page)
* Correspondence:zeljko.pedisic@live.vu.edu.au;zeljko.pedisic@vu.edu.au
1Institute for Health and Sport (IHES), Victoria University, Melbourne, Australia
Full list of author information is available at the end of the article
© The Author(s). 2018Open AccessThis article is distributed under the terms of the Creative Commons Attribution 4.0 International License (http://creativecommons.org/licenses/by/4.0/), which permits unrestricted use, distribution, and reproduction in any medium, provided you give appropriate credit to the original author(s) and the source, provide a link to the Creative Commons license, and indicate if changes were made. The Creative Commons Public Domain Dedication waiver
(Continued from previous page)
Results:
Fifty-six studies met the inclusion criteria, all being of moderate or high methodological quality. Associations were
reported for exchanged time varying from one minute to 120 min/day across the studies, with 30 min/day being the most
common amount of time reallocated. In total, three different ISM methodologies were used. The most commonly studied
health outcomes in relation to isotemporal substitutions were mortality, general health, mental health, adiposity, fitness, and
cardiometabolic biomarkers. It seems that reallocations of sedentary time to LPA or MVPA are associated with significant
reduction in mortality risk. Current evidence appears to consistently suggest that reductions in mortality risk are greater
when time spent sedentary is replaced with higher intensities of physical activity. For adiposity, it seems that reallocating
sedentary time to physical activity may be associated with reduced body mass index, body fat percentage, and waist
circumference in all age groups, with the magnitude of associations being greater for higher intensities of physical activity.
While there is a relatively large body of evidence reporting beneficial associations between the reallocation of time from
sedentary behaviour to LPA or MVPA and cardiometabolic biomarkers among adults, there is a lack of studies among
children, adolescents, and older adults. Although some studies investigated general health, mental health, and fitness
outcomes, further investigation of these topics is warranted. In general, it seems that the strongest association with health
outcomes is observed when time is reallocated from sedentary behaviour to MVPA. Most studies did not account for sleep
time, which is a major limitation of the current evidence.
Conclusions:
The current evidence indicates that time reallocation between sleep, sedentary behaviour, LPA, and MVPA
may be associated with a number of health outcomes. Future studies should employ longitudinal designs, take into
account all movement behaviours, and examine a wider range of health, psychological, social, economic, and
environmental outcomes.
Background
During a 24-h day, each given period is spent in either
sedentary behaviour, sleeping, light-intensity physical
ac-tivity (LPA), or moderate-to-vigorous physical acac-tivity
(MVPA) [1,
2]. It has been well documented that all of
these time-use components across a 24 h spectrum may
be significantly associated with health. For instance, an
increased risk of all-cause mortality, cardiovascular
dis-ease, metabolic syndrome, type 2 diabetes mellitus
(T2D), and certain types of cancer is associated with low
levels of MVPA, large amounts of time spent in
seden-tary behaviour and inappropriate sleep duration [1
–
10].
As the duration of a day is fixed and finite, a change in
one of these movement-related behaviours will result in
a net equal and opposite change in other behaviours.
Despite this fact, most previous epidemiological studies
have analysed the associations of each behaviour in
iso-lation; that is, without taking into account the
displace-ment of the remaining co-dependent behaviours.
In recent years, there has been growing interest in
ex-ploring how all the behaviours across the energy
expend-iture spectrum influence health outcomes [1,
2,
11
–
15]. In
the seminal work by Mekary et al. [12], the isotemporal
substitution model (ISM) was proposed as a method for
evaluating the displacement of one movement-related
be-haviour time-use component with another, while allowing
adjustment for the confounding effect of the remaining
time-use components [12]. In addition to the ISM
pro-posed by Mekary et al. [12], Chastin et al. [13] and
Dumuid et al. [14] recently introduced two different
compositional isotemporal substitution models that
account for the compositional properties of time-use
data [1,
2,
15]. The findings of studies employing ISM
may improve our understanding of the
interrelation-ships between different movement-related behaviours
and their relationships to health and may also help in
shaping public health guidelines and promotion
strat-egies [11]. Whilst, for example, most public health
guidelines on physical activity recommend people to
engage in a certain amount of MVPA, they lack an
in-struction on which movement/non-movement behaviour
should preferably be displaced by MVPA [16,
17]. Studies
using ISM may enable creating specific, evidence-based
rec-ommendations on favourable reallocations of time between
sleep, sedentary behaviour, and physical activity, which has
the potential to improve the translation of research findings
on these behaviours into practice, and, consequently,
in-crease the uptake of public health messages.
A recent meta-analysis of five studies using ISM
con-cluded that reallocating sedentary time to MVPA was
significantly associated with a reduction in percentage of
body fat [18]. However, the review focused only on
stud-ies conducted among children, with markers of adiposity
being the only outcome of interest. An increasing
num-ber of ISM-based studies conducted in all age groups
have recently been published, investigating outcomes
such as adiposity, metabolic biomarkers, mental health,
chronic musculoskeletal pain, fitness, mortality, and
health-related quality of life [19
–
39].
this growing field and provide directions for its future
de-velopment. Therefore, the aim of this paper was threefold:
(i) to review and summarise findings from studies that
employed ISM in sleep, sedentary behaviour, and physical
activity research; (ii) appraise the methodological quality
of the studies; and (iii) suggest future research directions.
Methods
Protocol
The methods employed in this review were registered in
advance in the PROSPERO register of systematic reviews
(ref: CRD42017071606). The Preferred Reporting Items
for Systematic Reviews and Meta-Analyses guidelines
were followed in this systematic scoping review [40].
Search strategy
A systematic search of the following databases was
per-formed in July 2017: Academic Search Premier, CINAHL,
Health Source: Nursing/Academic Edition, MasterFILE
Premier, PsycINFO, PubMed/MEDLINE, Scopus,
SPORT-Discus, and Web of Science (including Arts & Humanities
Citation Index, Conference Proceedings Citation Index-
Sci-ence, Conference Proceedings Citation Index- Social Science
& Humanities, Science Citation Index Expanded, and Social
Sciences Citation Index). The following keywords were used
for the search:
“
physical activity
”
,
“
physical inactivity
”
,
seden-tar*, sleep*, sitting, standing, isotemporal, compositional. The
terms used for the search were combined with Boolean
oper-ators (Additional file
1). No limitations regarding publication
date were applied. The search results were downloaded and
scrutinized in the EndNote software X8 (Clarivate Analytics,
New York, USA). A secondary search was performed by: (i)
screening the reference lists of each read full-text; and (ii) by
performing forward citation tracking of the included studies
through Google Scholar and Scopus.
Inclusion criteria
To be included in the current review, studies were
re-quired to meet the following criteria: (i) the study was
published in an English-language refereed journal with
full-text availability; (ii) the study was an original
re-search (reviews were not considered) with data collected
among human participants; (iii) the study used ISM to
explore the association between reallocating relevant
movement-related behaviours (e.g., sleep, sedentary
be-haviour, LPA and/or MVPA) and health outcomes. The
World Health Organisation [41] defines health as the
ab-sence of disease and frailty, as well as complete physical,
mental, and social well-being. For the purpose of this
paper, any analysed outcome aligned with this definition
was considered a health outcome. Observational studies
conducted in any age group were considered.
Study coding and data extraction
The information extracted from the included studies
com-prised descriptive data including: the geographic location
of the study; study design; sample size; measures of sleep,
sedentary behaviour, LPA, and MVPA; the ISM used;
amount of reallocated time; adjustments for confounding;
and the main findings related to the health outcome(s).
The data were extracted and tabulated to an Excel
spread-sheet predefined for the purpose of this review.
Methodological quality appraisal
In order to assess the methodological quality of the studies
that met the inclusion criteria we used the Newcastle
–
Ottawa quality assessment scale for observational studies
[42]. The scale details can be found elsewhere [42]. The
maximum score on the scale was eight. Studies that scored
more than six points were considered of high quality,
stud-ies scoring 4
–
6 points were considered as moderate quality
and studies with scores less than four points were
consid-ered as being of low methodological quality [43].
The search and methodological quality appraisal was
performed independently by two authors of the review
(JG and EGB). In addition, two authors (JG and NS)
in-dependently performed the data extraction. Any
dis-crepancies between the reviewers were resolved with
discussion and consensus or in consultation with a
third investigator (ZP).
Results
Study selection
In total, 5859 items were screened in the study selection
process. The initial database search identified 1741
re-sults. For 88 studies the full-text was retrieved and
assessed for eligibility. Of those, 48 studies met the
clusion criteria. Forward citation tracking of the
in-cluded studies yielded another 1789 search results, of
which eight studies were included. By screening through
the reference lists of all the included studies (2329
re-sults) we identified no additional studies relevant for this
review. Therefore, the total number of studies included
in this review is 56 [12,
13,
19
–
39,
44
–
76]. The search
and study selection process is depicted in Fig.
1.
Study characteristics
Of the 56 included studies, 36 had a cross-sectional design
while 18 were prospective cohort studies. Two studies
re-ported both cross-sectional and prospective relationships.
Most of the studies were performed in the USA (n
= 21),
rate and other movement monitors were used in three
stud-ies. Most studies did not include all the relevant daily or
24-h movement-related behaviours. For example, sleep
dur-ation was included in only 22 studies. Associdur-ations were
reported for exchanged time varying from one minute to
120 min/day across the studies, with 30 min/day being the
most common reallocation. The model proposed by
Mek-ary et al. [12] was used in 53 studies. Two studies used the
model proposed by Chastin et al. [13], and one study used
the model proposed by Dumuid et al. [14].
Participants and outcomes
The sample sizes of the included studies ranged from
87 to 423,659 participants. The median number of
participants per study was 1497. Studies were
per-formed in children and youth [20,
21,
23,
25,
27,
28,
45,
49,
59,
60,
63,
64,
70], adults [12,
13,
22,
24,
30
–
33,
35,
36,
38,
39,
46,
48,
50
–
52,
54
–
56,
58,
62,
65
–
69,
71,
72,
75,
76], older adults [26,
29,
45,
48,
61] and clinical
populations [19,
34,
53,
57,
73,
74]. The outcomes were
categorised into six major categories: mortality (n
= 9
studies; Table
1), perceived health (n
= 6 studies;
Table
2), mental health (n
= 3 studies; Table
3),
adipos-ity (n
= 29 studies; Table
4), fitness (n
= 8 studies;
Table
5), cardiometabolic biomarkers (n
= 18 studies;
Table
6) and chronic diseases and conditions (n
= 6
studies; Table
7). Some of the studies assessed multiple
outcomes, therefore, the total number of exceeds 56.
Table
1
Summary
of
the
findings
from
the
studies
assessing
mortality
outcomes
(Continued)
Study
Sample
and
study
design
Measures
of
sleep,
SB,
LPA,
MVPA
Outcome
measures
Data
analysis
method/
reallocated
time
Adjustments
for
confounding
Results
Matthews
et
al.
[
66
]
Less
active
(
n
=
69,606)
and
more
active
(
n
=
85,008)
individuals
from
the
NIH-AARP
Diet
and
Health
Study,
USA;
prospective
cohort
Sleep,
SB,
exercise
and
non-exercise
activities,
LPA,
MVPA
–
self
report
All-cause
and
cardiovascular mortality
Mekary
et
al.
[
12
]/
60
min
Age,
education,
smoking
history,
sleep
duration,
overall
health,
BMI,
overall
sitting,
each
type
of
physical
activity,
and
the
sum
of
overall
sitting
and
physical
activity
time
HR
(95%
CI)
All-cause
mortality
Less
active
individuals
SB
→
exercise:
0.58
(0.54,
0.63)
SB
→
non-exercise:
0.70
(0.66,
0.74)
SB
→
household
chores:
0.80
(0.74,
0.86)
SB
→
lawn
and
garden:
0.49
(0.43,
0.56)
SB
→
daily
walking:
0.66
(0.57,
0.78)
SB
→
LPA:
0.81
(0.75,
0.88)
SB
→
MVPA:
0.58
(0.54,
0.62)
More
active
individuals
SB
→
exercise:
0.91
(0.88,
0.94)
SB
→
non-exercise:
1.00
(0.98,
1.02)
SB
→
household
chores:
1.02
(0.99,
1.05)
SB
→
lawn
and
garden:
0.97
(0.93,
1.01)
SB
→
daily
walking:
0.99
(0.94,
1.05)
SB
→
LPA:
1.04
(1.01,
1.08)
SB
→
MVPA:
0.96
(0.94,
0.98)
The
time
reallocations
for
cardiovascular
mortality
were
weaker
and
non-significant
among
less
active
men
for
household
chores,
daily
walking,
and
LPA
compared
to
women.
An
increase
in
the
risk
was
noted
w
h
en
reallocat
ing
SB
wit
h
h
o
usehold
an
d
LP
A
in
more
ac
ti
ve
men.
A
signif
ic
ant
invers
e
as
sociat
ion
fo
r
re
p
lac
in
g
SB
w
it
h
lawn
an
d
garden
ac
ti
vit
ies
in
more
ac
ti
ve
men
w
as
n
o
te
d
(th
e
sa
m
e
w
as
n
o
t
o
b
se
rv
e
d
am
ong
w
o
men).
Matthews
et
al.
[
67
]
Adults
(
n
=
4840)
from
the
2003
–
2006
National
Health
and
Nutrition
Examination
Survey,
USA;
prospective
cohort
SB,
LPA,
MVPA
–
waist-worn
accelerometers;
sleep
–
not
assessed
Mortality
risk
Mekary
et
al.
[
12
]/
60
min
Age,
sex,
race-ethnicity,
alcoho
l
consumpt
ion,
smok
ing
statu
s,
B
M
I,
self-reported
diabet
es,
corona
ry
art
ery
disea
se,
st
roke
,c
an
ce
r,
an
d
mobility
limit
at
io
n
.
HR
(95%
CI)
Overall SB
→
LPA:
0.82
(0.73,
0.92)
SB
→
MVPA:
0.58
(0.44,
0.77)
Less
active
individuals
SB
→
LPA:
0.80
(0.69,
0.92)
SB
→
MVPA:
0.37
(0.26,
0.54)
More
active
individuals
SB
→
LPA:
1.29
(0.95,
1.74)
SB
→
MVPA:
0.92
(0.60,
Table
1
Summary
of
the
findings
from
the
studies
assessing
mortality
outcomes
(Continued)
Study
Sample
and
study
design
Measures
of
sleep,
SB,
LPA,
MVPA
Outcome
measures
Data
analysis
method/
reallocated
time
Adjustments
for
confounding
Results
Schmid
et
al.
[
71
]
Adults
(
n
=
3702)
from
the
National
Health
and
Nutrition
Examination
Survey
2003
–
2004
and
2005
–
2006
cycles,
USA;
prospective
cohort
SB,
LPA,
MVPA
–
accelerometers
(location
is
not
presented);
sleep
–
not
assessed
All-cause
mortality,
CVD
mortality,
cancer
mortality
Mekary
et
al.
[
12
]/
30
min
Age,
sex,
total
accelerometer
wear
time
(model
1).
Model
2
is
additionally
adjusted
for
education,
ethnicity,
height,
smoking
,alcohol
consumption,
tot
al
d
ieta
ry
fat
int
ake,
to
tal
di
etar
y
fib
re
intake,
mobi
lity
limitations,
history
of
diabetes,
history
of
coronary
heart
disease,
history
of
congestive
heart
failure,
history
of
stroke,
history
of
cancer.
Model
3
is
the
same
as
model
2
plus
waist
circumference.
HR
(95%
CI)
All-Cause
Mortality
Model
1
SB
→
LPA:
0.85
(0.81,
0.88)
SB
→
MVPA:
0.38
(0.22,
0.63)
SB
→
LPA
and
MVPA:
0.82
(0.79,
0.85)
LPA
→
MVPA:
0.45
(0.26,
0.75)
Model
2
SB
→
LPA:
0.86
(0.83,
0.90)
SB
→
MVPA:
0.50
(0.31,
0.80)
SB
→
LPA
and
MVPA:
0.85
(0.81,
0.88)
LPA
→
MVPA:
0.58
(0.36,
0.93)
Model
3
SB
→
LPA:
0.88
(0.84,
0.92)
SB
→
MVPA:
0.51
(0.32,
0.83)
SB
→
LPA
and
MVPA:
0.86
(0.82,
0.90)
LPA
→
MVPA:
0.58
(0.36,
0.95)
CVD
Mortality
Model
1
SB
→
LPA:
0.84
(0.77,
0.90)
SB
→
MVPA:
0.25
(0.09,
0.71)
SB
→
LPA
and
MVPA:
0.80
(0.74,
0.86)
LPA
→
MVPA:
0.30
(0.11,
0.86)
Model
2
SB
→
LPA:
0.86
(0.79,
0.93)
SB
→
MVPA:
0.35
(0.14,
0.92)
SB
→
LPA
and
MVPA:
0.83
(0.77,
0.90)
LPA
→
MVPA:
0.41
(0.16,
1.08)
Model
3
SB
→
LPA:
0.88
(0.81,
0.95)
SB
→
MVPA:
0.36
(0.13,
0.95)
SB
→
LPA
and
MVPA:
0.85
(0.78,
0.92)
LPA
→
MVPA:
0.41
(0.15,
1.11)
Cancer
mortality
Model
1
SB
→
LPA:
0.91
(0.85,
0.98)
SB
→
MVPA:
0.53
(0.22,
1.31)
SB
→
LPA
and
MVPA:
0.88
(0.82,
0.96)
LPA
→
MVPA:
0.58
(0.24,
1.44)
Model
2
SB
→
LPA:
0.92
(0.85,
0.99)
SB
→
MVPA:
0.69
(0.32,
1.50)
SB
→
LPA
and
MVPA:
0.90
(0.83,
0.98)
LPA
→
MVPA:
0.75
(0.34,
Table
1
Summary
of
the
findings
from
the
studies
assessing
mortality
outcomes
(Continued)
Study
Sample
and
study
design
Measures
of
sleep,
SB,
LPA,
MVPA
Outcome
measures
Data
analysis
method/
reallocated
time
Adjustments
for
confounding
Results Model
3
SB
→
LPA:
0.93
(0.86,
1.01)
SB
→
MVPA:
0.79
(0.39,
1.62)
SB
→
LPA
and
MVPA:
0.92
(0.85,
1.00)
LPA
→
MVPA:
0.85
(0.41,
1.73)
Stamatakis
et
al.
[
72
]
Adults
(
n
=
201,129)
from
the
45
and
Up
study
from
New
South
Wales,
Australia;
prospective
cohort
Sleep,
SB,
LPA,
MVPA
–
self
report
All-cause
mortality
Mekary
et
al.
[
12
]/
60
min
Age,
sex,
educational
level,
marital
status,
residence,
BMI,
smoking
status,
self-rated
health,
receiving
help
with
daily
tasks
for
a
long-term
illness
or
disability,
prevalent
disease
at
baseline,
psychological
distress,
mutually
adjusted
for
all
activity
classes,
and
total
time
in
all
activity
classes.
HR
(95%
CI)
Sleeping
(
≤
7h
)
→
screen-time:
1.01
(0.98,
1.05)
Sleeping
(
≤
7h
)
→
sitting:
1.03
(0.99,
1.07)
Sleeping
(
≤
7h
)
→
standing:
0.98
(0.94,
1.02)
Sleeping
(
≤
7h
)
→
walking:
0.93
(0.84,
1.03)
Sleeping
(
≤
7h
)
→
MVPA:
0.90
(0.85,
0.96)
Sleeping
(
≤
7h
)
→
total
activity:
1.01
(0.98,
1.04)
Sleeping
(>
7
h)
→
screen-time:
0.95
(0.93,
0.97)
Sleeping
(>
7
h)
→
sitting:
0.96
(0.94,
0.98)
Sleeping
(>
7
h)
→
standing:
0.92
(0.9,
0.94)
Sleeping
(>
7
h)
→
walking:
0.80
(0.75,
0.86)
Sleeping
(>
7
h)
→
MVPA:
0.84
(0.81,
0.87)
Sleeping
(>
7
h)
→
total
activity:
1.06
(1.04,
1.07)
Screen-time
→
sleeping
(
≤
7
h):
0.95
(0.91,
0.99)
Screen-time
→
sleeping
(>
7
h):
1.06
(1.04,
1.09)
Screen-time
→
sitting:
1.01
(1.00,
1.03)
Screen-time
→
standing:
0.97
(0.95,
0.98)
Screen-time
→
walking:
0.87
(0.82,
0.92)
Screen-time
→
MVPA:
0.89
(0.86,
0.91)
Screen-time
→
total
activity:
1.01
(1.00,
1.02)
Sitting
→
sleeping
(
≤
7
h):
0.94
(0.90,
0.98)
Sitting
→
sleeping
(>
7
h):
1.05
(1.03,
1.07)
Sitting
→
screen-time:
0.99
(0.97,
1.00)
Sitting
→
standing:
0.95
(0.94,
Table
1
Summary
of
the
findings
from
the
studies
assessing
mortality
outcomes
(Continued)
Study
Sample
and
study
design
Measures
of
sleep,
SB,
LPA,
MVPA
Outcome
measures
Data
analysis
method/
reallocated
time
Adjustments
for
confounding
Results Sitting
→
walking:
0.86
(0.81,
0.90)
Sitting
→
MVPA:
0.88
(0.85,
0.90)
Sitting
→
total
activity:
1.02
(1.01,
1.03)
Standing
→
sleeping
(
≤
7
h):
0.99
(0.95,
1.03)
Standing
→
sleeping
(>
7
h):
1.10
(1.08,
1.13)
Standing
→
screen-time:
1.04
(1.02,
1.05)
Standing
→
sitting:
1.05
(1.04,
1.06)
Standing
→
walking:
0.90
(0.85,
0.95)
Standing
→
MVPA:
0.92
(0.89,
0.95)
Standing
→
total
activity:
0.98
(0.97,
0.99)
Walking
→
sleeping
(
≤
7
h):
1.10
(1.03,
1.18)
Walking
→
sleeping
(>
7
h):
1.17
(1.12,
1.21)
Walking
→
screen-time:
1.15
(1.09,
1.22)
Walking
→
sitting:
1.17
(1.11,
1.23)
Walking
→
standin
g
:1
.11
(1.05,
1.18)
Walking
→
MVPA:
1.02
(0.96,
1.09)
Walking
→
total
activity:
0.88
(0.83,
0.93)
MVPA
→
sleeping
(
≤
7
h):
1.07
(1.02,
1.13)
MVPA
→
sleeping
(>
7
h):
1.18
(1.14,
1.22)
MVPA
→
screen-time:
1.13
(1.09,
1.16)
MVPA
→
sitting:
1.14
(1.11,
1.18)
MVPA
→
standing:
1.09
(1.06,
1.12)
MVPA
→
walking:
0.98
(0.92,
1.04)
MVPA
→
total
activity:
0.90
(0.87,
0.92)
Wijndaele
et
al.
[
39
]
Middle-aged
adults
(
n
=
423,659)
from
the
UK
Biobank
cohort
study,
UK;
prospective
cohort
SB
(leisure
screen
time,
TV
viewing,
computer
usage)
and
leisure/home
activities
(walking
for
pleasure,
light
and
heavy
do-it-yourself),
structured
exercise,
sleep
–
self
reported
Mortality
risk
Mekary
et
al.
[
12
]/
30
min
Townsend
deprivation
index,
alcoho
l
int
ak
e,
smokin
g
st
at
u
s,
sa
lt
adding
behav
iour,
o
ily
fish
cons
u
m
pt
ion,
fruit
and
vegetable
int
ak
e,
processed
an
d
sleep
durat
ion,
chronic
disea
se
st
at
u
s,
parent
al
hist
ory
o
f
ca
rd
io
va
sc
ul
ar
d
is
e
as
e
o
r
di
ab
e
te
s
HR
(95%
CI)
Screen
time
→
leisure/home
activities:
0.95
(0.94,
0.97)
Screen
time
→
structured
exercise:
0.87
(0.84,
0.90)
Screen
time
→
walking
for
pleasure:
0.95
(0.92,
0.98)
Scr
een
tim
e
→
lig
h
t
d
o-
it-yo
u
rs
el
f:
0.97
(0
.94
,1
.00)
Screen
time
→
heavy
do-it-yourself:
0.93
(0.90,
0.96)
Screen
time
→
strenuous
sports:
0.87
(0.79,
Table
1
Summary
of
the
findings
from
the
studies
assessing
mortality
outcomes
(Continued)
Study
Sample
and
study
design
Measures
of
sleep,
SB,
LPA,
MVPA
Outcome
measures
Data
analysis
method/
reallocated
time
Adjustments
for
confounding
Results Screen
time
→
other
exercises:
0.88
(084,
0.91)
TV
viewing
→
leisure/home
activities:
0.94
(0.93,
0.96)
TV
viewing
→
structured
exercise:
0.87
(0.84,
0.90)
TV
viewing
→
walking
for
pleasure:
0.94
(0.92,
0.97)
TV
viewing
→
light
do-it-yourself:
0.96
(0.94,
0.99)
TV
viewing
→
heavy
do-it-yourself:
0.91
(0.89,
0.95)
TV
viewing
→
strenuous
sports:
0.86
(0.79,
0.95)
TV
viewing
→
other
exercises:
0.87
(0.83,
0.91)
Men Computer
usage
→
leisure/home
activities:
0.98
(0.96,
1.00)
Computer
usage
→
structured
exercise:
0.89
(0.85,
0.93)
Computer
usage
→
walking
for
pleasure:
0.98
(0.95,
1.01)
Computer
usage
→
lig
h
t
d
o
-it
-y
o
u
rs
el
0.99
(0.96,
1.02)
Computer
usage
→
heavy
do-it-yourself:
0.97
(0.93,
1.00)
Computer
usage
→
strenuous
sports:
0.90
(0.81,
0.99)
Computer
usage
→
other
exercises:
0.88
(0.84,
0.93)
Women Computer
usage
→
leisure/home
activities:
0.94
(0.91,
0.97)
Computer
usage
→
structured
exercise:
0.90
(0.84,
0.96)
Computer
usage
→
walking
for
pleasure:
0.93
(0.89,
0.98)
Computer
usage
→
lig
h
t
d
o
-it
-y
o
u
rs
el
0.99
(0.94,
1.04)
Computer
usage
→
heavy
do-it-yourself:
0.84
(0.76,
0.94)
Computer
usage
→
strenuous
sports:
0.88
(0.73,
1.06)
Computer
usage
→
other
exercises:
0.90
(0.84,
0.97)
SB
sedentary
behaviour,
LPA
light
intensity
physical
activity,
MVPA
moderate-to-vigorous
intensity
physical
activity,
MPA
moderate
intensity
physical
activity,
VPA
vigorous
intensity
physical
activity,
CVD
cardiovascular
disease,
BMI
body
mass
index,
MET
metabolic
equivalent
of
task,
HR
hazard
ratio,
CI
confidence
Table
2
Summary
of
the
findings
from
the
studies
assessing
perceived/general
health
status
Study
Sample
and
study
design
Measures
of
sleep,
SB,
LPA,
MVPA
Outcome
measures
Data
analysis
method/
reallocated
time
Adjustments
for
confounding
Results
Balboa-Castillo
et
al.
[
45
]
Older
adults
(
n
=
1097),
Spain;
prospective
cohort
Sleep,
SB,
housework,
leisure-time
physical
activity
(LPA,
MVPA)
–
self-report
HRQoL
Mekary
et
al.
[
12
]/
60
min
Age,
sex,
educational
level,
size
of
municipality
of
residence,
consumption
of
tobacco,
consumption
of
alcohol,
self-reported
diseases
diagnosed
by
a
physician,
score
on
appropriate
SF-36
scale
in
2003,
number
of
hours
lying
or
sleeping,
and
total
number
of
hours
spent
in
all
types
of
physical
activity.
β
(95%
CI)
Physical
functioning
SB
↔
LPA:
3.41
(0.81,
6.00)
SB
↔
MVPA:
4.14
(1.92,
6.37)
SB
↔
housework:
1.04
(0.25,
1.85)
Physical
role
SB
↔
LPA:
10.61
(6.08,
15.13)
SB
↔
MVPA:
1.19
(
−
2.71,
5.10)
SB
↔
housework:
1.68
(0.27,
3.01)
Bodily
pain
SB
↔
LPA:
4.22
(1.19,
7.26)
SB
↔
MVPA:
2.93
(0.31,
5.56)
SB
↔
housework:
1.05
(0.10,
1.99)
General
health
SB
↔
LPA:
2.44
(0.66,
4.23)
SB
↔
MVPA:
−
0.06
(
−
1.61,
1.50)
SB
↔
housework:
0.31
(
−
0.24,
0.87)
Vitality SB
↔
LPA:
4.14
(1.58,
6.71)
SB
↔
MVPA:
2.51
(0.29,
4.73)
SB
↔
housework:
0.67
(
−
0.13,
1.47)
Social
functioning
SB
↔
LPA:
4.80
(1.84,
7.77)
SB
↔
MVPA:
2.06
(
−
0.47,
4.61)
SB
↔
housework:
1.08
(0.14,
2.00)
Emotional
role
SB
↔
LPA:
4.93
(0.98,
8.87)
SB
↔
MVPA:
1.03
(
−
2.40,
4.46)
SB
↔
housework:
1.21
(
−
0.03,
2.45)
Mental
health
SB
↔
LPA:
2.51
(0.17,
4.86)
SB
↔
MVPA:
0.53
(
−
1.51,
2.57)
SB
↔
housework:
0.83
(0.09,
1.57)
Buman
et
al.
[
47
]O
ld
er
ad
u
lts
(
n
=
862)
from
the
2005
–
2007
Se
n
ior
N
eig
hborhood
Qu
ality
o
f
Li
fe
Stu
dy
,
USA;
pr
os
p
ective
cohort
SB,
MVPA
(“
high-light
”
physical
activity
and
“
low-li
ght
”
phys
ic
al
act
ivit
y)
–
wai
st-worn
ac
cel
erometers;
sl
ee
p
–
not
assessed
Physical
health
and
psychosocial
well-being
factors
Mekary
et
al.
[
12
]/
30
min
Age,
sex,
race,
educational
status,
marital
status,
senior
housing
status,
current
smoking
status
and
walkability
index.
β
(95%
CI)
Physical
health
SB
→
“
low-light
”
physical
activity:
0.07
(0.04,
0.09)
SB
→
“
high-light
”
physical
activity:
0.30
(0.19,
0.42)
SB
→
MVPA:
0.34
(0.23,
0.44)
“
Low-light
”
physical
activity
→
SB:
−
0.07
(
−
0.09,
−
0.04)
“
Low-light
”
physical
activity
→
“
high-light
”
physical
activity:
0.24
(0.11,
0.36)
“
Low-light
”
physical
activity
→
MVPA:
0.21
(0.10,
0.32)
“
High-light
”
physical
activity
→
SB:
−
0.30
(
−
0.42,
−
0.19)
“
High-light
”
physical
activity
→
“
low-light
”
physical
activity:
−
0.24
(
−
0.36,
−
0.11)
“
High-light
”
physical
activity
→
MVPA:
−
0.27
(
−
0.55,
Table
2
Summary
of
the
findings
from
the
studies
assessing
perceived/general
health
status
(Continued)
Study
Sample
and
study
design
Measures
of
sleep,
SB,
LPA,
MVPA
Outcome
measures
Data
analysis
method/
reallocated
time
Adjustments
for
confounding
Results MVPA
→
SB:
−
0.17
(
−
0.22,
−
0.12)
MVPA
→
“
low-light
”
physical
activity:
−
0.10
(
−
0.16,
−
0.05)
MVPA
→
“
high-light
”
physical
activity:
0.14
(
−
0.06,
0.27)
Psychosocial
well-being
SB
→
“
low-light
”
physical
activity:
0.01
(
−
0.02,
0.04)
SB
→
“
high-light
”
physical
activity:
0.24
(0.12,
0.36)
SB
→
MVPA:
−
0.02
(
−
0.13,
0.10)
“
Low-light
”
physical
activity
→
SB:
−
0.01
(
−
0.04,
0.02)
“
Low-light
”
physical
activity
→
“
high-light
”
physical
activity:
0.24
(0.10,
0.37)
“
Low-light
”
physical
activity
→
MVPA:
−
0.03
(
−
0.15,
0.08)
“
High-light
”
physical
activity
→
SB:
−
0.24
(
−
0.36,
−
0.12)
“
High-light
”
physical
activity
→
“
low-light
”
physical
activity:
−
0.24
(
−
0.37,
−
0.10)
“
High-light
”
physical
activity
→
MVPA:
−
0.50
(
−
0.81,
−
0.19)
MVPA
→
SB:
0.01
(
−
0.05,
0.07)
MVPA
→
“
low-light
”
physical
activity:
0.02
(
−
0.04,
0.08)
MVPA
→
“
high-light
”
physical
activity:
0.25
(0.10,
0.41)
Fanning
et
al.
[
26
]
Low-active
healthy
older
adults
(
n
=
247),
USA;
cross-sectional
SB
,L
PA
,M
VP
A
–
wa
ist
-worn
ac
ce
lero
met
e
rs;
sleep
–
self
repo
rt
Self-regulation, spatial
working
memory,
task-switching
Mekary
et
al.
[
12
]/
30
min
Age,
sex,
race.
β
(standard
error)
Self-regulation
–
total
score
SB
→
LPA:
0.60
(0.38)
SB
→
MVPA:
1.81
(0.80)
SB
→
sleep:
1.29
(0.39)
Self-regulation
–
self-monitoring
SB
→
LPA:
0.15
(0.09)
SB
→
MVPA:
0.27
(0.19)
SB
→
sleep:
0.23
(0.09)
Self-regulation
–
goal
setting
SB
→
LPA:
0.11
(0.08)
SB
→
MVPA:
0.27
(0.18)
SB
→
sleep:
0.32
(0.09)
Self-regulation
–
social
support
SB
→
LPA:
0.09
(0.06)
SB
→
MVPA:
0.08
(0.13)
SB
→
sleep:
0.18
(0.07)
Spatial
working
memory
–
item
2
reaction
time
SB
→
LPA:
−
0.16
(6.20)
SB
→
MVPA:
−
4.46
(13.09)
SB
→
sleep:
1.13
(6.50)
Spatial
working
memory
–
item
3
reaction
time
SB
→
LPA:
−
0.19
(6.18)
SB
→
MVPA:
−
5.60
Table
2
Summary
of
the
findings
from
the
studies
assessing
perceived/general
health
status
(Continued)
Study
Sample
and
study
design
Measures
of
sleep,
SB,
LPA,
MVPA
Outcome
measures
Data
analysis
method/
reallocated
time
Adjustments
for
confounding
Results SB→
sleep:
−
1.11
(6.49)
Spatial
working
memory
–
item
4
reaction
time
SB
→
LPA:
−
5.87
(6.57)
SB
→
MVPA:
−
4.61
(13.88)
SB
→
sleep:
−
0.21
(6.89)
Spatial
working
memory
–
item
2
accuracy
SB
→
LPA:
−
0.01
(0.00)
SB
→
MVPA:
0.03
(0.01)
SB
→
sleep:
−
0.00
(0.01)
Spatial
working
memory
–
item
3
accuracy
SB
→
LPA:
−
0.01
(0.01)
SB
→
MVPA:
0.02
(0.01)
SB
→
sleep:
−
0.00
(0.01)
Spatial
working
memory
–
item
4
accuracy
SB
→
LPA:
−
0.00
(0.01)
SB
→
MVPA:
0.01
(0.01)
SB
→
sleep:
−
0.00
(0.01)
Task-switching
–
single
reaction
time
SB
→
LPA:
7.45
(5.01)
SB
→
MVPA:
−
23.12
(10.63)
SB
→
sleep:
4.12
(5.31)
Task-switching
–
mixed-repeat
reaction
time
SB
→
LPA:
5.00
(6.24)
SB
→
MVPA:
−
27.06
(13.24)
SB
→
sleep:
−
12.2
(6.61)
Task-switching
–
mixed-switch
reaction
time
SB
→
LPA:
1.04
(8.23)
SB
→
MVPA:
−
28.24
(17.45)
SB
→
sleep:
−
17.21
(8.71)
Task-switching
–
local
switch
cost
reaction
time SB→
LPA:
−
3.93
(5.98)
SB
→
MVPA:
−
0.40
(12.67)
SB
→
sleep:
−
5.19
(6.33)
Task-switching
–
global
switch
cost
reaction
time SB→
LPA:
−
2.84
(6.39)
SB
→
MVPA:
−
1.54
(13.55)
SB
→
sleep:
−
16.86
(6.77)
Task-switching
–
single
accuracy
SB
→
LPA:
−
0.00
(0.00)
SB
→
MVPA:
0.01
(0.01)
SB
→
sleep:
−
0.01
(0.00)
Task-switching
–
mixed-repeat
accuracy
SB
→
LPA:
−
0.01
(0.01)
SB
→
MVPA:
0.01
(0.01)
SB
→
sleep:
−
0.01
(0.01)
Task-switching
–
mixed-switch
accuracy
SB
→
LPA:
−
0.01
(0.01)
SB
→
MVPA:
0.01
(0.01)
SB
→
sleep:
−
0.01
(0.01)
Task-switching
–
local
switch
Table
2
Summary
of
the
findings
from
the
studies
assessing
perceived/general
health
status
(Continued)
Study
Sample
and
study
design
Measures
of
sleep,
SB,
LPA,
MVPA
Outcome
measures
Data
analysis
method/
reallocated
time
Adjustments
for
confounding
Results SB→
LPA:
0.00
(0.00)
SB
→
MVPA:
0.00
(0.01)
SB
→
sleep:
−
0.00
(0.00)
Task-switching
–
global
switch
accuracy
SB
→
LPA:
0.00
(0.01)
SB
→
MVPA:
−
0.00
(0.01)
SB
→
sleep:
0.01
(0.01)
Loprinzi
et
al.
[
65
]
Adults
(
n
=
5377)
from
the
2003
–
2006
National
Health
and
Nutrition
Examination
Survey,
USA;
prospective
cohort
SB
,L
PA
,M
VP
A
–
wa
ist
-worn
ac
ce
lero
met
e
rs;
sleep
–
no
t
as
se
sse
d
HRQoL
Mekary
et
al.
[
12
]/
30
min
Age,
sex,
race
–
ethnicity,
BMI,
smoking
status
and
education
β
(95%
CI)
HRQoL SB→
LPA:
0.92
(0.85,
1.01)
SB
→
MVPA:
0.28
(0.13,
0.58)
LPA
→
SB:
1.07
(0.98,
1.17)
LPA
→
MVPA:
0.30
(0.14,
0.65)
MVPA
→
SB:
3.54
(1.70,
7.40)
MVPA
→
LPA:
3.3
(1.54,
7.02)
Vallance
et
al.
[
34
]
Non-Hodgkin
lymphoma
survivors
(
n
=
149)
from
the
Western
Australian
Cancer
Registry,
Australia;
cross-sectional
SB
bouts
and
non-bouts,
standing,
LPA,
MVPA
bouts
and
non-bouts
–
waist-worn
accelerometers;
sleep
–
self
report
Fatigue
and
HRQoL
Mekary
et
al.
[
12
]/
30
min
Sex,
non-Hodgkin
lymphoma
type
and
time
since
diagnosis,
country
of
birth,
highest
level
of
education,
working
status,
co
morbidit
y
an
d
non-Ho
d
g
ki
n
ly
mph
o
ma
trea
tmen
t
β
(95%
CI)
Fatigue Sleep
↔
SB
bouts:
0.1
(
−
1.0,
1.1)
Sleep
↔
SB
non-bouts:
0.6
(
−
0.5,
1.8)
Sleep
↔
LPA:
0.3
(
−
0.8,
1.4)
Sleep
↔
MVPA
non-bouts:
1.2
(
−
2.4,
4.8)
Sleep
↔
MVPA
bouts:
5.7
(1.8,
9.7)
SB
bouts
↔
SB
non-bouts:
0.5
(
−
0.3,
1.4)
SB
bouts
↔
LPA:
0.2
(
−
0.5,
0.9)
SB
bouts
↔
MVPA
non-bouts:
1.1
(
−
2.3,
4.5)
SB
bouts
↔
MVPA
bouts:
5.7
(1.6,
9.7)
SB
non-bouts
↔
LPA:
−
0.3
(
−
1.5,
0.8)
SB
non-bouts
↔
MVPA
non-bouts:
0.6
(
−
2.6,
3.9)
SB
non-bouts
↔
MVPA
bouts:
5.1
(1.0,
9.3)
LPA
↔
MVPA
non-bouts:
0.9
(
−
2.9,
4.8)
LPA
↔
MVPA
bouts:
5.5
(1.5,
9.5)
MVPA
non-bouts
↔
MVPA
bouts:
4.5
(
−
1.4,
10.5)
HRQoL Sleep
↔
SB
bouts:
−
0.6
(
−
1.9,
0.8)
Sleep
↔
SB
non-bouts:
−
0.2
(
−
1.7,
1.3)
Sleep
↔
LPA:
−
0.6
(
−
2.1,
0.9)
Sleep
↔
MVPA
non-bouts:
0.0
(
−
4.7,
4.8)
Sleep
↔
MVPA
bouts:
4.5
(
−
0.8,
9.7)
SB
bouts
↔
SB
non-bouts:
0.4
(
−
0.8,
1.5)
SB
bouts
↔
LPA:
−
0.1
(
−
0.9,
0.8)
SB
bouts
↔
MVPA
non-bouts:
0.6
(
−
3.9,
5.1)
SB
bouts
↔
MVPA
bouts:
5.0
(
−
0.4,
10.4)
SB
non-bouts
↔
LPA:
−
0.4
(
−
1.9,
Table
2
Summary
of
the
findings
from
the
studies
assessing
perceived/general
health
status
(Continued)
Study
Sample
and
study
design
Measures
of
sleep,
SB,
LPA,
MVPA
Outcome
measures
Data
analysis
method/
reallocated
time
Adjustments
for
confounding
Results SB
non-bouts
↔
MVPA
non-bouts:
0.2
(
−
4.1,
4.5)
SB
non-bouts
↔
MVPA
bouts:
4.6
(
−
0.8,
10.1)
LPA
↔
MVPA
non-bouts:
0.6
(
−
4.4,
5.7)
LPA
↔
MVPA
bouts:
5.1
(
−
0.2,
10.4)
MVPA
non-bouts
↔
MVPA
bouts:
4.4
(
−
3.5,
12.3)
Van
Roekel
et
al.
[
73
]
C
olorect
al
can
ce
r
su
rv
ivors
(
n
=
1
45)
fro
m
th
e
Energy
for
lif
e
after
Co
loRectal
ca
ncer
stud
y,
Netherla
nds;
cr
o
ss
-s
e
ct
io
n
al
Sleep,
SB,
standing,
physical
activity
(defined
as
>
1.5
METs)
–
triaxial
MOX
activity
monitor
HRQoL
Mekary
et
al.
[
12
]/
60
min
Age,
sex,
number
of
comorbidities,
smoking
status,
time
since
diagnosis,
cancer
stag
e,
BM
I,
p
e
rc
ei
ve
d
d
ef
ic
ie
n
cy
in
social
support
score,
chemotherap
y
received
,s
toma,
tumor
su
b
site,
edu
cat
ion
level
and
h
aving
a
p
artner.
β
(95%
CI)
Global
quality
of
life
SB
→
standing:
1.0
(0.7,
1.5)
SB
→
physical
activity:
1.2
(0.6,
2.5)
Standing
→
physical
activity:
1.2
(0.5,
3.1)
Physical
functioning
SB
→
standing:
1.1
(0.7,
1.7)
SB
→
physical
activity:
1.7
(0.8,
3.7)
Standing
→
physical
activity:
1.5
(0.5,
4.3)
Role
functioning
SB
→
standing:
1.2
(0.8,
1.8)
SB
→
physical
activity:
0.7
(0.3,
1.5)
Standing
→
physical
activity:
0.6
(0.2,
1.6)
Social
functioning
SB
→
standing:
1.2
(0.8,
1.8)
SB
→
physical
activity:
0.6
(0.3,
1.3)
Standing
→
physical
activity:
0.5
(0.2,
1.4)
Disability SB→
standing:
0.6
(0.4,
0.9)
SB
→
physical
activity:
0.9
(0.4,
1.9)
Standing
→
physical
activity:
1.6
(0.6,
4.2)
Fatigue SB→
standing:
1.0
(0.6,
1.4)
SB
→
physical
activity:
0.6
(0.3,
1.3)
Standing
→
physical
activity:
0.7
(0.3,
1.7)
Depression SB→
standing:
1.1
(0.7,
1.6)
SB
→
physical
activity:
0.8
(0.4,
1.6)
Standing
→
physical
activity:
0.8
(0.3,
1.9)
Anxiety SB→
standing:
1.1
(0.7,
1.5)
SB
→
physical
activity:
0.7
(0.4,
1.5)
Standing
→
physical
activity:
0.7
(0.3,
1.7)
SB
sedentary
behaviour,
LPA
light
intensity
physical
activity,
MVPA
moderate-to-vigorous
intensity
physical
activity,
MPA
moderate
intensity
physical
activity,
HRQoL
health-related
quality
of
life,
MET
metabolic
equivalent
of
task,
CI
confidence
Table
3
Summary
of
the
findings
from
the
studies
assessing
mental
health
outcomes
(Continued)
Study
Sample
and
study
d
e
sign
Measures
of
slee
p,
SB,
LPA
,
MVPA
O
utcome
measures
Data
analy
sis
method
/reall
ocated
time
Adjustment
s
for
conf
oundin
g
Resu
lts
occ
u
pa
tion,
wo
rkin
g
sta
tus
and
educational
level.
TV
watchin
g
→
running
:
0.
76
(0.45
,
1.29)
TV
watchin
g
→
othe
r
activities:
0.93
(0.85
,
1.01)
TV
watchin
g
→
tot
al
disc
retionary
time:
1.03
(1.02
,
1.05)
Easy
wal
king
→
TV
wat
chin
g:
0.73
(0.42
,
1.26)
Easy
wal
king
→
average
wal
king:
0.65
(0.37
,
1.12)
Easy
wal
king
→
brisk
walki
ng:
0.56
(0.32
,
0.96)
Easy
wal
king
→
running
:
0.56
(0.26
,
1.19)
Easy
wal
king
→
other
activ
ities:
0.68
(0.39
,
1.18)
Easy
wal
king
→
total
disc
retionary
ti
me:
1.42
(0.82
,
2.45)
Average
wal
king
→
TV
watchin
g:
1.13
(0.99
,
1.29)
Average
wal
king
→
easy
wal
king:
1.49
(0.82
,
2.71)
Average
wal
king
→
brisk
wal
king:
0.86
(0.74
,
0.99)
Average
wal
king
→
running
:
0.86
(0.50
,
1.48)
Average
wal
king
→
other
activ
ities:
1.05
(0.89
,
1.24)
Average
wal
king
→
total
dis
cretionary
time:
0.91
(0.80,
1.04)
Brisk
walki
ng
→
TV
wat
ching:
1.32
(1.18
,
1.47)
Brisk
walki
ng
→
eas
y
walkin
g:
1.73
(0.96
,
3.13)
Brisk
walki
ng
→
ave
rage
wal
king:
1.16
(1.00
,
1.34)
Brisk
walki
ng
→
runn
ing:
1.00
(0.58
,
1.72)
Brisk
walki
ng
→
othe
r
activities:
1.22
(1.05
,
1.42)
Brisk
walki
ng
→
tot
al
activ
ity:
0.
79
(0.70
,
0.88)
Runnin
g
→
TV
watchi
ng:
1.19
(0.74
,
1.91)
Runnin
g
→
easy
walkin
g:
1.56
(0.74
,
3.32)
Runnin
g
→
ave
rage
walkin
g:
1.05
(0.64
,