Atomistic computer simulation of the clay–fluid interface
in colloidal laponite
R. J. F. Leote de Carvalho and N. T. Skipper
Department of Physics and Astronomy, University College London, Gower Street, London WC1E 6BT, United Kingdom
共Received 27 September 2000; accepted 4 December 2000兲
Monte Carlo and molecular dynamics computer simulations have been used to study the structure and dynamics of the interlayer aqueous solution in a colloidal sodium laponite clay at 277 K. The system studied has a clay–clay spacing of 34.06 Å, and contains 1200 interlayer water molecules and 24 sodium counterions. The density profiles for interlayer species show two distinct layers of surface water as one moves away from the clay particles. The innermost of these layers is strongly oriented to form hydrogen bonds to the surface oxygen atoms. Radially averaged pair distributions have been calculated as a function of distance from the clay surfaces, and show that throughout our system the water structure is significantly perturbed from the bulk. In particular, we observe an increase in the second nearest-neighbor oxygen–oxygen distance, similar to that reported for low-density water at 268 K关A. K. Soper and M. A. Ricci, Phys. Rev. Lett. 84, 2881共2000兲兴. The majority of the sodium counterions are fully hydrated by six water molecules. These hydrated ions have a strong tendency to remain close to the solid surfaces, as so-called ‘‘outer-sphere’’ complexes. However, we also observe cations further from the clay sheets, in the diffuse layer. Diffusion of water and cations in the plane of the clay sheets is comparable to that in the bulk, but is significantly reduced normal to the clay sheets. © 2001 American Institute of Physics.
关DOI: 10.1063/1.1343839兴
I. INTRODUCTION
Molecular level understanding of the properties of aque-ous solutions close to charged solid surfaces, in the electrical double-layer, is of fundamental importance for many pro-cesses. These include colloidal interactions, membrane for-mation and stability, protein folding, electrode reactions, and mineral formation and dissolution. The conventional picture of the electrical double-layer region is based on the primitive model, in which the solvent is treated as a dielectric continuum.1,2 Electrostatic interactions among the ions and surfaces then give rise to so-called condensed 共Stern兲 and diffuse共Gouy–Chapman兲ion distributions. However, recent experiments have shown that for surface–surface separations less than 30 Å the molecular nature of water and the hy-drated species dominates the structure and interactions.3–7In this regime atomistic level computer simulations can play a very valuable role by providing detailed portraits of the in-terfacial aqueous phase.
Computer studies of aqueous solutions at charged metal-lic surfaces have already made significant contributions to our understanding of electrochemical systems.2,4,8–11 In ad-dition, work on hydrated clays has resolved many key prob-lems concerning hydration and speciation at charged silicate surfaces.12–14 However, for practical reasons, most of this previous research has focused on surfaces separated by only a few molecular layers of water. There is now an opportunity to extend this approach to systems at the limit of validity for primitive models.
In this paper we report on computer simulations of hy-drated sodium laponite clay with a clay layer spacing in
ex-cess of 30 Å, using models and methodology developed dur-ing previous studies of lower clay hydrates. We analyze the interlayer structure and diffusion parallel and perpendicular to the clay sheets. In addition, we calculate the density of interlayer water as a function of distance from the clay sheets. We observe two distinct layers of surface water as one moves away from the clay particles. However, structural analysis shows that throughout our system water is signifi-cantly perturbed from the bulk. Cations are predominantly present as fully hydrated ‘‘outer-sphere’’ complexes,15 lo-cated approximately 4.25 Å from the nearest clay surface.
II. INTERACTION POTENTIALS AND METHODOLOGY
A. Simulation box
The simulation box contains a 42.24 by 36.56 Å slab of laponite clay, 24 sodium counterions, and 1200 interlayer water molecules 共Fig. 1兲. The overall equilibrium clay–clay spacing is 34.06⫾0.08 Å. Periodic boundary conditions rep-licate the simulation box in three dimensions, creating a stack of infinite parallel clay layers with water and sodium counterions free to move in the interlayer space.
Laponite is a synthetic smectite clay that resembles the natural clay hectorite in structure and composition.16Atomic positions and charges of the unit cell used to create our slab of laponite are given in Table I. This cell was replicated through a point of inversion at the origin, and converted to a rhombohedral unit. The composition of this unit is on aver-age
关Mg5.25Li0.75兴Si8O20共OH兲4Na0.75. 共1兲
3727
It was then repeated 32 times, 8 times along the x-direction and 4 times along the y-direction. The clay sheet in the simu-lation box therefore contains a total of 1344 atom sites. The overall negative charge arises from substitution of lithium for magnesium among the octahedrally coordinated cations that are located at the midplane of the clay sheets. These sites were selected to lie as far apart as possible, thereby produc-ing a regular rather than random array of lithium atoms. The overall charge of the simulation slab is⫺24e, so the charge density is 0.24 cm⫺2.
B. Interaction potentials
The interaction potentials used here are the ones of Boek
et al.17 These are based on the TIP4P model of water18–20
which represents water as a rigid molecule with four inter-action sites. Site–site interinter-actions involve Coulomb and Lennard-Jones 6–12 terms,
vi j共ri j兲⫽ qiqj
ri j ⫺ Ai j
ri j6 ⫹ Bi j
ri j12. 共2兲
atoms, and the oxygen are rMO⫽0.15 Å and rHO⫽0.9572 Å, respectively. The angle HOHdis fixed at 104.52°.
The water–sodium interactions used in the simulations are the ones incorporated into the ‘‘OPLS’’ set of interaction potentials,19and are compatible with the TIP4P model.17The clay sheets were then adapted to the TIP4P-OPLS models by placing interaction sites on the oxygen atoms, with Lennard-Jones parameters equal to those in TIP4P water. Partial charges are assigned to clay sites as shown in Table I.
C. Simulation runs
The starting configuration was prepared by placing so-dium counterions 8 Å from the lithium sites in the clay sheet. Water molecules were placed randomly in the remaining in-terlayer space, but at least 1.5 Å from the nearest site. The starting clay layer spacing was 34 Å. A constant stress Monte Carlo preequilbration run of 106 iterations was then conducted at 277 K and with a pressure of 1⫻105Pa applied normal to the clay sheets共in the z-direction兲.21 Equilibration was conceded when total energy and clay layer spacing os-cillated about their mean values in the normal way. The equilibrated system was then passed on for molecular dy-namics.
Molecular dynamics simulations were conducted using the code MOLDY.22 We used a time step of 0.0005 ps, and allowed the system to equilibrate for a further 5⫻104 time steps. During equilibration, a Nose´-Hoover thermostat was coupled to the system. For this purpose the temperature/ velocities were rescaled every 250 time steps, using the in-stantaneous kinetic energy, for each species individually.
During this part of the simulation we again applied a uniaxial stress 1⫻105Pa perpendicular to the clay sheets, but no change in z¯ was noted.
During the production molecular dynamics run the sys-tem sampled the (N,V,E) ensemble. In total, we present results from 2⫻105 time steps of 0.0005 ps, in other words 100 ps. No velocity rescaling was required during this pe-riod. The structure of the interlayer fluid was recorded every 100 time steps, from which we obtained average samples.
Long-range Coulomb interactions were handled using the Ewald sum technique in three dimensions.22The param-eters used in the Ewald sum were optimized byMOLDY: the reciprocal space cutoff was set to 1.82 Å⫺1 and the real/ reciprocal partition parameter, ␣⫽0.268 Å⫺1. An interaction cutoff of 12.64 Å was used. MOLDY does not follow the minimum image convention. Instead, the list of neighboring cells includes all periodic images of a particle which are within the interaction cutoff.
In order to calculate the nominal volume occupied by the interlayer fluid, a control simulation of dry laponite was car-ried out by simply removing all water molecules from the system. A Monte Carlo simulation at constant p⫽105Pa and temperature T⫽277 K gave a dry clay–clay spacing of 9.50 Å, and an equilibrium volume V(0)⫽14 670.8 Å3 for the simulation box, which compares to V(1200)⫽52 598.7 Å3 for the hydrated laponite. The apparent average density of water in our laponite can then be calculated using the effec-tive volume V(1200)⫺V(0). This procedure gives 0.95 ⫾0.02 g cm⫺3 for the interlayer water. However, we note here that the simulated spacing for dry clay is rather low, due to the ability of the sodium counterions to sink into the hex-agonal ring sites on the clay surface. If we take the experi-mental value of 10.28 Å for a dry clay of low tetrahedral charge,23 the water density is then 0.98⫾0.02 g/cm⫺3.
A molecular dynamics simulation of bulk water at T ⫽277 K and p⫽105Pa was also performed with 256 water molecules interacting via the TIP4P potential. The system was first allowed to relax into the appropriate volume, lead-ing to an equilibrium density water⫽1.02⫾0.01 g cm⫺3.20 The equilibration was followed by a production run of 100 ps, again 2⫻105 time steps of 0.0005 ps. This allowed us to extract structural and dynamical information for comparison.
III. RESULTS AND DISCUSSION
We present results for the structure and dynamics of the interlayer solution, both parallel and normal to the plane of the clay sheets. Data are presented for single particle density profiles关␣(x), ␣( y ) and␣(z)兴, and self-diffusion coeffi-cients (D␣). In addition, we calculate pair distribution func-tions for interlayer species关g␣(r)兴, as a function of a par-ticle’s distance from the clay surfaces.
A. Density profiles
The density profiles normal to the clay sheets were cal-culated from the 2000 interlayer configurations dumped dur-ing the production run, usdur-ing the equation
␣共z兲⫽
1
Axy dn␣共z兲
dz , 共3兲
TABLE I. Atomic positions and respective effective local charges in the unit cell of laponite. The local charges shown were used in Eq.共2兲for the pair interactions.aIn the simulation cell shown in Fig. 1, one in four octa-hedral Mg sites are replaced by Li, with a charge of⫹1.00e.
Atom x共Å兲 y共Å兲 z共Å兲 q(e)
O共surface兲 2.64 0.00 3.28 ⫺0.80
O共surface兲 1.32 2.28 3.28 ⫺0.80
O共surface兲 3.96 2.28 3.28 ⫺0.80
O共OH兲 0.00 0.00 1.06 ⫺1.52
H共OH兲 0.00 0.00 2.0176 ⫹0.52
Si 2.64 1.52 2.73 ⫹1.20
Si 5.28 3.05 2.73 ⫹1.20
O共apical兲 2.64 1.52 1.06 ⫺1.00
O共apical兲 5.28 3.05 1.06 ⫺1.00
Mg 1.76 0.00 0.00 ⫹2.00
Mg ⫺0.88 1.52 0.00 ⫹2.00
Mg ⫺0.88 ⫺1.52 0.00 ⫹2.00
aReference 17.
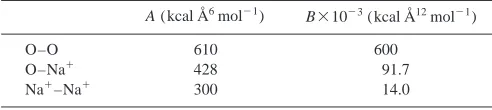
TABLE II. Lennard-Jones parameters used in Eq.共2兲for pair interactions.a
A (kcal Å6mol⫺1)
B⫻10⫺3(kcal Å12mol⫺1)
O–O 610 600
O–Na⫹ 428 91.7
Na⫹–Na⫹ 300 14.0
with␣⫽O, H, and Na⫹. Axy⫽1544.29 Å2 is the area of the simulation box in the xy -plane and dn␣(z) the number of atoms of species␣between planes z and z⫹dz. The density
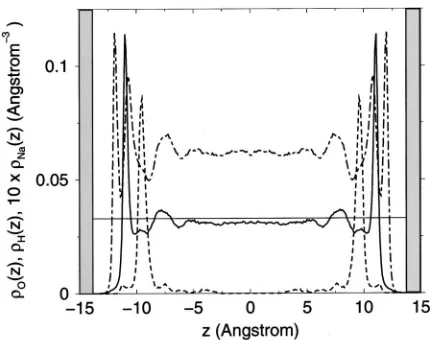
profiles for the interlayer oxygen and hydrogen and sodium cations, O(z), H(z), and Na(z), respectively, are plotted in Fig. 2. The latter was magnified by a factor of 10 for better visualization. The z-axis on these figures represents the dis-tance to the midplane between two parallel opposite clay layers. The surface oxygens of the clay sheets therefore lie at ⫾13.75 Å.
The density profileH(z) exhibits two large peaks near the clay surface, at兩z兩⫽11.9 and 10.7 Å. TheO(z) shows one large peak, also near the clay surface, at 兩z兩⫽11.0 Å, between the two large hydrogen peaks. A smaller oxygen peak occurs at 兩z兩⫽7.5 Å, and is coincident with a similar feature inH(z). We therefore conclude that the first layer of water is hydrogen-bonded to the surface oxygen atoms of the clay surface. The second molecular layer of water is not strongly oriented with respect to the clay sheets, and there-fore acts as an intermediary between the surface and the bulk. This picture is consistent with those derived from pre-vious simulations of clay systems,12–14 and negatively charged metal surfaces.2,4,8–11
The sodium density profileNa(z) has a dominant peak at 兩z兩⫽9.5 Å, a distance of 4.25 Å from the clay surface. These cations are fully hydrated by six water molecules共see Sec. III B兲, and are termed outer-sphere complexes.15In spite of their proximity to the clay surface, these cations are not bound to any particular lithium site, as we will see from the diffusion coefficients calculated in Sec. III C. A relatively small fraction of sodiums exist as partially hydrated ‘‘inner-sphere’’ complexes, in direct contact with the clay surface and directly above a lithium atom. Further from the clay sheets we see the beginnings of a diffuse population of coun-terions. The distribution in this region is still weakly dis-cretized, presumably by the formation of second and third hydration spheres. This scenario suggests that the surface of
laponite is covered almost exclusively by adsorbed water molecules.
The time scale of the simulations and relatively small number of counterions prevents us from drawing unambigu-ous conclusions regarding the relative populations of peaks inNa(z). However, it should be born in mind that the start-ing point of the sodium counterions was 8 Å from the nearest clay sheets, and so the ions therefore had to travel towards the clay sheet to reach the main peak at 兩z兩⫽9.5 Å. During the 100 ps of simulation no sodium cation traveled across the simulation box, from one surface layer to the opposite side. There are very few direct measurements of aqueous structure at a colloidal surface. Most relevant to our current work are high resolution neutron diffraction studies of hy-drated vermiculite clays, using isotopic labeling.5,6 In these studies the counterions were short chain alkylammonium, such as C3H7NH3⫹, with clay–clay spacings of the order 40 Å. Two ordered layers of water are indeed observed close to the clay sheets, but the counterion distribution is centered on the midplane of the interlayer region. The latter may be a peculiarity of the particular counterions, which have hydro-phobic end-groups, or the clay surface, which is more highly charged than laponite.16 Surface force measurements of in-teractions between hydrated mica clay plates show oscilla-tions at separaoscilla-tions of less than 30 Å.3These are consistent with our calculated layering of water at the surface, but could equally well arise from the different counterion hydration states observed in our simulations. X-ray standing wave studies of the rutile–water interface provide quite detailed information on the counterion distribution.7 Recent studies on rubidium ions show a large population in the inner-sphere, probably due to the very weak hydration of this cation.24
For us to understand the thermodynamics of the confined water, it is important to establish the interlayer density. We have already shown that the average value for water in our laponite is slightly lower than that in the bulk 共0.98⫾0.02 and 1.02⫾0.02 g/cm⫺3, respectively兲. However, this com-parison depends on the 共arbitrary兲 definition of the dry clay volume. For this reason it is instructive for us to calculate the water density as a profile across the interlayer region. To aid the reader, the number density of oxygen atoms in bulk wa-ter, 0.0335 Å⫺3, is shown as the solid horizontal line in Fig. 2. It can be seen that even towards the center of the interlayer region, this asymptote exceeds the density of the confined water. In fact, the mid-plane interlayer figure of 0.0310 Å⫺3 is closer to the value of 0.0295 Å⫺3obtained for low density water at 268 K.25 We discuss the structural interpretation of this effect in Sec. III B.
Density profiles in the plane of the clay sheets were also computed for water molecules adsorbed to the clay surface using, for x for example,
␣共x兲⫽
1
Ay z dn␣共x兲
dx . 共4兲
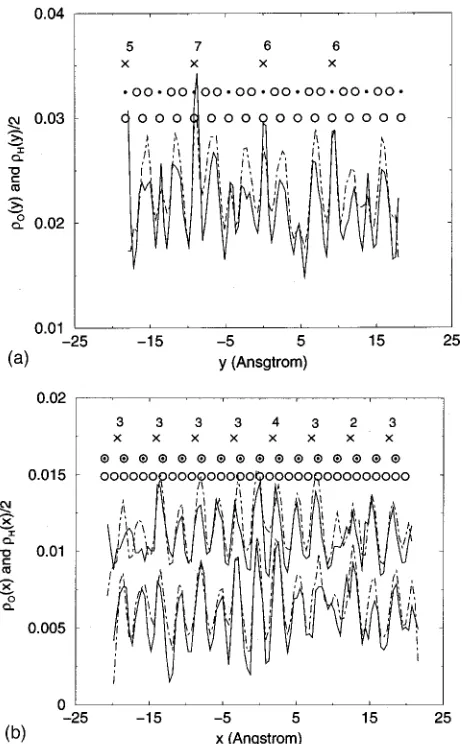
These data are shown in Fig. 3. The cutoff for the first layer of water molecules was taken as兩z兩⬎10.0 Å from the mid-plane of the interlayer region. The position of oxygen and lithium atoms in the clay sheet is indicated in these figures, FIG. 2. Density profiles normal to the clay sheets:O(z) for oxygen共solid
and for better visualization the magnitude of the hydrogen profiles were halved. Due to the offset of the upper and lower surface oxygen atoms when viewed in the y z-plane, the pro-filesO(x) andH(x) on the top and bottom surfaces of the clay layer were plotted separately in Fig. 3共b兲, with those for the bottom layer shifted to register with the upper clay at-oms.
The in-plane profiles show that hydrogen and oxygen maxima coincide, confirming strong hydrogen bonding to every other surface oxygen atom on the clay surface. The separation between these atoms is 2.64 Å. The remaining hydrogen atoms are not registered to the clay surface. It is also interesting to note that the highest hydrogen peaks occur
near positions of the magnesium row containing the highest number of lithium substitutions, and therefore the highest negative charge density. The results in Fig. 3 therefore clearly indicate the high level of organization of the first adsorption layer of water on the surface of laponite.
B. Pair distribution functions
The three-dimensionally averaged radial pair distribution functions are plotted in Figs. 4 and 5 and were computed from the simulation data using the definition
g␣共r兲⫽ 1
4r2
dn␣共r兲
dr , 共5兲
where dn␣(r) is the number of particles of species共in the interlayer region and clay兲 at a distance between r and r ⫹dr of a fixed particle of interlayer particles of species ␣. The function n␣(r) is also known as the running coordina-tion number and is plotted as insets in Figs. 4 and 5.
Figure 4 shows the sodium-centered distribution func-tions gNaH(r) and gNaO(r), with the respective coordination numbers in the inset. The first peaks in gNaO(r) and gNaH(r) occur at 2.4 and 3.0 Å, respectively, and give a coordination number of six water molecules when r⬍3.5 Å. This is very similar to the situation found in bulk water,24 and confirms that ‘‘correct’’ hydration of the counterions is a priority for the interlayer water.
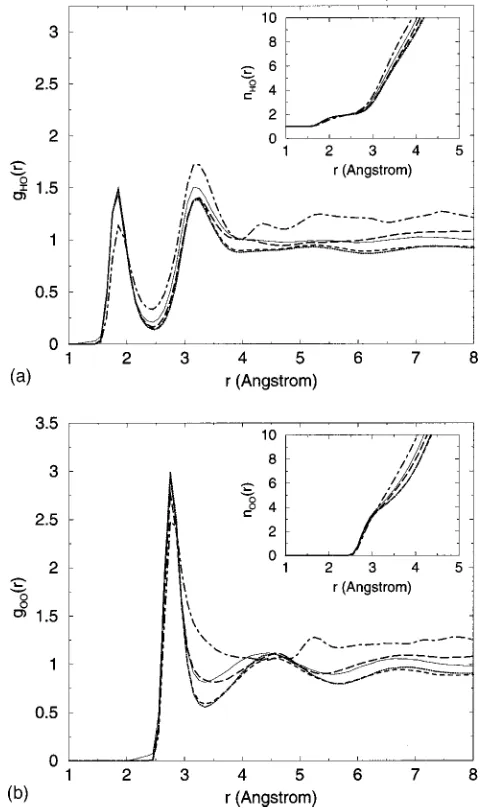
Turning now to the water itself, the large distance be-tween our two opposing layers of laponite makes it is useful for us to resolve the g␣(r) into contributions from particles of species ␣lying within a certain distance of the clay sur-face. In Fig. 5 we chose four windows of range z0⫺2.13 Å ⬍兩z兩⬍z0⫹2.13 Å. The dotted-dashed lines include particles closest to the clay, with z0⫽12.78 Å. The long-dashed line was computed for z0⫽8.52 Å, the dashed line corresponds to
z0⫽4.26 Å, and the dotted line to z0⫽0.0 Å. In the insets of Fig. 5 the corresponding coordination numbers are plotted. For reference, the distribution functions for bulk water are FIG. 3. Density profiles parallel to the clay sheets. In共a兲, the density profiles
for interlayer oxygen O(y ) 共solid curve兲 and hydrogen H(y ) 共 dotted-dashed curve兲. In共b兲,O(x)共solid curve兲andH(x)共dotted-dashed curve兲. These were calculated for oxygen and hydrogen in the first adsorbed layer of interlayer water molecules, for which兩z兩⬎10.0 Å. TheHwere halved for easier visualization. Due to the symmetry of the crystallographic cell of laponite, in共a兲the density profiles were calculated adding the top and the bottom surface profiles whereas in共b兲the calculation was done separately for the top共curves on top兲and bottom surfaces共curves below, shifted down-wards by 0.005 for better visualization兲of the clay layer. The positions of the rows containing surface and apical oxygen atoms in the clay layer are represented with open circles. The positions of rows containing oxygen atoms in the clay OH groups are represented with dots. The positions of rows of magnesium with lithium are marked with crosses. The number of vacancies on each row is indicated.
also presented as the solid lines. These data show that nearest-neighbor hydrogen bonding is honored for all but the first molecular layers of water. This is consistent with the picture derived from neutron diffraction studies of interlayer water in smectite clay.26 However, even among molecules over 10 Å from the nearest clay surface, longer range struc-ture has still not recovered to the bulk. In particular, we observe a shift to higher r for the second nearest-neighbor O–O correlations occurring at around 4.5 Å. The imposition of planar geometry therefore produces a more open water structure, similar to that proposed for low-density water in the bulk at 268 K.25Note also that the running coordination numbers, n(r), for water outside the surface layer are below the bulk values. This correlates the reduced local density to the observed structural changes. For this reason, our
simula-tions lead us to conclude that the clay–water interface is longer range than the oscillations in the density profiles of Fig. 2.
C. Diffusion properties
The self-diffusion coefficients D␣ for the different spe-cies can be computed from the mean-square displacement
具
r2典
⬅具
兩r共t兲⫺r共t0兲兩2典
⬇ 1NNt
兺
n⫽t N兺
t0 Nt兩rn共t兲⫺rn共t0兲兩2, 共6兲 where rn(t) is the position of particle n at time t, N is the number of particles, and Ntis the number of time steps. The Einstein diffusion equation relates D to the dimensionality d0 and to the gradient of
具
r2典
with timeD⫽ 1
2d0
d
具
r2典
dt . 共7兲
The mean-square displacement for interlayer water and sodium counterions was computed from the simulation data and are plotted in Fig. 6. We present the total three-dimensional
具
r2典
, as well as the individual one-dimensional具
x2典
,具
y2典
, and具
z2典
. The self-diffusion coefficients were computed from these plots and are listed in Table III. The FIG. 5. Pair distribution functions for interlayer species, resolved intodis-tance from the midplane of the clay sheets. In共a兲distribution functions
gHO(r) and in共b兲gOO(r) for interlayer water in laponite. These g␣(r) were calculated by counting theatoms共interlayer and clay atoms兲lying at a distance r from a fixed interlayer ␣ atom which is within a distance z0
⫺2.13 Å⬍兩z兩⬍z0⫹2.13 Å from the central magnesium xy -plane in the clay sheet. The different values z0 are 12.78 Å共dotted-dashed line兲, 8.52 Å 共long-dashed line兲, 4.26 Å共dashed line兲, and 0.0 Å共dotted line兲. The dis-tribution functions for bulk water共solid lines兲are also plotted for compari-son. All corresponding coordination numbers n␣(r) are shown in the in-sets.
FIG. 6. The total mean-square displacement 具r2典 and directional mean-square displacements具x2典,具y2典, and具z2典for共a兲the interlayer water and共b兲 the sodium counterions, in laponite, as a function of simulation time. In共a兲, the具r2典for bulk water is also shown.
TABLE III. Self-diffusion coefficients of interlayer water molecules and sodium counterions in laponite at T⫽277 K and p⫽105Pa.
Water Sodium
Dtotal⫻1010共m2s⫺1) 7.4 2.0
Dx⫻1010(m2s⫺1) 9.2 2.9
Dy⫻1010(m2s⫺1) 8.1 2.7
Dz⫻1010(m2s⫺1) 4.9 0.48
Bulk water Dwater⫽1.1⫻10⫺9m2s⫺1 Infinite dilution共297 K兲a D
Na⫽1.0⫻10⫺9m2s⫺1
coefficient for the self-diffusion of water in bulk is also given in this table, and was calculated from the separate simulation with 256 water molecules at the same temperature and pressure.
The results in Fig. 6共a兲show that the diffusion of water in our laponite is anisotropic, with greatest mobility parallel to the clay sheets. In fact, in-plane diffusion approaches that of the bulk. By bearing in mind that the first two molecular layers of water are severely hampered by the clay sheets,27 we conclude that around the midplane of our system, water molecules are at least as mobile as they are in the bulk. Unfortunately it is not possible for us to resolve diffusion into slices similar to those used for the radial distribution functions, because of the motion normal to the clay sheets.
The sodium counterions are predominantly present as outer-sphere hydrated complexes, and their motion is there-fore strongly influenced by the clay surface. For this reason also, the in-plane diffusion coefficients of the counterions are comparable to those observed in clay systems containing only three molecular layers of water.27
Finally we note that the diffusion of interlayer sodium 共and water兲 is not perfectly equivalent in the x- and
y-directions along the surface: both water and sodium cations
diffuse slightly faster along our chosen x-direction. Figure 3 shows that not only is the density of surface siloxane oxy-gens higher along the x-direction, but also that the number of lithium defects is slightly lower along this direction. These structural asymmetries are responsible for the slightly higher diffusion of sodium ions, and the water hydrated to them, along the x-direction. The fact that this effect can be ob-served is a consequence of the relatively large scale of the simulation.
IV. CONCLUSIONS
Monte Carlo and molecular dynamics computer simula-tion has been used to study the structure and dynamics of an interlayer aqueous solution in a colloidal sodium laponite clay. The system studied has a clay–clay spacing of 34.06 Å, and contains 1200 interlayer water molecules and 24 sodium counterions. The density profiles for interlayer species show two distinct layers of surface water as one moves away from each clay particle. The innermost of these layers is strongly oriented to form hydrogen bonds to the surface oxygen at-oms. Radially averaged pair distributions, calculated as a function of distance from the clay surfaces, show that throughout our system the water structure is significantly perturbed from the bulk. In particular, we observe a shift to higher r for the second nearest-neighbor O–O correlations occurring at around 4.5 Å. This structural change can be correlated to a reduction in the local density, visible in the
running coordination numbers n(r). The imposition of pla-nar geometry therefore leads to a more open water structure, similar to that proposed for low-density water in the bulk at 268 K. For this reason our simulations lead us to conclude that the clay–water interface is longer range than the oscil-lations in the interlayer density profiles. The majority of the sodium counterions are fully hydrated by six water mol-ecules. These hydrated complexes lie in contact with the solid surface 共as so-called outer-sphere complexes兲. How-ever, we also observe the vestiges of a diffuse layer. Diffu-sion is anisotropic, and is more rapid in the plane of the clay sheets than normal to the clay sheets. The former approaches the bulk value.
ACKNOWLEDGMENT
We thank the U.K. Natural and Environmental Research Council 共NERC兲for financial support.
1J. N. Israelachvili, Intermolecular and Surface Forces共Academic,
Lon-don, 1992兲. 2
R. Guidelli and W. Schmickler, Electrochim. Acta 45, 2317共2000兲. 3
J. N. Israelachvili and H. Wennerstrom, Nature共London兲379, 219共1996兲. 4I. Benjamin, Chem. Rev. 96, 1449共1996兲.
5J. Swenson, M. V. Smalley, R. K. Thomas, R. J. Crawford, and L. F.
Braganza, Langmuir 13, 6654共1997兲. 6
G. D. Williams, A. K. Soper, N. T. Skipper, and M. V. Smalley, J. Phys. Chem. B 102, 8945共1998兲.
7R. Fenter, L. Cheng, S. Rihs, M. Machesky, M. J. Bedzyk, and N. C.
Sturchio, J. Colloid Interface Sci. 225, 154共2000兲. 8E. Spohr, Chem. Phys. Lett. 207, 214共1993兲. 9
D. A. Rose and I. Benjamin, J. Chem. Phys. 98, 2283共1993兲.
10X. Xia, L. Perera, U. Essmann, and M. L. Berkowitz, Surf. Sci. 335, 401 共1995兲.
11E. Spohr, Electrochim. Acta 44, 1697共1999兲. 12
A. Delville, J. Phys. Chem. 97, 9703共1993兲. 13
N. T. Skipper, Miner. Mag. 62, 657共1998兲.
14G. Sposito, N. T. Skipper, R. Sutton, S-H. Park, A. K. Soper, and J. A.
Greathouse, Proc. Natl. Acad. Sci. U.S.A. 96, 3358共1999兲. 15G. Sposito, The Chemistry of Soils共Oxford, New York, 1989兲. 16
A. C. D. Newman, Chemistry of Clays and Clay Minerals共Mineralogical Society, London, 1987兲.
17E. S. Boek, P. V. Coveney, and N. T. Skipper, J. Am. Chem. Soc. 117,
12608共1995兲. 18
W. L. Jorgensen, J. Chandrasekhar, J. D. Madura, R. W. Impey, and M. L. Klein, J. Chem. Phys. 79, 926共1983兲.
19J. Chandrasekhar, D. C. Spellmeyer, and W. L. Jorgensen, J. Am. Chem.
Soc. 106, 903共1984兲.
20M. W. Mahoney and W. L. Jorgensen, J. Chem. Phys. 112, 8910共2000兲. 21
N. T. Skipper, G. Sposito, and F-R. Chang, Clays Clay Miner. 43, 285 共1995兲.
22K. Refson, Comput. Phys. Commun. 3, 310共2000兲.
23T. Sato, T. Watanabe, and R. Otsuka, Clays Clay Miner. 40, 103共1992兲. 24
H. Ohtaki and T. Radnai, Chem. Rev. 93, 1157共1993兲. 25
A. K. Soper and M. A. Ricci, Phys. Rev. Lett. 84, 2881共2000兲. 26D. H. Powell, K. Tongkhao, S. J. Kennedy, and P. G. Slade, Clays Clay
Miner. 45, 290共1997兲.