Response Analysis of Lead Yield to Combined Inputs of
Reaction Temperature and Ferric Sulphate Concentration
during Leaching of Galena
C. N. Mbah
Department of Metallurgical and Materials Engineering, Enugu State University of Science & Technology, Enugu, Nigeria
Abstract
R
esponse analysis of lead yield to the combinedinfluence of reaction temperature and ferric sulphate concentration was carried out during leaching of galena in the sulphate solution. A predictive model was derived, following computational analysis of experimental results. The model was validated and used for the response analysis. The validity of the model expressed as;
0.035 0.001 +
0.0066υ γ
= ζ
was rooted on the expression
0.035 0.0066 0.001
γ= υ
−
ζ where both sides
of the expression are correspondingly approximately equal. Statistical analysis of the lead yield concentration for each value of the reaction temperature as obtained from experiment and derived model-predicted results show standard
errors of 0.0097 and 2.15 x 10⁻⁹ % respectively.
Results evaluation indicates that lead yield concentration per unit reaction temperature as obtained from experiment and derived
model-predicted results were 0.0068 and 0.0066 ppm/ 0C
respectively. Deviation analysis of model-predicted lead yield concentration (from experimental result) shows a maximum deviation of was less 5%. This translates into a derived model confidence level of above 95% as well as over 0.95 response coefficients for lead yield dependence on the reaction temperature and ferric chloride concentration.
Keywords: Response analysis, Lead yield, Galena, Reaction temperature, Ferric sulphate solution.
1. Introduction
The vast applicability of lead for industrial and laboratory use has raised very enormous need to intensify efforts at advancing research and development for improved methods of extraction of the metal from its natural ore.
In recent years, there had been considerable increase of interest in the development of
hydrometallurgical processes [1-10]. This
interest was spurred by its being more environmentally acceptable than the conventional pyrometallurgical processes. It also permits the recovery of metals from lower grade feedstock and produces a means of processing complex concentrates that cannot be handled simply or economically by Pyrometallurgy [1]
The scope of hydrometallurgy is quite broad and extends beyond the processing of ores to the treatment of metal concentrates, metal scrap and revert materials, and intermediate products in metallurgical processes. Although the process was reserved for lean ores and processing of dumps and middling, it is recently gaining attention as a means of processing more of rich ores.
Leaching, a step in hydrometallurgical
operations involves contacting a material containing a valuable metal with aqueous solutions containing a lixiviant. The lixiviant in solution may be acidic or basic in nature. The type and concentration of the lixiviant is normally controlled to allow some degree of
selectivity for the metal or metals that are to be recovered [11]. Leaching is conducted with an aqueous solution in which there is a solubility of the dissolving mineral or compounds in the material being leached sufficient to obtain an acceptable concentration of valuable metal in solution. On the other hand it is important that in the same solution the waste materials and compounds being rejected by the leaching reaction should have a solubility low enough to yield an acceptable separation of valuable and waste minerals during the leach and to obtain a leach solution of acceptable purity for subsequent metal recovery [12].
Leaching may be carried out in several ways but the four basic leaching techniques are In situ or solution leaching, Heap or dump leaching, Percolation leaching and Vat leaching.
In i
nsitu leaching, holes are drilled into the oredeposit or explosives or hydraulic fracturing used to create open pathways within the deposit for solution to penetrate into. Leaching solution is pumped into the deposit where it makes contact with the ore. The solution is then collected and processed. It is sometimes worthwhile to divert surface water so that it percolates through old mine workings and takes values in solution down into a sump from which they can be pumped and recovered. In another technique known as the five hole method [13], a number of drill holes are bored into the upper surface of an ore body and an additional hole to another point near to its lowest level. Water is fed through the shorter hole and pregnant liquor is pumped from the deepest point.
In situ leaching apart from being used on old mines can only be used on deposits proved too lean to justify conventional mining. The deposit also must be at depths shallow enough to cut down as much as possible on drilling and pumping costs.
In heap leaching, crushed and sometimes
agglomerated run-of-mine ore of sizes <200mm
is piled in heap lined with an impervious layer. Leach solution is sprayed over the top of the heap and allowed to percolate downwards through the heap. The heap design usually incorporates collection sump which allowed the pregnant leach solution to be pumped for further
processing. Both USA and Spain are now practicing heap leaching. In Rio Tinto, Spain,
the ore treated has a very high FeS2 content and
so will require very heavy fluxing if smelting is employed. Leaching is therefore resorted to as a more economical and environmentally friendly processing alternative. In this typical heap leaching site, the heaps are sprayed regularly with the oxidising and acid tailing solution from precipitation plant rich in ferric sulphate. The intentional high ventilation of the heap provides plenty of air to keep down the temperature in order to inhibit the oxidation and sulphation of
FeS2. Each of the many cycles is made up of
two parts. In the first part, the solution seeps into the ore lumps, reacts with the copper minerals and dissolves some of the copper. It is then allowed to dry out and the dissolved salts creep to the surface by inverse capillarity action.
The fortuitous presence of a microorganism known as thiobacillius ferrooxidans shortens the leaching time. This organism, catalyses the oxidation of sulphides. It derives its energy from oxidation of ferrous ions to ferric ions and in this way ensures that the oxidising agent necessary for the conversion of sulphides of copper to the soluble sulphate is maintained in good supply. To treat 10,000 tons of sulphide ore by the above process as long as 2 years is required. Dump leaching is similar to heap leaching except that it is applied to millions of tons of ores over periods of several years to mine wastes too low to justify conventional treatment.
In percolation leaching, ore crushed to -6mm is leached in large concrete tanks that hold about 10,000 tons of ores. Leaching solution is fed into each tank, held for several hours and drained out. Each tank is percolated by a series of about 12 solutions each more acid than the preceding one and the last being a fresh reagent. Likewise, the solution is passed to fresher ore at each move until it is strong enough to be sent to the recovery plant; a process known as continuous counter-current decantation (CCD). Percolation leaching is practiced in Chile and on a basic copper sulphide ore which dissolves readily in sulphuric acid.
Agitation or vat leaching is employed when further grinding is necessary to make accessible all the mineral particles. In such cases, the ore is suspended in the leaching solution in a vat and stirred mechanically or with compressed air jet. The contact time is reduced to about 2 days. Though agitation leaching is faster it is more costly than percolation leaching and so is not commonly practiced.
The aim of the present work is to carry out a response analysis of lead yield based on reaction temperature and ferric sulphate concentration used during leaching of galena in the sulphate solution.
3. Materials and methods
The galena samples used in this study were collected from the deposit, at Enyimgba, Abakaliki, Ebonyi State. The galena which was in association with other minerals (valuable and gangue) was obtained in lumps of about 500 mm. These lumps were crushed and the galena cubes isolated from the gangue by careful hand picking. The isolated galena crystals were further crushed and a set of screen used to size them into fines, 80 x 100, 60 x 80 mesh, 40 x 60, 20 x 40 mesh, 10 x 20 mesh and oversize. This range of particle size was used throughout the experiment. Based on the atomic absorption spectrometric analysis carried out, the samples used contain 86.55% Pb, indicating that the sample was essentially pure.
Ferric sulphate solution
and the galena were kept in separate cylindrical flask and placed in the water bath to attain the desired temperature. Once the temperature was reached the leaching solution was transferred into the vessel containing the galena sample and stirring commenced. In all the experiments, 0.5 gram each of galena was leached in 500 mls solution which is equivalent to 1 gram of galena in 1 litre of solution. A 5 mls sample each of solution was withdrawn at predetermined time intervalsand filtered.
Furthermore,
2 mls of this stocksolution was further diluted to 100 mls and sampled for analysis.
Table 1: Variation of lead yield with reaction temperature and ferric sulphate concentration [14]
(ɤ) (ϑ) (ζ )
0.1 0.1 0.1 0.1 0.1
30
40
50
60
70
0.16 0.24 0.31 0.38 0.43 3.1 Model Formulation Results generated from the experiment were used for the model formulation. Computational analysis of the results shown in Table 1, gave rise to Table 2 which indicate that; Nγ≈Kυ+S (2) Introducing the values of N, K and S into equation (2) reduces it to; ζ− 0.001γ=0.0066υ - 0.035 (3)
ζ=0.0066υ + 0.001γ - 0.035 (4)
Where
(ζ ) = Conc. of lead yield (ppm)
(ϑ) = Reaction temperature (0
C)
(ɤ) = Ferric chloride concentration (M)
N = 0.001, K = 0.0066, and S = 0.035. These are empirical constant (determined using C-NIKBRAN [15]
4. Boundary and Initial Condition
Galena was placed in cylindrical flask 30cm high containing leaching solution of ferric sulphate. The leaching solution is non flowing (stationary). Before the start of the leaching process, the flask was assumed to be initially free of attached bacteria and other micro organism. Initially, the effect of oxygen on the process was assumed to be atmospheric. In all cases, weight of lead used was 0.5g. The range
of reaction temperature used was 30 – 700C. The
reaction time used was 2 hrs. Ferric sulphate concentration used was 0.1M.
The leaching process boundary conditions
include: atmospheric level of oxygen
(considering that the cylinder was open at the top) at both the top and bottom of the ore particles in the gas and liquid phases respectively. A zero gradient was assumed for
the liquid scalar at the bottom of the particles and for the gas phase at the top of the particles. The sides of the particles were assumed to be symmetries.
5. Model Validation
Table 2: Variation of ξ - 0.001ɤ with 0.0066ϑ -
0.035
ξ – 0.001ɤ 0.0066ϑ - 0.035
0.1599 0.2399 0.3099 0.3799 0.4299
0.163 0.229 0.295 0.361 0.427
Equation (4) is the derived model. The validity of the model is strongly rooted on equation (3) where both sides of the equation are correspondingly approximately equal. Table 2 also agrees with
equation (3) following the values of ξ - 0.001ɤ =
0.0066ϑ - 0.035 evaluated from the experimental
results in Table 1.
Furthermore, the derived model was validated by comparing the lead yield predicted by the model
and that obtained from the experiment. This
was done using the 4
thDegree Model Validity
Test Techniques (4
thDMVTT); statistical
graphical, computational and deviational
analysis.
R2 = 0.994
0 0.1 0.2 0.3 0.4 0.5 0.6 0.7
20 30 40 50 60 70 80
Temperature (0C)
Lead y
iel
d (
ppm
)
Fig.1: Coefficient of determination between lead yield concentration and reaction temperature as
obtained from experiment
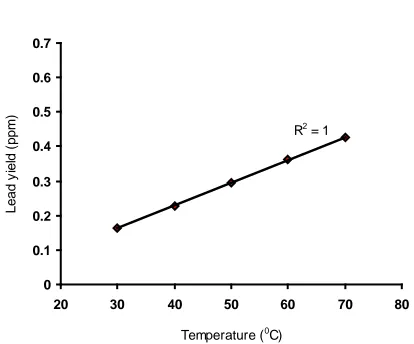
R2 = 1
0 0.1 0.2 0.3 0.4 0.5 0.6 0.7
20 30 40 50 60 70 80
Temperature (0C)
Lead y
iel
d (
ppm
)
Fig.2: Coefficient of determination between lead yield concentration and reaction temperature as
obtained from derived model
Statistical Analysis
Standard Error(STEYX)
The standard errors incurred in predicting lead yield for each value of the reaction temperature considered as obtained from experiment and derived
model were 0.0097and 2.15 x 10⁻⁹ % respectively.
The standard error was evaluated using Microsoft Excel version 2003.
Correlation (CORREL)
The correlation coefficient between lead yield and reaction temperature were evaluated from the results of the derived model and experiment, considering the coefficient of
determination R2 from Figs. 2 and 3. The evaluation
was done using Microsoft Excel version 2003.
R = √R2
(5)
The evaluated correlations are shown in Table 3 These evaluated results indicate that the derived model predictions are significantly reliable and hence valid considering its proximate agreement with results from actual experiment.
Table 3: Comparison of the correlations evaluated from derived model predicted and ExD results based on reaction temperature
Analysis Based on reaction temperature
ExD D-Model
CORREL
0.9970 1.0000
Graphical Analysis
Comparative graphical analysis of Fig. 3 show very close alignment of the curves from the experimental (ExD) and model-predicted (MoD) lead yields.
0 0.1 0.2 0.3 0.4 0.5 0.6 0.7
20 30 40 50 60 70 80
Temperature (0C)
Lead y
iel
d (
ppm
)
ExD MoD
Fig.3: Comparison of lead yield concentrations
(relative to reaction temperature) as obtained
from experiment and derived model
Furthermore, the degree of alignment of these curves is indicative of the proximate agreement between both experimental and model-predicted
lead yields.
Computational Analysis
Computational analysis of the experimental and model-predicted lead yield was carried out to ascertain the degree of validity of the derived model. This was done by comparing lead yield per unit reaction temperature using experimental and model-predicted results.
Lead yield per unit reaction temperature
The lead yield per unit reaction temperature ζT was
calculated from the expression;
υ ∆
ζ ∆ =
ζT (6)
Equation (6) is detailed as
1 2
1 2 T υ −υ
ζ − ζ =
ζ (7)
Where
Δζ = Change in lead yield at two different reaction
temperatures ϑ 2, ϑ1.
Considering the points (30, 0.16) & (70, 0.43), and (30, 0.1631) & (70, 0.4271) as shown in
Figs 1 and 2, and designating them as (ξ1, ϑ1) &
(ξ2, ϑ2) for experimental and derived model
predicted results respectively, and then substituting them into equation (7), gives the
slopes: 0.0068 and 0.0066 ppm/ 0C as lead yield
rate respectively.
Deviational Analysis
The deviation Dv, of model-predicted lead yield from the corresponding experimental result was given by
100 Dv
ExD ExD
MoD ×
ζ ζ − ζ
= (8)
Where
ζExD and ζMoD are extracted lead concentration
from experiment and derived model respectively.
Critical analysis of the lead yield obtained from experiment and derived model shows low deviations on the part of the model-predicted values relative to values obtained from the experiment. This is attributed to the fact that the surface properties of galena and the physico-chemical interactions between the galena and the leaching solution which
played vital roles during the leaching processwere
not considered during the model formulation. This necessitated the introduction of correction factor, to bring the model-predicted extracted lead concentration to those of the corresponding experimental values.
0 0.1 0.2 0.3 0.4 0.5 0.6 0.7
30 40 50 60 70
Temperature (0C)
Lead y
iel
d (
ppm
)
-6 -5 -4 -3 -2 -1 0 1 2 3
D
ev
iat
ion (
%
)
MoD Deviation
Fig.4: Variation of deviation with lead yield (relative to the reaction temperature)
model as well as over 0.95 response coefficient of lead yield to the collective operational contributions of the reaction temperature and ferric sulphate concentration.
Consideration of equation (8) and critical analysis of Fig. 4 shows that the least and highest magnitudes of deviation of the model-predicted lead yield (from the corresponding experimental values) are – 0.67 and - 4.97. Figs. 1- 4 indicate that these deviations correspond to lead yields: 0.4271 and 0.3611 ppm as well as reaction
temperature: 70 and 60 0C respectively.
Correction factor, Cf to the model-predicted results is given by
100 Cf
ExD ExD
MoD ×
ζ ζ − ζ −
= (9)
Critical analysis of Figs. 1-5 indicates that the evaluated correction factors are negative of the deviation as shown in equations (8) and (9).
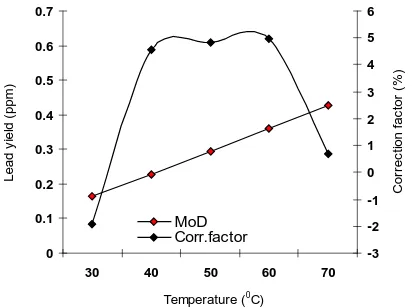
The correction factor took care of the negligence of operational contributions of the surface properties of the galena and the physico-chemical interactions between the galena and the leaching solution which actually played vital role during the leaching process. The model predicted results deviated from those of the experiment because these contributions were not considered during the model formulation. Introduction of the corresponding values of Cf from equation (9) into the model gives exactly the corresponding experimental values of lead yield.
0 0.1 0.2 0.3 0.4 0.5 0.6 0.7
30 40 50 60 70
Temperature (0C)
Lead y
iel
d (
ppm
)
-3 -2 -1 0 1 2 3 4 5 6
C
or
rec
tion f
ac
tor
(
%
)
MoD Corr.factor
Fig.5: Variation of correction factor with lead yield concentration (relative to the reaction temperation)
Fig. 5 shows that the least and highest correction factor (to the model-predicted lead yield) are + 0.67 and + 4.97%. Since correction factor is the negative of deviation as shown in equations (8) and (9), Figs. 1-5 indicate that these highlighted correction factors correspond to lead yields: 0.4271 and 0.3611 ppm as well as reaction
temperature: 70 and 60 0C respectively.
It is very pertinent to state that the deviation of model predicted results from that of the experiment is just the magnitude of the value. The associated sign preceding the value signifies that the deviation is a deficit (negative sign) or surplus (positive sign).
6. Conclusion
A response analysis of lead yield to the combined influence of reaction temperature and ferric sulphate concentration was carried out during leaching of galena in the sulphate solution. A predictive model, derived and validated was used for the response analysis. The validity of the model was rooted on the
expression ξ - 0.001ɤ = 0.0066ϑ - 0.035 where
both sides of the expression are correspondingly approximately equal. Statistical analysis of the lead yield concentration for each value of the reaction temperature as obtained from experiment and derived model-predicted results
show standard errors of 0.0097 and 2.15 x 10⁻⁹ %
respectively. Results evaluation indicates that lead yield concentration per unit reaction temperature as obtained from experiment and derived model-predicted results were 0.0068 and
0.0066 ppm/ 0C respectively. Deviation analysis
of model-predicted lead yield concentration (from experimental result) shows a maximum deviation of was less 5%. This translates into a derived model confidence level of above 95% as well as over 0.95 response coefficients for lead yield dependence on the reaction temperature and ferric chloride concentration.
References
[1]. R. Darton, G. Diaz, R. Prince and A. D.
Zunkel, “The cuprex metal extraction process: Recovery of Copper from
Sulphide ores,” JOM, pp. 51-56, 1991.
[2]. J. E. Dutrizac, “The Dissolution of Chalcopyrite in Ferric Sulphate and
Ferric Chloride Media,” Metallurgical
Transaction B, vol. 12B, pp. 371-378,
1981.
[3]. J. E. Dutrizac and T. T. Chen, “The
effect of elemental sulphur reaction product on the leaching of galena in
ferric chloride media,” Metallurgical
transaction B, vol. 21B, pp. 935-943,
1990.
[4]. J. E. Dutrizac and R. J. C. Macdonald,
“The dissolution of sphalerite in ferric
chloride Solutions,” Metallurgicla
Transactions B, vol. 9B, pp. 543-551,
1978.
[5]. J. Dutrizac, “ The leaching of sulphide
minerals in chloride media,”
Hydrometallurgy, vol. 29, pp. 1-45,
1992.
[6]. M. K. Gosh, S. Anand and R. Das,
“Oxidative Ammonia Leaching ofPpure Zinc Sulphide in the Presence of Lead
Compounds,” Metallurgical
Transactions B, vol. 21B, pp. 402-404,
1990.
[7]. P. R. Haskett, D. J. Baurer and R. E.
Linsfrom, “Copper recovery from chalcopyrite by roast-leach procedure,” Bu. Mines
[8]. H. Majima, Y. Awakura and N. Misaki,
“A Kinetic Study on Nonoxidative Dissolution of Sphalerite in Aqueous Hydrochloric Acid Solutions,”
Metallurgical Transactions B, Vol.
12B,, pp. -644-649, 1981.
[9]. Ogbonna, N., Pertersen, J., and Laurie,
H., “An agglomerate scale model for heap bioleaching of Chalcocite,” vol. 106, p. 434- 442, 2006.
[10]. J. Q. G. QIN Wenqing, “Bioleaching of
sphalerite flotation concentrate By Acidithiobacillus ferrooxidans and
Acidithiobacillus thiooxidans cultured in 9K medium modified with pyrrhotite,”
[Online]. Available:
http://www.paper.edu.cn.and
[11]. Wikipedia, “Hydrometallurgy,” 21
December 2011. [Online]. Available: http://en.wikipedia.org. [Accessed 6 December 2012].
[12]. A. H. Rose and V. Mackiw,
“Hydrometallurgy,” in Mineral
Processing Handbook, N. L. Weiss, Ed.,
New York, Society of Mining Engineers, 1985, pp. 13/11-13/79
[13]. J. D. Gilchrist, Extraction Metallurgy,
2nd ed., Robert Maxwell, Pergamon Press LTD, 1980, pp. 293-303.Dissolution of Major Sulphide Ore Minerals: Processes and Galvanic Effects in Complex Systems. Mineralogical Magazine. 68(2):343-351.DOI:10.1180/0026461046820191
[14]. C. N. Mbah. Leaching Characteristics of
Enyimgba Galena in Aqueous Ferric Salt Lixiviants. Ph.D Thesis, Enugu State University of Science & Technology, Enugu, Enugu State. 2012.
[15]. C. I. Nwoye. Data Analytical Memory;
C-NIKBRAN . 2008.