management plan. In 1961 they established 65 miles of fertilized and seeded firebreaks amount- ing to 130 acres.
B. A. Graham and Son pro- duce cattle and timber on about 2,000 acres in Vernon Parish, Louisiana. The SCS assisted them several years ago in devel- oping a conservation plan which provides for proper management of their forage and tree crops. The plan involves proper stock- ing, cross fencing, deferred graz- ing, fire control, timber thin- ning, natural reseeding of long- leaf pine and other practices.
B. A. Graham says that his cattle have been making him more money than his trees up to the present time and has fig- ures to support his claims. He realizes however, that future re- turns from timber will be higher as their. woodland management
plan becomes effective. This is a good example of how range livestock can carry the operation while the owner is waiting for income from timber.
The Southeast can meet the demand for more beef by graz- ing the 30 million acres of wood- lands according to sound conser- vation plans that allow for land capabilities, trees, grass, water, and livestock.
LITERATURE CITED
CAMPBELL, ROBERT S., E. A. EPPS, JR., 0. C. MOREHEAD, J. L. AND FRANCIS BONNER. 1951. Nutritive Values of Native Plants on Forest Range in Central Louisiana. State Uni. Agric. Expt. Sta. Bulletin No. 488. I8 PP.
CASSADY, JOHN T. 1953. Herbage Production on Bluestem Ranges in Central Louisiana. Jour. Range Mangt. 6: 38-43.
AND ROBERT S. CAMPBELL. 1951. Pine Forest Ranges in Louisiana. U. S. D. A., Forest Service. 7 pp. (Mimeo)
HALLS, L. C. AND V. L. DUVALL. 1961. Profits and Cost of Forest Grazing. Forest Farmer. 20: 151-153. LOFTIN, L. L., W. M. CLARK, E. D.
HOLCOMBS, B. F. CHAFIN AND H. F. FALLIN. 1959. Soil Survey Inter- pretations for Woodland Conser- vation. U. S. D. A. S.C.S., Alex- andria, La., Progress Report. 67 pp. LYLES, LIGGETT, 1962. Mid-Continent
States Show Major Herd Gains. American Cattle Producer. 43: 8-9. SHIFLET, THOMAS N. 1962. A Case of Timber-Cattle Teamwork. For- est and People. 12: 44-45.
U. S. DEPARTMENT OF AGRICULTURE. 1941. Climate and Man. Yearbook of Agriculture. pp. 894-903.
U. S. SOIL CONSERVATION SERVICE. 1959. Range Handbook, Alexan- dria, La. 72 pp.
WICHMAN, M. F. AND R. E. Fox. 1950. Analysis of Grazing Plants in the Western Gulf Region. U. S. D. A., S. C. S. 28 pp.
WILLIAMS, R. E., JOHN T. CASSADY, LOWELL K. HALLS AND E. J. WOOL- FOLK. 1955. Range Resources of the South. Ga. Agric. Expt. Sta. Bull. N. S. 9. 31 pp.
A Comparison of Line Intercepts and
Random Point Frames for Sampling
Desert Shrub Vegetation’
JORGE M. BRUN AND THADIS W. BOX Research Assistant, Instituto National Technologia Agropecuaria, Buenos Aires, Argentina, and Assistant Professor of Range Management, Utah State University2
Although much work has been done in recent years on sampling vegetation, the accuracy of many sampling techniques has not been adequately tested in desert shrub types. Far too often visual or ocular methods have been relied upon for describing the vegetation of low producing deserts. With the coming of more intensive management, more efficient a n d accurate methods of study in g desert shrub vegetation must be found. The purpose of this study was to evaluate the relative merits of the line intercept and randomly located point frames in the study of desert shrubs.
During the summer of 1961, data were collected to determine
the efficiency of estimating per- centage ground cover and bo- tanical composition of vegeta- tion with randomly located line intercepts and point frames a Sagebrush-grass community and a Sagebrush-shadscale commu- nity. The Sagebrush-grass type was dominated by big sagebrush (Artimisia tridentata) w i t h an understory of bunchgrasses such as beardless wheatgrass (Agro- pyrom inerme) and forbs (Table 1). It is typical of much of the foothill range in the Intermoun- tain region. T h e Sagebrush- shadscale range selected is typi- cal of much of the winter ranges in the same area. The dominant species were b i g sagebrush, shadscale saltbrush (Atriplex
confertifolia) and s p i n y hop- sage (Grayia spinosa). L i t t 1 e herbaceous vegetation was pres- ent (Table 3).
In each vegetation type a one- half acre plot was selected for testing the methods. The posi- tion and starting point of each transect and point frame was located at random.
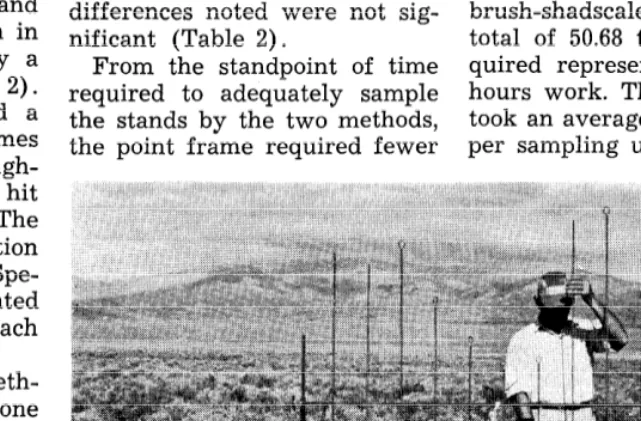
The line intercept method was a modification of that used by Canfield (1941) . Measurements of all plants that intercepted the 50 foot lines were recorded and the estimates of vegetation at- tributes calculated from these measurements. In shrubby vege- tation, the measurements were made in the crown spread inter- cepted by the line (Figure 1). Grasses and forbs were meas- ured at ground level. Each line intercept was considered as a single sampling unit (Brown, 1954) and 15 transects each 50
IPortions of this study were pre- sented in an M.S. Thesis at Utah State University.
feet long were used in each vege- tation type.
The point f r a m e used was similar to that used by Cook and Box (1961). It is essentially a modification for use in shrubs of the early frames used in sam- pling sward vegetation (Tinney, et. al., 1937). The frame is ap- proximately five feet long and has ten pins one-eighth inch in diameter, each separated by a space of six inches (Figure 2). Each frame was considered a sampling unit, and 15 frames were randomly located through- out each study area. The first hit on each plant was recorded. The percentage of hits on vegetation represented percent cover. Spe- cies composition was calculated from the percent of hits on each species.
Time consumed by each meth- &i was recorded, and used as one of the measures of efficiency. For each of the attributes meas- ured by the methods, the mean, the variance, the standard devia- tion, and the coefficient of varia- tion were computed by standard statistical procedures. The dif- ferences between means w e r e tested by the “t” test. The theo- retical number of samples re- quired to sample each attribute within ten percent of the true
mean with a five percent prob- ability of error were calculated using the procedure suggested by Snedecor (1956).
Results And Discussion The percent botanical com- position, as estimated by the point and line intercept, did not differ greatly for the Sagebrush- grass type. The line intercept es- timated slightly higher percent- ages of shrubs and forbs and somewhat lower percentages of grasses than did the point frame. Only small differences in indi- vidual species were noted (Table 1). The differences w e r e not statistically significant (Table 2).
Differences in botanical com- position estimates were some- what greater between sampling methods in the Sagebrush-shad- scale community. In the sparse desert type, the line method es- timated a higher percentage of shrubs than did the point. Like- wise, grass and forb percentages were lower when estimated with the line intercept. However, the differences noted were not sig- nificant (Table 2).
From the standpoint of time required to adequately sample the stands by the two methods, the point frame required fewer
man-hours work than the line intercept method. In the Sage- brush-grass t y p e the average time used by one man to es-
bablish, read, and record the in- formation for each transect was 1.45 man-hours. Using the calcu- lated figure of 16.83 transects needed to sample the major spe- cies within ten percent of the mean the total time required to sample a similar area would be 29.27 man-hours. With the point frame an average of 19 minutes was required to establish, read, and record information from each sampling unit. The time re- quired to s amp 1 e the 136.28 frames needed to reach the same accuracy as the intercept method was about 20.26 man-hours.
In t h e Sagebrush-shadscale type the time used in each sam- pling unit was less than in the Sagebrush-grass type, but the variance was higher and re- sulted in a greater number of sampling units being needed to reach the desired accuracy. An average time of 55 minutes per transect was used in the Sage- brush-shadscale vegetation. A total of 50.68 transects was re- quired representing 46.27 man- hours work. The p o i n t frame took an average of nine minutes per sampling unit and required
FIGURE 2. Large point frame
in desert shrub vegetation,
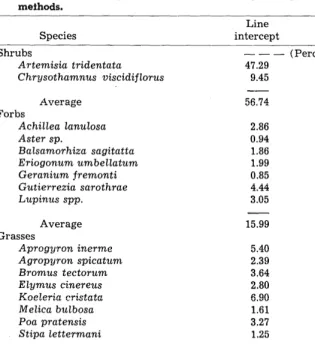
Table 1. Botanical composition in the Sagebrush-grass type based upon two
methods. used as a measure of efficiency for the two methods. From the
standpoint of t i m e the point frame required considerably less man-hours of work than did the line intercept to reach the same accuracy. In the Sagebrush-grass type, the point frame was 1.44 times more efficient in time than the 1 in e intercept. The point method was 1.85 times faster than the intercept in the Sage- brush-shadscale type. The rela- tive speed of the point frame in- dicates that it could be used for sampling species composition of desert vegetation with a con- siderable saving in time and money.
Species
Line intercept
Point frame
Shrubs --- (Percent) - - -
Artemisia tridentata 47.29 45.12
Chrysothamnus viscidiflorus 9.45 9.03
Average Forbs
Achilles Zanulosa Aster sp.
Balsamorhiza sagitatta Eriogonum umbellatum Geranium fremonti Gutierrezia sarothrae Lupinus spp.
56.74 54.15
2.86 0.94 1.86 1.99 0.85 4.44 3.05
2.90 0.83 1.78 1.11
- 4.61 3.17
Average Grasses
Aprogyron inerme Agropyron spicatum Bromus tectorum Elymus cinereus Koeleria cristata Melica bulbosa Poa pratensis Stipa lettermani
14.40
5.40 5.55
2.39 2.06
3.64 4.66
2.80 3.28
6.90 8.86
1.61 1.78
3.27 3.55
1.25 1.66
Average 27.26 31.40
Total 99.99 99.95
a total of 166.71 frames. The time consumed was 25 hours.
The precision of sampling can be measured by the coefficient of variation (ratio of the stand- ard deviation to the mean) or by the n u m b e r of samples needed to estimate t h e mean with equal precision and prob- ability if equal sized sampling
units are used (Cook and Box, 1961). However, in this study, sampling units of unequal size
(lines 50 feet long vs. frames five feet long) were used. Con- sequently the coefficient of vari- ation cannot be used as a meas- ure of precision.
The time needed to reach a pre-determined accuracy can be
Ground cover is one of the most c 0 m m 0 n measurements made in vegetation studies. Per- centage ground cover as used in this study is “The proportion of ground occupied by perpendicu- lar projection o n t o it of the aerial parts of individuals of the species u n d e r consideration”
(Greig-Smith, 1947). Only living material was measured in the study.
Estimates of ground cover by the two methods showed con- siderable differences. I n t h e Sagebrush-grass type the point frame estimated higher cover for all species-shrubs, forbs, and grass. These estimates were sig- nificantly higher at the .05 level than estimates made with the
Table 2. Means, standard deviations, coefficients of variaiions and number of sample observaiions required to
measure percentage of ground cover and percentage composition of major species in fwo types by fhe line- interception and point frame methods.
Line interception Point frame
Attributes measured - 1 - 1
X S C.V. n X S C.V. n
Percentage composition of major
species (Sagebrush-grass) 47.29 9.10 19.24 16.83 45.12 24.71 44.76 136.28
Percentage composition of major
species (Sagebrush-shadscale) 61.00 20.38 33.40 50.68 53.72 32.55 60.59 166.71 Percentage ground cover
(Sagebrush-grass) 54.82” 9.51 17.34 13.66 65.33” 11.25 17.22 13.47
Percentage ground cover
(Sagebrush-shadscale 19.58** 9.22 47.08 100.85 41.33’” 23.86 57.73 151.38
1 Number of sample observations based upon estimating the mean within ten percent of the true mean with a five percent probability.
* Denotes significance of the difference of the mean at 0.05 level. ** Denotes significance of the difference of the mean at 0.01 level.
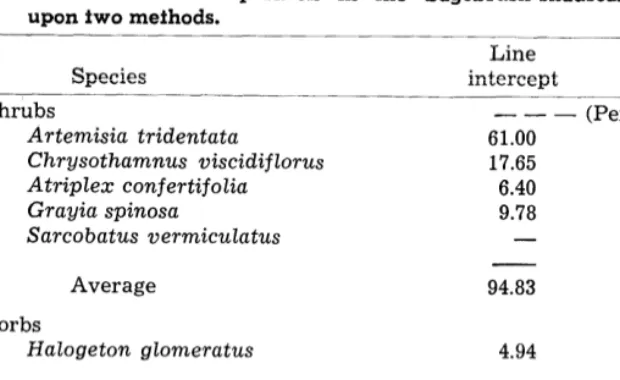
Table 3. Botanical composifion in the
upon fwo methods. Sagebrush-shadscale fype based cover in desert shrub vegetation.
Species Shrubs
Artemisia tridentata Chrysothamnus viscidijlorus Atriplex conjertijolia Gra yia spinosa
Sarcobatus vermiculatus
Line Point
intercept ___ frame --- (Percent) - - -
61.00 53.72 17.65 18.33 6.40 6.39 9.78 9.33
- 1.11
Average Forbs
Halogeton glomeratus
Grasses
Sitanion hystrix
Total
94.83 88.88
4.94 10.27
0.23 0.83
100.00 99.98
lines. Estimates from both meth- ods were within 10 percent of the true mean, therefore, some explanation other than chance must be “made for the differ- ences. The higher estimation of cover by the point method when compared to other methods has been noted by several investiga- tors working in many vegetation types (Goodall, -1952; Whitman and Siggeirson, 1954; Johnston, 1957; Cook and Box, 1961).
Goodall (1952) suggested that one of the major reasons for the higher estimation of cover by the point method was due to the diameter of the pins. Theoreti- cally, the point should be in- finitely small and any increase in size may lead to a higher es- timation of ground cover. Since a frame that can be used for sampling shrub vegetation, out of necessity, must be relatively large, and the pins must be suf- ficiently large to remain rigid in the frame, there could be some error due to pin size alone when sampling shrub cover with a large point frame. Although t,he one-eighth inch pins used in this study were ground to a fine point, some bias could have re- sulted in their use.
Although cover estimates were significantly higher w i t h the point than with the line in the Sagebrush-shadscale type, cover was under-sampled on both
areas. Therefore, the differences were not meaningful and could be due to chance alone. Only enough samples were taken to estimate the variance of this at- tribute in the community and no attempt was made to estimate absolute cover during the study. The time required to sample the percentage ground cover within ten percent of the mean on the Sagebrush-grass type was 23.54 man-hours for the line in- tercept. A total of 13.66 lines were needed. The same accuracy could be obtained with 13.47 point frames or 4.15 man-hours. Therefore, the point frame is 5.67 times faster than the line intercept for estimating cover in Sagebrush-grass vegetation.
On t h e Sagebrush-shadscale type, 100.85 intercepts w e r e needed. A total of 92.26 man- hours w a s needed to sample ground cover within ten percent of the mean with the line. The point method required 166.71 frames to reach the same ac- curacy. The time used was 22.42 man-hours work. The point frame was 4.11 times more effi- cient in t i m e for sampling ground cover in the shrub stand.
On the basis of time required per sampling u n i t , the point frame is from four to thirteen times more efficient than the line intercept for sampling per- centage composition and, ground
S e v e r a 1 investigators have studied the use of line intercepts in shrub vegetation (Baur, 1943; Kinsinger, et al., 1960) and have reported varying degrees of suc- cess with it. It is generally ac- cepted as one of the more rapid and accurate methods of estimat- ing attributes of desert shrubs. The point frame method has not received w i d e use in sparse, desert shrub vegetation. Results presented here indicate that the point frame can be modified for
use in sparse shrub types. Per- centage composition of the major species can be found much faster by the point method than by the more common line intercept, and there are no differences in the estimates of the population mean. F u r t h e r modifications, such as establishing a production value for each hit on a particular species, would make range sur- veys much more rapid and ac- curate in the arid regions. In vegetation similar to the typical Sagebrush-shadscale range used in this study, one worker could sample the range to within ten percent of the mean in three days using randomly located point frames.
Summary
LITERATURE CITED BAUER, H. L. 1943. The statistical
analysis of chaparral and other plant communities by means of transect samples. Ecol. 24: 45-60. BROWN, D. 1954. Methods of survey-
ing and measuring vegetation. Commonw. Bur. Past. Fld. Crops, Hurley, Berks., Bull. 42: l-223. CANFIELD, R. H. 1941. Application of
the line intercept method in sampling range vegetation. Jour. For. 39: 388-394.
COOK, C. W., AND T. W. Box. 1961. A comparison of the loop and point methods of analyzing vege- tation. Jour. Range Mangt. 14: 22-27.
GOODALL, D. W. 195212. Some con- siderations in the use of point quadrats for the analysis of vege- tation. Austral. Jour. Sci. Res. Ser. B 5: l-41.
GREIG-SMITH, P. 1957. Quantitive plant ecology. New York: Aca- demic Press.
JOHNSTON, A. 1957. A comparison of the line interception, vertical point quadrat and loop methods as used in measuring basal area of grass- land vegetation. Canad. Jour. Plant Sci. 37: 34-42.
KINSINGER, F. E., R. E. ECKERT, AND P. 0. CURRIE. 1960. A comparison of the line interception, variable
plot and loop methods as used to measure shrub-crown cover. Jour. Range Mangt. 13: 17-21.
SNEDECOR, G. W. 1956. Statistical methods (fifth edition). Iowa State College Press, Ames, Iowa. TINNEY, F. W., 0. S. AAM~DT, AND H.
L. AHLGREN. 1937. Preliminary re- port of a study on methods in botanical analysis of pasture swards. Jour. Amer. Sot. Agron. 29: 835-846.
WHITMAN, W. C., AND E. I. SIGGEIR- SON. 1954. Comparison on line in- terception and point contact method in the analysis of mixed grasses range vegetation. Ecol. 35: 431-436.
Some Important and Associated Native Grasses
on Central and South Florida Ranges
L. L. YARLETT
Range Conservationist, Soil Conservation Service,
Sebring, Florida
The m a j o r woodland-forage site in Central and South Florida is the flatwoods site. Originally, this was an open forest of com- mon slash pine (Pinus elliottii var elliottlii) with an understory of shrubs and tall grasses. Under the influence of a tropical or sub-tropical c 1 i m a t e 1 a r g e amounts of herbage were pro- duced, much of which was un- grazed. Unused g r a s s termed “rough” by present day ranchers was a fire hazard to early day turpentine operations. Burning of the accumulated grass was often done to protect the gum producing trees. Earlier, Indians often used fire to lure game into the “greened-up” areas.
Cattlemen have long recog- nized a decided increase in body weight of cattle which grazed the new growth of grass made available by burning the accu- mulated rough (Dacy 1940). Sea- sonal analyses of pineland three- awn (Aristida stricta) indicate a higher nutritive value in spring months on burned than on un- burned ranges and a sharp de- cline under both treatments dur- ing late May and June (Halls
et. al. 1952). Livestock placed on freshly burned areas will utilize nearly all grass species equally well until May or June. At this time the palatability of pineland threeawn or “wiregrass” de- creases sharply. The more de- sirable or tall, broadleafed grasses, however, are generally selectively grazed through much of the growing season. The pro- cess of repeated burning and un- controlled grazing has created the p r e s e n t wiregrass ranges w h i c h produce approximately 700 pounds of air-dry forage per acre. This herbage is generally available only during a two- month period in the early spring (Southern Forest Experiment Station 1958).
Well over 350 native species of grass are found in Florida, 147 of which furnish forage (Hitch- cock 1951; Rummell 1957). Very few have been closely observed for their reaction to grazing or position in p 1 a n t succession. Technical assistance to 1 a n d - owners in organized Soil Con- servation Districts in Florida has focused the attention of ranchers on several important species on
the flatwoods range site. Some have been mentioned only brief- ly in previous literature as being a part of the composition of a wiregrass range (Biswell et. al. 1943). Others were briefly recog- nized as contributing in part to the total available forage and classified as broad-leaf grasses or broom sedge or miscellaneous
(Halls et. al. 1956).