SimoneSottocornola1∗, on behalf of the ATLAS Collaboration
1INFN and Universitá di Pavia
Abstract.During Run 2 of the Large Hadron Collider (LHC) the instantaneous luminosity exceeded the nominal value of 1034 cm−2 s−1 with a 25 ns bunch
crossing period and the number of overlapping proton-proton interactions per bunch crossing increased to a maximum of about 80. These conditions pose a challenge to the trigger system of the experiments that has to manage rates while keeping a good efficiency for interesting physics events. This document sum-marizes the software based control and monitoring of a hardware-based track reconstruction system for the ATLAS experiment, called Fast Tracker (FTK), composed of associative memories and FPGAs operating at the rate of 100 kHz and providing high quality track information within the available latency to the high-level trigger. In particular, we will detail the commissioning of the FTK within the ATLAS online software system presenting the solutions adopted for scaling up the system and ensuring robustness and redundancy. We will also describe the solutions to challenges such as controlling the occupancy of the buffers, managing the heterogeneous and large configuration, and providing monitoring information at sufficient rate.
1 Introduction
The first data taking period (Run 1) of the Large Hadron Collider (LHC) has been extremely successful with e.g. the Higgs boson’s discovery and the placement of strong limits on new physics phenomena. After a shutdown period of almost two years, the LHC restarted with much higher instantaneous luminosity with respect to Run 1 (see Figure 1). In the Run 2 period, the LHC provided 13 TeV collisions, almost twice the energy of Run 1 with an inte-grated luminosity of40 fb−1per year and, therefore, increasing the discovery potential of the experiments. The greater instantaneous luminosity expected during Run 3 will provide an average number of simultaneous collisions (pileup) up to 80. In order to achieve the required online data reduction, the LHC experiments need to increase the use of silicon detector infor-mation at the trigger level, reconstructing the track trajectories close to the interaction points to distinguish the contribution of each pileup collision.
With its fine resolution and granularity, tracking information is critical for selecting which Level-1 triggered events should be kept for further processing. However, extensive tracking at Level-1 rate is prohibitively expensive in terms of processing time per event or needed
∗e-mail: simone.sottocornola@cern.ch
Figure 1.Left: Luminosity delivered by the LHC from 2011 to 2018 (Run 1 and Run 2). Right: Mean number of interactions per bunch crossing from 2015 to 2018 (Run 2)[1].
computing cores. Therefore, it is sparingly used within specific detector regions which have already been identified as potentially interesting by the Level-1 trigger and for full event tracking at low rates (few kHz). This approach has limitations in several cases. Firstly, there is a limit to either the number or size of the interesting regions processed by the second level of trigger which forces additional non-tracking cuts to be applied and results in reduced efficiency or higher thresholds for the considered objects. Secondly, there are cases where global event information, such as the location of the hard interaction vertex or the number of primary vertices in the event, are useful for object selections or corrections to the other de-tector quantities. Both problems are particularly critical for the trigger selection of signatures containing third generation fermions, such asτor b-jets, for which tracking information is fundamental to achieve high selection performance.
In order to cope with these problems, the ATLAS experiment has decided to include within the existing multilevel trigger architecture an electronic system, the Fast TracKer (FTK) pro-cessor, designed to perform real-time full track reconstruction from all the Level-1 accepted events observed in the Inner Detector (ID) for the LHC Run 3.
2 The ATLAS trigger system
Figure 1.Left: Luminosity delivered by the LHC from 2011 to 2018 (Run 1 and Run 2). Right: Mean number of interactions per bunch crossing from 2015 to 2018 (Run 2)[1].
computing cores. Therefore, it is sparingly used within specific detector regions which have already been identified as potentially interesting by the Level-1 trigger and for full event tracking at low rates (few kHz). This approach has limitations in several cases. Firstly, there is a limit to either the number or size of the interesting regions processed by the second level of trigger which forces additional non-tracking cuts to be applied and results in reduced efficiency or higher thresholds for the considered objects. Secondly, there are cases where global event information, such as the location of the hard interaction vertex or the number of primary vertices in the event, are useful for object selections or corrections to the other de-tector quantities. Both problems are particularly critical for the trigger selection of signatures containing third generation fermions, such asτorb-jets, for which tracking information is
fundamental to achieve high selection performance.
In order to cope with these problems, the ATLAS experiment has decided to include within the existing multilevel trigger architecture an electronic system, the Fast TracKer (FTK) pro-cessor, designed to perform real-time full track reconstruction from all the Level-1 accepted events observed in the Inner Detector (ID) for the LHC Run 3.
2 The ATLAS trigger system
Only a small fraction of the LHC collision event rate (4×10⁷events/s) can be stored for offline analysis, typically 1.5×10³events/s. To reduce the event rate while maintaining the maxi-mum efficiency, only events of interest for the physics program of ATLAS can be selected. The ATLAS trigger system [2] is composed of two levels: a hardware-based Level-1 (L1) trigger and a software-based High-Level Trigger (HLT), as shown in Figure 2. The L1 trigger is implemented using custom-made electronics, while the HLT is almost entirely based on commercially available computers and networking hardware. L1 uses the muon tracks and electromagnetic and hadronic clusters to identify interesting regions of the detector contain-ing high energy deposits, called regions of interest (RoI), and provides a rate reduction of a factor 400 in a latency time of 2.5µs. The HLT has access to the whole detector information within the regions defined by the L1, executing its rate reduction in a mean latency time of 200 ms and providing a final output rate of about 1.5 kHz. The HLT is based on a computing
farm containing almost 2000 computers, referred to as nodes, in which 40000 cores run the trigger software. If the HLT selection is successful, the full event is then reconstructed. All the data fragments coming from different detectors are collected in a single record which is transferred to the Data Logger for storage in local disks.
Figure 2. Sketch of the ATLAS trigger system with FTK included. FTK runs for each event that has been accepted by the hardware-based Level-1 Trigger and provides inputs for the software-based High Level Trigger.
Because of the long computational time required to reconstruct the tracks, the tracking infor-mation is only used at the HLT level and only for a subset of events. FTK will perform full track reconstruction on all the L1 accepted events, enabling the HLT to have access to the entire silicon detector tracks at an earlier event selection stage, allowing a dramatic increase in the trigger efficiency for a large group of different signatures.
3 FTK: operational principle
The FTK system is a hardware based tracking system designed to perform full scan tracking at the full L1 trigger rate (100 kHz), providing reconstructed tracks to the ATLAS HLT in a mean latency time of100µs, in time for the online trigger selection [3]. The FTK is a very
Figure 3.Sketch of the internal data-flow of FTK. The lines represent the communication links between boards.
are retrieved and a goodness of fit is determined using aχ2test for eight layers. The 8-layer tracks are then combined with the hits from the remaining four layers and a full 12-layer track fit is performed inside the SSB boards. The twelve-layer tracks are then sent to the HLT via the FLIC boards.
4 FTK online software
The FTK online software is used to configure, run, monitor and integrate the FTK system within the ATLAS data taking system.
The FTK system started its commissioning during Run 2, running in ATLAS a small fraction of its hardware. The full system is supposed to be integrated into ATLAS for Run 3. The FTK online software used the existing tools available from the common ATLAS framework, adapting them to the FTK use-case or, sometimes, making a completely new use of them (e.g. the use of EMON for the spybuffer publication, as will be shown in section 5.2). This choice lead us to provide a stable online software environment since the beginning of Run 2, while working on the identification of bottlenecks and criticalities. The issues spotted during this phase will be addressed in the upcoming long shutdown period of the LHC (2019-2020).
4.1 Run control
The ATLAS run Control software is in charge of performing the initialization and shutdown of TDAQ firmware and software, distributing commands to and synchronizing operations be-tween the boards.
In order to handle the control of complex hierarchical systems, the run control system is based on a Finite State Machine (FSM), in which the FTK system needs to fit its operations. The configuration of the FTK system is a very complex procedure, with many different operations to be executed following a well-defined order and to be repeated in case of error. In order to fit all these procedures into the ATLAS FSM transitions we had to define new FTK specific
the interfill period. During the configure transition of the data taking runs, the FTK online software only checks for the correctness of the content of the board memories through the computation of checksums (the loading logic is shown in Figure 4, left). These checksums are computed both via FW (on the memory content of the boards) and SW (on the desired configuration data) and compared with each other. In case of mismatches (e.g. because of errors in the configuration loading procedure), the software prevents FTK from starting the data taking session.
4.2 FTK automatic procedures
The ATLAS online software framework provides automatic procedures used to disable and recover faulty subsystem components while running: the Removal and Stopless-Recovery procedures [6]. Exploring these procedures is mandatory to minimize the impact on ATLAS data-taking while maximizing the run-time within the ATLAS system. Due to the system complexity, the development of such automatic procedures was particularly challeng-ing for FTK.
The Stopless-Removal procedure allows to exclude a part of the readout that is blocking the trigger (e.g. by introducing backpressure in the system) due to a fault, replacing the subsys-tem output with empty fragments. This operation requires a deep knowledge on the possible failure conditions, not yet available for a system under commissioning. In order to cope with this, we developed a watchdog application, monitoring the output of FTK and looking for missing/late fragments. The removal procedure is automatically triggered by the watchdog application when bad fragments are found to be more than a configurable threshold.
Figure 4. Left: FTK configuration loading logic. The loading of the configuration on the boards is performed only during a "configuration run" identified via the isLoadMode flag. Right: Sketch of the stopless-recovery procedure infrastructure of FTK. The Manager Application (MA) manages the communications between the board controller applications (RCDs), dispatcing the recovery transition actions and managing the internal FTK FSM.
4.3 Board access interference
During the commissioning period we observed problems deriving from concurrent accesses to the boards during the configuration/monitoring processes. These problems were due to non atomic configuration operations. The board configuration procedures require write-read accesses to some board registers, accesses to be repeated in case of errors. These procedures require not to be interrupted by other board accesses. If during one of these procedures a new board access is requested, for instance by a monitoring operation, the configuration procedure may fail. In order to solve these issues, we introduced the use of mutexes for the board access serialization, blocking all the board accesses when another non atomic operation is ongoing. Moreover, to overcome concurrency issues from different applications, system semaphores were adopted. These solutions fixed the concurrency issues, but introduced some constraints. The access serialization slowed down both the monitoring operation and the board respon-siveness to the control software. To solve this problem, we are working on the concurrent access management at firmware level. In case this is not possible, a restructuring of the code will be performed, moving the mutexes at a deeper level or changing the monitoring philosophy.
5 FTK monitoring
Monitoring the internal data flow and the quality of the output data is fundamental. The FTK monitoring is performed at different levels: board data flow, board data quality, system output data quality and high level data quality. While the last two levels are still under development, the board data flow monitoring and the board data quality monitoring were fundamental for the commissioning.
5.1 Board data flow monitoring
The board data flow monitoring is responsible to check the status of a given FTK board (e.g. the board is stuck - processing is ongoing). Monitoring this is of particular importance
5.2 Board data quality monitoring
The board data quality monitoring is responsible to check if an FTK board is producing a reasonable output. It is particularly critical for debugging the FW, representing a snapshot of the data contained in the board during the processing. The information on the data quality are stored in spybuffers: large board circular buffers in which copies of the internal process-ing data are stored. The typical use-case of the spybuffer is to monitor the input/output of a FW module prior to an error occuring. Since the FW debugging requires the collection of board spybuffers for the same event from different boards, a freeze mechanism, able to block the monitoring buffer writing as soon as an interesting error occurs, has been devel-oped. This freeze operation triggers the board FW to deliberately stop updating its spybuffers (without affecting the processing FIFOs). In order to access the spybuffer information, an online spybuffer readout system was provided making a new use of the ATLAS event moni-toring (EMON) service [10]. The spybuffer content is read out periodically from the boards through VME/IPBus protocol via a specific monitoring thread of the control software. Data are then made available to the EMON service wrapped inside a specific event format via a custom FTK-EMON interface. The interface was designed to allow the possibility to tem-porarily store spybuffers from different boards while waiting for client requests, and to allow data sampling based on selection criteria. The current spybuffer readout logic has some lim-itations. Due to the big spybuffer size the spybuffer readout for some boards is very slow (about 1 minute per board). Because of the mutexes required to solve the board concurrent accesses problem, the board data-flow monitoring is blocked for the whole spybuffer readout time, even if it has higher priority. In order to cope with this problem an optimization of the readout logic is under development. A single board register will be filled with a spybuffer er-ror status word by the FW every time a freeze will occur. This status register will be read out by the board data-flow monitoring thread and will be used as a trigger for the full spybuffer reading. The choice of reading the full spybuffer or not will be based on a set of predefined error-state selection criteria defined in the board configuration. With this logic the spybuffer readout will be performed only when a given error will occur.
6 Conclusion
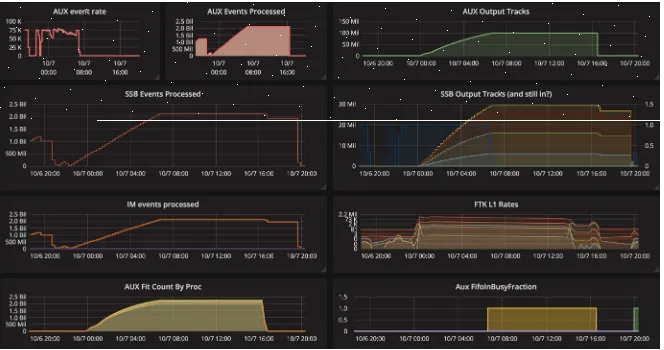
Figure 5.Example of high level monitoring of board data-flow variables for FTK (Grafana dashboard)
completed.
The FTK online software is fully integrated in the ATLAS online software framework. The design goal was to make use of the available ATLAS tools, while spotting problems and bottlenecks of the given implementation. The adopted solutions have been presented, togheter with some open problems and the solutions that will be developed in the future months. The monitoring has undergone big development in the last period, motivated by the advancement of the commissioning. In particular, the board data flow and the board data quality monitoring have reached a mature state, whith a few optimizations still possible.
References
[1] ATLAS experiment public results,
https://twiki.cern.ch/twiki/bin/view/AtlasPublic/LuminosityPublicResultsRun2, accessed: 2018-11-30
[2] ATLAS Collaboration,ATLAS detector and physics performance: Technical Design
Re-port, 1, CERN-LHCC-99-14, https://cds.cern.ch/record/391176
[3] ATLAS Collaboration,Fast Tracker: Technical Design Report, CERN-LHCC-2013-007,
https://cds.cern.ch/record/1552953
[4] VMEbus International Trade Association,The VMEbus specification manual(The Insti-tute of Electrical and Electronics Engineers, New York, 1987)
[5] PICMG-3.0,Advanced TCA base specification: advanced TCA(Wakefield, MA, 2005)
[6] Anders, G., Avolio, G., Lehmann Miotto, G., Magnoni, L., Journal of Physics: Confer-ence Series608(2015)
[7] Information Service User’s Guide, https://atlas-tdaq-monitoring.web.cern.ch/ atlas-tdaq-monitoring/IS/doc/userguide/is-usersguide.pdf, accessed: 2018-11-30
[8] OH User API documentation, https://atlas-tdaq-monitoring.web.cern.ch/ atlas-tdaq-monitoring/OH/refman/index.html, accessed: 2018-11-30
[9] Open platform for analytics and monitoring, https://grafana.com/, accessed: 2018-11-30 [10] Event Monitoring Design document, https://atlas-tdaq-monitoring.web.cern.ch/
![Figure 1. Left: Luminosity delivered by the LHC from 2011 to 2018 (Run 1 and Run 2). Right: Meannumber of interactions per bunch crossing from 2015 to 2018 (Run 2)[1].](https://thumb-us.123doks.com/thumbv2/123dok_us/7995565.1327632/2.482.75.411.70.194/figure-left-luminosity-delivered-right-meannumber-interactions-crossing.webp)
![Figure 1. Left: Luminosity delivered by the LHC from 2011 to 2018 (Run 1 and Run 2). Right: Meannumber of interactions per bunch crossing from 2015 to 2018 (Run 2)[1].](https://thumb-us.123doks.com/thumbv2/123dok_us/7995565.1327632/3.482.105.382.62.242/figure-left-luminosity-delivered-right-meannumber-interactions-crossing.webp)