Highly extensible modular system for online monitoring of
the ATLAS experiment
SergueiKolos1,∗
, on behalf of the ATLAS TDAQ Collaboration
1University of California Irvine, Department of Physics and Astronomy, 4172 Frederick Reines Hall
Irvine, CA 92697-4575, USA
Abstract.The unprecedented size and complexity of the ATLAS experiment required adoption of a new approach for online monitoring system develop-ment as many requiredevelop-ments for this system were not known in advance due to the innovative nature of the project. The ATLAS online monitoring facility has been designed as a modular system consisting of a number of independent com-ponents, which can interact with one another via a set of well-defined interfaces. The system has been developed using open source software and is based on the two in-house developed highly scalable distributed services for message passing and information exchange, which can deal with information of arbitrary types. The other monitoring components use these services to implement high-level facilities, such as Monitoring Data Archiving and Data Quality Assessment, as well as end user interfaces like the Data Quality and Online Histogramming displays. This proceedings describes the online monitoring system design and evolution showing how the chosen approach allowed the system to be gradu-ally extended by adding more high level tools and frameworks as requirements evolved.
1 Introduction
The unprecedented complexity of the ATLAS experiment [1] required more than ten years for the construction of the detector apparatus, which consists of more than 140 million electronic channels receiving data at the rate of 40 MHz. The computing resources required by the Trigger and Data Acquisition (TDAQ) system [2] for handling such a rate was provided by a large computing farm consisting of about 3000 high-end machines with more than 50000 software applications running on them. For efficient operation of this infrastructure a highly-scalable, distributed online monitoring system was absolutely indispensable.
2 The Online Monitoring System Architecture
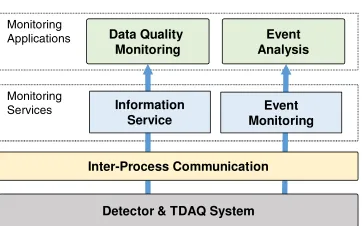
The ATLAS Online Monitoring system has been designed and implemented in parallel with the detector construction and the TDAQ system development. This imposed very strong requirements to the flexibility and extensibility of the Online Monitoring, which have been addressed by separating the system implementation into two layers: Monitoring Services and Monitoring Applications. This architecture is shown in Figure 1.
c
�From ATL-DAQ-PROC-2018-043. Published with permission by CERN.
Monitoring Services Monitoring
Applications Data Quality Monitoring
Detector & TDAQ System Event Analysis
Information Service
Event Monitoring
Inter-Process Communication
Figure 1.The high-level design of the Online Monitoring system. Shows only two Monitoring Appli-cations as an example.
3 Monitoring Services
The Monitoring Services are implemented on top of Inter-Process Communication (IPC) middle-ware [3], which provides a common basis for distributed communication in the AT-LAS TDAQ system. The public API of the Services hides the IPC layer, which makes the Monitoring Applications totally independent of the underlying communication technology. More importantly this approach also hides the complexity of the distributed TDAQ system from Monitoring Applications, which greatly simplifies Applications development and main-tenance. There are two independent Monitoring Services, which provide well-defined and stable APIs used by the Monitoring Applications for getting all the necessary data for online monitoring.
3.1 Information Service
The Information Service (IS) [4] is a primary and in most cases a unique source of infor-mation for most of the online monitoring analysis and GUI applications. The IS decouples providers and consumers of information providing a means of sharing information indepen-dently of their mutual location. It allows sharing of simple variables as well as user-defined data structures among arbitrary number of software applications and provides the compre-hensive API that supports most commonly used patterns for information access. Information providers can create, update or delete information objects, while information readers can get the value of any information object as well as enumerate all available objects; moreover in-formation receivers can subscribe to the repository to be notified about changes. In addition, it is possible to send commands to any information provider through IS. For an ATLAS data taking session IS handles about hundred million information objects which are constantly updated with a frequency ranging between 0.01 and 1 Hz for different information types.
3.2 Event Monitoring Service
Monitoring Services Monitoring
Applications Data Quality Monitoring
Detector & TDAQ System Event Analysis Information Service Event Monitoring Inter-Process Communication
Figure 1.The high-level design of the Online Monitoring system. Shows only two Monitoring Appli-cations as an example.
3 Monitoring Services
The Monitoring Services are implemented on top of Inter-Process Communication (IPC) middle-ware [3], which provides a common basis for distributed communication in the AT-LAS TDAQ system. The public API of the Services hides the IPC layer, which makes the Monitoring Applications totally independent of the underlying communication technology. More importantly this approach also hides the complexity of the distributed TDAQ system from Monitoring Applications, which greatly simplifies Applications development and main-tenance. There are two independent Monitoring Services, which provide well-defined and stable APIs used by the Monitoring Applications for getting all the necessary data for online monitoring.
3.1 Information Service
The Information Service (IS) [4] is a primary and in most cases a unique source of infor-mation for most of the online monitoring analysis and GUI applications. The IS decouples providers and consumers of information providing a means of sharing information indepen-dently of their mutual location. It allows sharing of simple variables as well as user-defined data structures among arbitrary number of software applications and provides the compre-hensive API that supports most commonly used patterns for information access. Information providers can create, update or delete information objects, while information readers can get the value of any information object as well as enumerate all available objects; moreover in-formation receivers can subscribe to the repository to be notified about changes. In addition, it is possible to send commands to any information provider through IS. For an ATLAS data taking session IS handles about hundred million information objects which are constantly updated with a frequency ranging between 0.01 and 1 Hz for different information types.
3.2 Event Monitoring Service
Physics experiments require a special type of monitoring for assuring the quality of data being taken. There are many parameters, which may affect data quality including trigger configuration, calibrations constants, read-out electronics settings and so on. Analyzing all possible combinations of them would be quite complicated and may not provide a desired level of confidence. On the other hand there is a straightforward strategy for data quality assessment, which is based on the analysis of a statistical sample of raw data of collision events while they are passing through the DAQ system. This kind of analysis is normally
done on a dedicated set of computers in order to minimize the possible impact on the data taking efficiency.
The Event Monitoring service (Emon) is a dedicated data distribution service, which is responsible for providing samples of collision events to the data analysis processes. Contrary to the IS the Emon uses peer-to-peer communication model, which is more suitable for deal-ing with ATLAS events that have an average size of about 1MB and have to be sampled with the rate of a few Hertz. The Emon provides a well-defined Event Sampling interface which is implemented by multiple TDAQ components allowing to sample fully built events as well as sub-detectors event fragments. The data access API, provided by the Emon does not depend on the origin of the received events which makes it possible to use the same applications for analyzing data from different sources.
4 Monitoring Applications
The top-most layer of the Online Monitoring system is composed of a number of high-level software applications which cover different aspect of the detector and TDAQ system mon-itoring. They have been used for recognizing problems during data taking as well as for performingpost mortemanalysis of complex issues, which cannot be quickly resolved on the spot while running. These applications in general do not depend on one another and there-fore can be disabled and enabled for a given data taking session without affecting the rest of the system. The Monitoring Applications have been designed and implemented gradually when new requirements have been put in place or when the computing resources have been sufficiently evolved. The Monitoring Applications can be virtually split into multiple groups based on their functionality as presented in the following sub-sections.
4.1 Event Analysis Applications
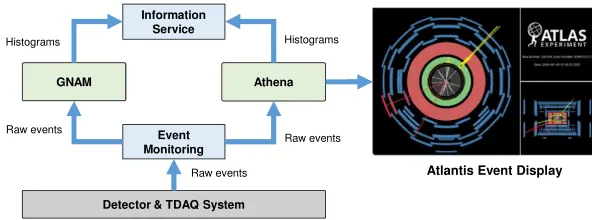
There are two types of software applications, which have been used by the ATLAS online monitoring for analyzing raw collision events: GNAM [5] and Athena [6] based monitoring tasks. Both of them produce histograms based on the content of the the events and publish these histograms to IS as shown in Figure 2.
GNAM
Detector & TDAQ System Athena Information Service Event Monitoring Histograms Histograms Raw events Raw events
Raw events Atlantis Event Display
Figure 2.Event Analysis Applications interactions with the Monitoring Services.
4.1.1 Using Athena framework for online monitoring
the off-line analysis algorithms into the online monitoring environment, two Athena specific interfaces have been integrated with the Monitoring Services:
• Athena ByteStreamInputSvc interface has been implemented using Emon API for reading raw event samples from the TDAQ system
• Gaudi ITHistSvc service has been used to read histograms produced by Athena algorithms and publish them to IS
For a typical data taking session about hundred Athena monitoring processes are running on the dedicated monitoring farm analyzing the raw events delivered by the Emon service in real-time.
4.1.2 Atlantis Event Display
Integrating Athena into the online monitoring environment gave as well a benefit of using At-lantis Event Display application [8], which had been implemented in Athena, for displaying ATLAS collision events in real-time. That was extremely useful as Atlantis shows a graph-ical representation of what is happening in the detector providing an experienced user with the necessary information to make fast and correct conclusions about the underlying physics processes.
4.1.3 GNAM Framework
GNAM (Gis forNon-AthenaMonitoring) is a light-weight online-oriented counterpart of the Athena framework optimized for detector functionality monitoring. This kind of monitoring usually does not require complex analysis algorithms but rather prioritizes fast statistics ac-quisition, which makes a simple dedicated framework an attractive alternative to Athena-based monitoring due to a very low memory footprint and CPU consumption overhead. GNAM uses the same working model as Athena monitoring by getting events via Emon and publishing histograms produced by the detector specific plug-ins to IS. The plug-in based de-sign of GNAM allows to separate common interactions with the Emon and IS Services from analysis algorithms, which are sub-detector specific and implemented by the relevant experts.
4.2 Monitoring Information Gatherer
The Monitoring Information Gatherer or simply Gatherer [9] was originally developed for summing histograms produced by the ATLAS High Level Trigger (HLT) [2] system. AT-LAS HLT is a software based trigger that consists of about 50’000 homogeneous software processes distributed over 2’500 commodity PCs. All the processes are configured in exactly same way and run the same set of algorithms and therefor publish the same set of histograms to the IS. This gives in total about hundred million histograms and in order to get meaningful information from them they have to be summed together. Gatherer scales well to the HLT computing farm size by running a pre-configured number of instances in a hierarchical setup. At the low level of this hierarchy each instance subscribes to a particular sub-sets of HLT his-tograms in IS and sum them whenever they are updated. The summary hishis-tograms produced as the result of this procedure are published back to the IS as shown in Figure 3. This allows higher-level Gatherers to subscribe to these histograms for providing aggregated sums.
Being originally developed for summing HLT histograms the Gatherer application has been re-used in its original form for summing the histograms produced by the Athena mon-itoring applications. Later on the Gatherer has been extended to be able to sum arbitrary IS information to be used for summing statistics produced by the DAQ applications as well.
Gatherer
Detector & TDAQ System
Athena Information Service Histograms Information sums Histograms, Statistics Histograms, Statistics
Figure 3.Online monitoring information gathering.
4.3 Data Quality Monitoring Applications
Histograms produced by the Event Analysis Applications contain all the necessary informa-tion for assessing the quality of the collision events. There are two possible ways to use this information. In the first place a shifter can analyze a small subset of the histograms by eyes using instructions provided by the detector experts. The Online Monitoring system provides a configurable GUI application which is called Online Histogram Presenter (OHP) [10] to facilitate this task.
Online Histogram Presenter DQM Framework Information Service Histograms DQ results Histograms, DQ results DQM Display Histograms
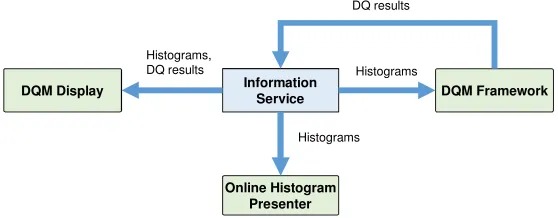
Figure 4.Data Quality monitoring organization.
For obvious reasons this approach does not scale as it can only be applied to a relatively small number of histograms while there are many others, which contain essential information about data quality. For the massive histograms analysis a dedicated application called Data Quality Monitoring Framework (DQMF) [11] has been developed. Figure 4 shows the global structure of the Data Quality Monitoring for the ATLAS experiment.
4.3.1 Online Histogram Presenter
4.3.2 Data Quality Monitoring Framework
The Data Quality Monitoring Framework (DQMF) is used to automatize data quality assess-ment by applying DQ algorithms to the histograms produced by the Event Analysis Appli-cations. These results are displayed to the shift crew in a hierarchical way and archived for future reference. Using them the shift operator can quickly spot problems and easily identify their origin.
DQMF works by subscribing to IS for the histograms defined in the XML configuration file together with the algorithms which have to be applied to them. When a histogram is updated DQMF receives the new version of the histogram from IS and executes an appropriate algorithm getting back aRead, Yellow, Greencolor code together with an optional set of string tags that provide some human readable explanation of this result. Finally DQMF publishes the produced result to IS.
DQMF provides a number of predefined algorithms for the most common operations like reference comparison, histogram fitting, thresholds application, etc. In addition a user can develop custom algorithms and integrate them to the framework. In ATLAS the common algorithms library, which is shared by the off-line and on-line data quality assessment con-tains now about 170 algorithms, which cover most of the analysis types one could use for histograms.
4.3.3 Data Quality Monitoring Display
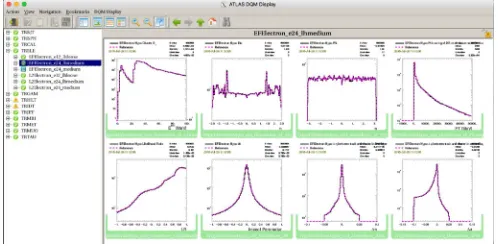
The Data Quality Monitoring Display (DQMD) [14] is a GUI application which is used by the ATLAS shift crew for displaying results produced by the DQMF. DQMD provides multiple ways of visualizing DQM information. It can display detector status in a graphical form defined by the respective sub-detector experts as well as show the source histograms, which have been used to produce the corresponding DQ results. Figure 5 shows the histogram view of the DQMD for the ATLAS HLT system.
Figure 5.Data Quality Monitoring Display for the ATLAS HLT System.
4.4 Archiving Monitoring Information
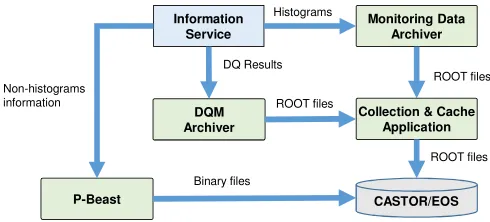
In ATLAS several gigabytes of monitoring data are passed through the IS for an average data taking session. All this data are archived to be used for post mortem analysis of the data taking activities as well as references for the future runs. There are several applications, which store monitoring data of different kinds using in each case a storage technology that is the most appropriate for the given data type, data volume and access patterns. Figure 6 shows how these applications interact with the IS.
CASTOR/EOS Monitoring Data
Archiver Information
Service
ROOT files Non-histograms
information
P-Beast
Histograms
Collection & Cache Application DQM
Archiver
ROOT files DQ Results
ROOT files
Binary files
Figure 6.The Monitoring Archiving Applications interactions with the Monitoring Services.
4.4.1 Monitoring Data Archiver
Depending on its configuration Monitoring Data Archiver (MDA) [15] can save histograms at the end of the run as well as periodically during the run. MDA writes histograms to ROOT files with respect to the given configuration and sends these files to the Collection&Cache (CoCa) [15] Application.
4.4.2 Data Quality Monitoring Archiver
The Data Quality Monitoring Archiver (DQMA) has been added to the monitoring system during the first long shutdown. It behaves in a similar way to MDA, but instead of storing histograms it subscribes to the IS for all the DQ results produced by DQMF and saves them to the ROOT file. At the end of the run DQMA send this file to CoCa to be saved to the mass-storage. DQMA provides as well the Web-based interface to browse the archived DQ results.
4.4.3 Collection&Cache Application
CoCa has been developed to provide an interface to the mass-storage system, which is inde-pendent from a particular implementation technology. From the beginning the CASTOR [16] system has been used for storing online histogram files so CoCa was originally designed to mitigate the issues, which are common for any tape-based storage system:
• gather small files into larger archives, in order to prevent the proliferation of small files on the tapes;
• offer a fast access to the recently saved files, keeping a copy on disk in the local network.
Recently the mass-storage back-end has been changed to EOS [17], which is a hard-disk based storage system. The only software component affected by this change was the CoCa Application itself as both MDA and DQMA have not been using the mass-storage system directly.
4.4.4 P-Beast
handles an information update frequency of about 10 kHz. For an average run that results in a couple of billion numbers been saved and indexed for the fast access. P-Beast provides REST [19] interface for data access as well a configurable Grafana [20] dashboard for displaying time-line of selected information values.
5 Conclusion
The ATLAS Online Monitoring system has been successfully used since the beginning of the ATLAS experiment. The system has been designed and implemented using a modular approach were new components have been gradually added during the life-time of the exper-iment without affecting the rest of the system. This approach was proved to be extremely flexible in terms of the system extensibility and facilitates system support and maintenance during operation. Now we are in the process of designing new extensions for the system to be used during the ATLAS Run 3 operations.
References
[1] ATLAS Collaboration, JINST3, S08003 (2008)
[2] ATLAS TDAQ Collaboration, JINST11, P06008 (2016)
[3] R. Jones, L. Mapelli, S. Kolos, Yu. Ryabov, IEEE Trans. Nucl. Sci.47, 331 (2000) [4] S. Kolos, G. Boutsioukis, R. Hauser, J. Phys. Conf. Ser.396, 012026 (2012) [5] D. Salvatore et al., Nucl. Phys. Proc. Suppl.172, 317 (2007)
[6] P. Calafiura, C. Leggett, R. Seuster, V. Tsulaia, P. Van Gemmeren, J. Phys. Conf. Ser.
664, 072050 (2015)
[7] G. Barrand et al., Comput. Phys. Commun.140, 45 (2001) [8] A.A. Nepomuceno, PoSHCP2009, 089 (2009)
[9] P. Renkel, J. Phys. Conf. Ser.219, 022043 (2010)
[10] A. Dotti, P. Adragna, R.A. Vitillo, J. Phys. Conf. Ser.219, 032037 (2010)
[11] A. Corso-Radu, H. Hadavand, Y. Ilchenko, S. Kolos, H. Okawa, K. Slagle, A. Taffard, J. Phys. Conf. Ser.331, 022027 (2011)
[12] R. Brun, F. Rademakers, S. Panacek, Conf. Proc.C000917, 11 (2000) [13] M. Dalheimer,Programming with Qt, 2nd Edition(O’Reilly Media, 2010)
[14] Y. Ilchenko, C. Cuenca Almenar, A. Corso-Radu, H. Hadavand, S. Kolos, K. Slagle, A. Taffard, J. Phys. Conf. Ser.219, 022035 (2010)
[15] P. Zema, IEEE Nucl. Scien. Symp. Conf. Rec.6(2007)
[16] J.P. Baud, B. Couturier, C. Curran, J.D. Durand, E. Knezo, S. Occhetti, O. Barring, eConfC0303241, TUDT007 (2003),cs/0305047
[17] E.A. Sindrilaru, A.J. Peters, G.M. Adde, D. Duellmann, J. Phys. Conf. Ser.898, 062032 (2017)
[18] A.D. Sicoe, G. Lehmann Miotto, L. Magnoni, S. Kolos, I. Soloviev, J. Phys. Conf. Ser.
368, 012002 (2012)
[19] L. Richardson, S. Ruby, M. Amundsen,RESTful Web APIs(O’Reilly Media, 2013) [20] The open platform for beautiful analytics and monitoring, https://grafana.com/,
