20 ROBERTSON ET AL.
Fig. 3. Cattle grazing the Claypan range site, Jackson County, Colorado.
Summary
In North Park, Colorado, the alkali sagebrush plant commu- nity stands out in sharp contrast from adjacent sagebrush range. Its abrupt boundary makes it an excellent site on which to study range site and soil correlation.
In preparing the legend for the North Park Standard Soil Sur- vey, the soil and vegetation of this site were compared with the adjacent big sagebrush domi- nated range site.
A marked difference occurs in
plant composition, total annual plant yield, and soil characteris- tics between the Claypan (al- kali sagebrush) and the Moun- tain Loam (big sagebrush) range sites. These differences were consistent throughout the area studied.
The Claypan range site is the result of a shallow, restrictive soil zone which prohibits the penetration of all but the finest roots. The alkali sagebrush plant community, being drouth- adapted, can survive under this
Fertilization and Management lmplrcatlons
on California Annual-Plant Range
C. EUGENE CONRAD, E. J. WOOLFOLK,l and DON A. DUNCAN
Range Conservationists, Pacific Southwest Forest and Range Experiment Station, Forest Service, U. S. De- partment of Agriculture, Berkeley, California
Highlight
The resulfs from the first three years of a siudy at the San Joaquin Experimental Range on the effect of sulfur and sulfur-plus-nitrogen on management of annual-plant range are reported. Fertilizer increased produdion, especially in herbage yield and grazing capacity. Some effects these resulis may have on fhe costs of grazing cattle, especially in ihe green-forage season, are dis- cussed.
Herbage yield on many annual- plant ranges in California has been increased by fertilizing with s u 1 fur or sulfur-plus-nitrogen. The increase from use of sulfur has been as much as 200%; sul- fur-plus-nitrogen could bring even greater increases. When herbage yield is increased, graz- ing capacity generally increases.
condition. On the other hand, this soil characteristic precludes the survival of big sagebrush and associated species. The big sage- brush community occurs only on moderately deep to deep, loamy soils where deep root penetration is possible.
After range sites and soils are correlated, it is possible to de- termine range sites from the soil survey. This is being done throughout the United States today by the National Coopera- tive Soil Survey.
LITERATURE CITED BEETLE, A. A. 1960. A study of sage-
brush. Univ. of Wyoming Agr. Exp. Sta. Bull. 368. 83 p.
PASSEY, H. B., AND V. K. HUCHIE. 1962. Sagebrush on Relict Ranges in the Snake River Plains and Northern Great Basin. J. Range Manage. 15: 274-278.
ROCKY MOUNTAIN ASSOCIATION OF GEOLOGISTS. 1957. Guidebook to the Geology of North and Middle Park Basins, Colorado. 152 p.
SOIL SURVEY STAFF. 1951. Soil Survey Manual. U. S. Dep. Agr. Handbook No. 18. 503 p.
THATCHER, A. P. 1959. Distribution of sagebrush as related to site differ- ences in Albany County, Wyoming. J. Range Manage. 12:55-61.
Wagnon et al. (1958) found that daily gains in steers also in- creased on sulfur-fertilized ranges.
Sulfur deficiency has been found in more than half the counties in California. And nitro- gen deficiency is assumed to be at least as widespread (Martin, 1958). But as researchers and ranchers have become more ex- perienced in using fertilizers, they have found that gains have brought more problems along with more returns.
IPresently Project Manager, Esta- cion Experimental Agropecuriu, CasiZZe de Correo No. 6, Conception
Increased returns are mainly from the greater number of live- stock that can be grazed. To graze the maximum number of animals, a rancher must know in advance how much herbage will be produced. He must consider land values before deciding whether to fertilize; he must also consider his ability to pre- dict weather, and decide how often to fertilize. It is possible that buying or renting more land may be less expensive than buy- ing and applying fertilizer.
Some information on manag- ing and integrating fertilized and unfertilized annual-plant range is now available from a study started in 1959 at the San Joaquin Experimental Range, near O’Neals in the central Si- erra Nevada foothills of Cali- fornia. The Experimental Range is maintained by the Pacific Southwest Forest and Range Ex- periment Station of the Forest Service, U. S. D. A. This paper reports results from the first 3- year fertilization cycle, com- pleted in 1962. Some preliminary results were reported by Wool- folk and Duncan (1962).
The Study
The study design includes twelve separate range units at the Experi- mental Range. Hereford yearling calves-heifers the first year and steers the second and third years- were used in the study (Fig. 1). Fer- tilizer was applied in the fall of 1958 on the range units that were to be grazed in the dry-forage season, and in the fall of 1959 on the range units to be grazed in the green-forage season. Four range units were fer- tilized with gypsum to furnish 60 lb/acre of sulfur. Four others were fertilized with a mixture of ammoni- um sulfate and ammonium nitrate to furnish 60 lb of sulfur plus 80 lb/acre of nitrogen. The remaining four units were left unfertilized.
The cattle started grazing on dry summer feed, wintered on adjacent unfertilized range, and finished on green feed the next spring. Half the range units were stocked to capacity in June or July to obtain moderate use of the herbage by the end of the
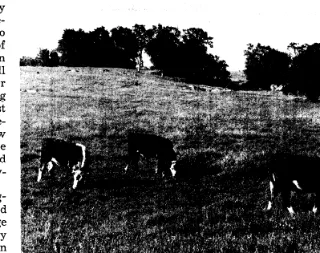
Fig. 1. Yearling steers grazing green annual-pIant herbage on unfertilized range at the San Joaquin Experimental Range.
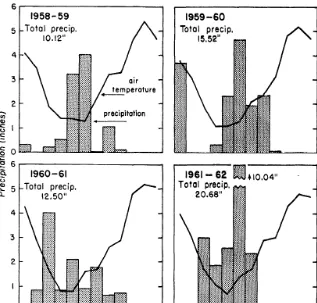
dry-forage season, in October or November. The other range units were similarly stocked during the green-forage season, usually the first part of February through early June. In this report, these two forage sea- sons will be referred to as the dry and green seasons, and the range units grazed during each as dry- and green-season units, repectively.2 Precipitation at the San Joaquin Experimental Range from 1934 through 1962 averaged about 19 inches per year, almost all rain. About 3/4 of the total fell during the period from December through March (Fig. 2). Only the 1961-62 rainfall was average or better com- pared with the 29-year average (Fig. 3).
Past experience has shown that most plant growth occurs when mean daily temperature is above 50F. Average daily temperature in March generally is above 50F, but in 1961 and 1962, it was not until April that the average daily temperature rose above 50.
2For staCsticaZ analysis the study was set up as a split plot with two blocks. The main plot effects were between forage seasons because of the crossover grazing program de- scribed bp Woolfolk and Duncan
(1962). The sub-plot effects were due to fertilizer treatments.
Vegetation Resulfs
Even though rainfall was be- low the long-term average ex- cept in the 1961-62 weather year, herbage production exceeded the 1,650 lb/acre long-term average in both 1960 and 1962. In general, if rainfall is below average, total herbage yield is expected to be below average. This was gen- erally true of herbage yield, ex- cept in 1960 when it was 13% above average even though rain- fall was 18% below average. Ap- parently spring rainfall in 1960, along with slightly warmer-than- average March temperatures, made up for the over-all lack of rainfall. In 1962 yield was 11% above average; rainfall was 9% above average.
22 CONRAD ET AL.
6 9o”
1958- 59 1 1969-60
SO0
7o”
60”
0
SONDJ FMAMJJA SOND J FMAMJJ A
Months Months
Fig. 2. Monthly rainfall and mean air temperature, September through August, San Joaquin Experimental Range, 1958.62.
60’
30”
at the
Table 1. Yield of annual-plant herbage, in lb/acre air-dry, San Joaquin Experimental Range (1959-62).
Fertilizer (dry-season units) Fertilizer (green-season units)
Year None Sulfur Sulfur+ None Sulfur Sulfur+
nitrogen nitrogen
1959 692 884”s 2,513** - - -
1960 1,662 2,066* 3,485** 2,074 2,179’18 4,906” *
1961 1,307 1,529”s 2,020** 1,477 1,859”s 2,235* *
1962 1,829 2,345* 2,712**
Table 2. Percent weighf composifion of annual-plant herbage af the San Joaquin Experimental Range (1959.62).1
Fertilizers
Plants 1959 1960 1961 1962
‘None S S+N None S S+N None S S+N None S S+N
Grasses3 58 71 71 26 35 45 35 42 59 58 54 64
Forbs:
Filaree 39 26 27 63 58 49 55 47 38 22 21 23
Clover 1 1 1 1 1 (4) 2 7 2 8 12 7
Other 1 2 1 10 7 6 7 4 1 12 12 6
1 Except for 1959 and 1962 these data were calculated from the combined herbage production on units grazed in the dry- and green-forage seasons. The 1959 composition was calculated from the units grazed in the dry season and the 1962 composition from the units grazed in the green season. S=sulfur fertilizer, S+N=sulfur-plus-nitrogen fertilizer.
Grasses include all true grass species plus small amounts of grasslike species.
Less than 0.5 percent.
.
Bentley et al. (1958). Increase per year averaged about 270 lb on the dry-season units and 300 lb on the green-season units.
What is most striking about the units fertilized with sulfur- plus-nitrogen is the comparative- ly high yield in each year, in- cluding 1959, A less obvious but important comparison was the effect of dry weather on the carryover of sulfur-plus-nitrogen fertilizer. On the dry-season
units fertilized with sulfur-plus- nitrogen, yield was 1,820 lb/acre higher than on the unfertilized units in both of the first two years. On green-season units, herbage yield was 2,830 lb/acre more than on unfertilized units in 1960, but only 760 lb more in 1961. The third-year in- crease was about 700 lb/acre on the dry-season units and about 900 lb on the green-season units. The average increase from sul- fur-plus-nitrogen for three years was about 1,400 and 1,500 lb/acre on the dry-season and green-sea- son units, respectively.
Botanical composition was changed drastically in 1960 by poor rainfall distribution the preceding fall and winter. In 1959 herbage composition was roughly 58% grass and 40% filaree (Erodium spp.) on the unfertilized units (Table 2) . This is a fair balance of grass and filaree. In 1960 the balance was
6
SONDJFMAMJJA
90”
Months
upset-26% grass and more than 60% filaree. Reppert and Dun- can (1960) have suggested that a fall drought, which lasted for more than three months in 1959 and followed an early storm that produced 3.75 inches of rain (Fig. l), probably caused these un- usual composition percentages. Finally, in 1962 there was a favorable balance of 58% grass and 22% filaree. Fertilizer ap- parently decreased the effect of the long fall drought in 1959. Even in 1960, grass made up 35 and 45% of the weight on the units fertilized with sulfur and sulfur-plus-nitrogen.
Clover response to sulfur did not begin to approach the pro- portions reported by Bentley et al. (1958) and Green et al. (1958) until 1961. This lack of response was apparently the re- sult of low rainfall or poor rain- fall distribution or both.
Grazing Seasons and Grazing Use
The animals started grazing on dry-season units when most of the plants were dry. They were not moved to the wintering unit until herbage use was satis- factory or the herbage was severely leached by fall rains. During the winter some new plant growth was available along with leached old growth and supplemental feed. The animals were put into the green-season units when plant growth became sufficient to produce gain with- out supplemental feed. The start- ing dates of green-season grazing varied between treatments and between years, depending on fertilizer and weather.
In each year of the study, more days of grazing were provided by fertilized range than by un- fertilized range (Table 3). The amount of grazing use furnished by dry- and green-season units depended on the amount of herb- age that cattle could use without overgrazing. By using extra ani- mals, we attempted to obtain equal use on all units by the
Table 3. Animal-days grazing per acre by yearling cattle af the San Joaquin Experimental Range (1959-62).
Fertilizer (dry-season units) Fertilizer (green-season units)
Year None Sulfur Sulfur+ None Sulfur Sulfur+
Nitrogen Nitrogen
iB59 7.8 8.5”~ _____- 28.1** - - -
1960 19.7 31.7118 57.3** 20.4 40.5* 69.31* *
1961 29.6 41.8ns 52.3’ 24.81 43.4* 52.21*
1962 - - - 23.1 40.2ns 45.3*
1 Adjustments in unit boundaries and correction of measurement errors
changed these statistics since first published (Woolfolk and Duncan, (1962),
but did not affect prevailing trends or resulting comparisons.
end of the respective grazing sea- sons. We counted the number of steer-days-heifer-days in 1959- 60-and calculated the actual animal-days use per acre. For the dry and green seasons com- bined, an average of 21 days/acre of grazing per year was provided from the unfertilized range, 34 days from the sulfur-fertilized range, and 50 days from the sul- fur-plus-nitrogen-fertilized
range. To check the equality of use, we estimated the amount of residue remaining in each unit after grazing was completed. The differences between units were small in any single year.
Grazing use can be a valuable criterion for evaluating the effect of a change in a range operation. It is especially sensi- tive to the amount of feed avail- able. In the annual-plant range type, differences in the amount of feed resulting from some treatment can be more important than differences in quality of feed, especially in the green sea- son Most of the herbaceous spe- cies are high quality for at least part of the growing period.
The amount of grazing pro- duced in 1959 was lower than we hoped for, but the fertilizer ap- plied in 1958 was not lost. The response in 1960, and again in 1961, demonstrated that the effects of sulfur or sulfur-plus- nitrogen extend beyond one year. The sulfur-fertilized units grazed during the dry season produced from one additional day/acre in 1959 to 12 additional days in 1960 and in 1961. The sulfur-plus-ni- trogen-fertilized units produced
20 more days grazing per . acre than the unfertilized units in 1959; 38 more days in 1960; and 23 more days in 1961.
The extremely dry 1958-59 sea- son was reflected in days of graz- ing in 1959 and in herbage yield. The most encouraging result that year was the grazing produced by the sulfur-plus-nitrogen-fer- tilized units. Less than 8 days grazing per acre were produced on the unfertilized units and only 8.5 days on the sulfur-fer- tilized units. The 28 days grazing per acre from the sulfur-plus- nitrogen-fertilized units were nearly 4 times that from the un- fertilized units; still, the 28 days were only about what we nor- mally would expect from an un- fertilized range,
The grazing produced by the unfertilized green-season units did not vary among years nearly as much as did the grazing pro- duced by the unfertilized dry- season units (Table 3). Weather is the basic reason for less dif- ference among the green seasons. A single dry year accounted for the extreme variation among the dry seasons: 22 days/acre be- tween the best and poorest. There were no outstandingly dry or wet years among the three green seasons; consequently, less than 4.5 days/acre difference sepa- rated the best from the poorest green season.
24 CONRAD ET AL.
dry season, but only 3.5 days dif- ference for the same comparison among green seasons. The sulfur- plus-nitrogen-fertilized green- season units produced 69 days/- acre in 1960; 52 days in 1961; and 46 days in 1962. This is the way we expected sulfur-plus-nitrogen fertilizer to affect grazing capac- ity.
Part of the increased grazing capacity on the sulfur-plus-nitro- gen-fertilized units resulted from earlier range readiness. In both 1960 and 1961 animals were turned in 25 days earlier than on the other units. Increased early grazing capacity could be one of the most valuable aspects of sul- fur-plus-nitrogen-fertilized
range. The range was ready for grazing when the herbaceous plants developed enough to feed the animals adequately. Even at these early dates, February and January in 1960 and 1961, little trampling damage resulted be- cause most of the soils dry rapidly.
Caifle Performance
So far in this study, total gain per animal has averaged from more than 400 lb in the first year to about 260 lb in the third year. The cattle used the first year (1959-60) were heifers whose average starting weight was 464 lb/animal. The average starting weights of the steers were 414 lb in 1960 and 409 lb in 1961. The heifers also started out as older animals than the steers did, and they stayed on the range two to three weeks longer. These are three of the reasons the ani- mals gained considerably more during the first year than in either of the other two years. The quality of the herbage for feed, discussed below, was an- other reason for better gains the first year.
At the beginning of each study year in June or July, the animals were grouped so the groups would differ only slightly in average weight. The range of weights in each group was also
kept as small as possible. Each group was then assigned to a unit. In 1959 the average starting weight of the heifers in the un- fertilized units was 462 lb; in the sulfur-fertilized units, 463 lb; and in the sulfur-plus-nitrogen- fertilized units, 467 lb. In 1960 the average starting weight of the steers was nearly 414 lb in each of the units. In 1961 the average starting weight of the steers was 410, 410, and 406 lb/- animal on the unfertilized, sul- fur-, and sulfur-plus-nitrogen- fertilized units, respectively.
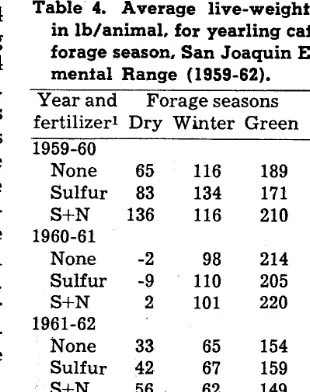
Table 4 shows the difference among animal weight gains. Much of the difference among dry-season units in each year is probably a response to the botanical composition (Table 2) and nutritive quality of the herbage rather than to total yield. As the relative amount of grass and clover increases and forbs other than clover decrease, the cattle weight gain in the dry season should increase. Data from this study seem to support this hypothesis. Except for clo- ver, forbs tend to become brittle and lose their leaves and seed in the first or second month of the dry season. During the same
Table 4. Average live-weighi gain, in lb/animal, for yearling caffle by forage season, San Joaquin Experi- mental Range (1959-62).
Year and Forage seasons fertilizer1 Dry Winter Green Total 1959-60
None 65 116 189 370
Sulfur 83 134 171 388
S+N 136 116 210 462
1960-61
None -2 98 214 310
Sulfur -9 110 205 306
S+N 2 101 220 .323
1961-62
None 33 65 154 252
Sulfur 42 67 159 268
S+N 56 62 149 267
Averages
None 32 , 93 186 311
Sulfur 39 104 178 321
S+N 65 93 193 351
1 S+N = Sulfur-plus-nitrogen fertil- izer.
period, grasses also become dry, lose much of their seed, and nutritive quality, but tend to stay pliable and keep their leaves. Clover seems to stay green later than either grasses or other forbs.
Live-weight gain per animal in 1959-60 was materially higher on the sulfur-plus-nitrogen-fer- tilized units than on the other units. The difference in gain on the dry-season units was greatest -more than 70 lb/animal higher than on the unfertilized units. The difference in gain on the green-season units is important, but may be misleading. The green season in each of the first two years was 25 days longer on the sulfur-plus-nitrogen- fertilized units than on the other units. The daily gain on the sulfur-plus-nitrogen-ferti- lized green-season units was actually lower than on the other units in 1960 and also in 1961. Otherwise the cattle performed equally well on all of the green- season units.
During the wintering period the cattle in this study gained considerably in total weight, but daily gain was below a pound. The first herd gained about 0.7 lb/day, the second 0.8 lb, and the third 0.4 lb/day. To maintain these winter gains, a cotton- seed meal-salt mixture was fed free choice each winter. Depend- ing on the weather and the amount of green forage avail- able, the amount of meal eaten varied. Generally the cattle ate from 1.1 to 1.6 lb/day per head.
Implications
We have placed major em- phasis on animal-days of grazing produced by the range units. Granted, there were some dif- ferences in average gain per year per animal among the units.
Live-weight gain was greatest on range units fertilized with sulfur-plus-nitrogen and was par- ticularly noticeable on the dry- season units. In one year, the cattle on such units gained more than 100 lb during the dry sea- son. Fertilizing range with sul- fur-plus-nitrogen cannot be jus- tified solely by this amount of gain for one out of three years. Apparently the cost of fertilizing with sulfur-plus-nitrogen for dry-season use must be justified by the need to provide for a source of additional or emergen- cy forage. An example of this kind of need occurred as a result of the 1958-59 drought. A fair- sized herd could have been main- tained by a relatively small amount of fertilized range. Fer- tilizing for dry-season use may have more advantages that are not yet apparent. The period covered here, only three years, is questionable as being repre- sentative - considering the weather. Also, these results ap- ply only where application of fertilizer is once every three years at the rate we used.
The greatest differences among fertilizer treatments occurred in the green-season units. Conse- quently the rest of this discus- sion will deal mainly with the green seasons. Even these differ- ences mostly affected grazing capacity rather than animal gain. There should be little difference in animal gain, provided an ade- quate amount of forage is avail- able at all times during the green season.
The seemingly obvious conclu- sion is that sulfur-plus-nitrogen fertilizer gives the best results because grazing capacity is high- est where this fertilizer is used. But the relationship between the cost of fertilizing and the amount
of additional grazing obtained may modify or even change the conclusion. Certainly some con- sideration of costs is needed to strengthen the usefulness of the information.
We do not intend to make an economic analysis of the data presented. But we can show how our costs may affect a fertilizer program. As stated earlier only two rates of fertilizer were ap- plied, 0 and 60 lb of sulfur or 60 lb of sulfur plus 80 lb of nitro- gen. The rates were based on the results of earlier work done at the San Joaquin Experimental Range (Green and Bentley, 1954; McKell et. al., 1960).
Recognizing these limitations, we used the information from the studies to evaluate the cost of grazing on these particular range treatments. The informa- tion, consisting of averages from the data presented earlier, was as
1,
2.
3.
follows:
Average length of the green season in days:
Unfertilized units ______ ___ _______ 96 Sulfur-fertilized units ____.___ 96 Sulfur-plus-nitrogen-fer-
tilized units . . . .._______.__..______ll3 Average grazing capacity of
the green-season units in days/acre:
Unfertilized units _...._...22.8 Sulfur-fertilized units . . . .._41.4 Sulfur-plus-nitrogen-fer-
tilized units ____ ______ ____ _____ ______ -55.5 Cost of the fertilizer program per acre/year including 6% interest charge discounted yearly:
Sulfur-fertilized units . . ..$l.lS Sulfur-plus-nitrogen-fer- tilized units ________ ____ ____ ___ _____ $4.72 The cost of the animals has been left out since the study was limited to the grazing problem. An additional set of costs, which we will call “range costs”, are missing: investments in range- land, equipment, upkeep, and improvements, plus labor, taxes, and interest on these invest- ments. The study and the anal- ysis of the data were not de-
signed to evaluate such costs, but our analysis did show that they may determine the kind of fer- tilizer program to be followed.
According to our data, if range costs were $5.86/acre/year, the cost of grazing per animal would be about equal ($21.54) for either a 96-day season on the sulfur- fertilized units or a 113-day sea- son on the sulfur-plus-nitrogen- fertilized units. At the same time, the costs on the unfertilized units would be much higher ($29.94). Range costs lower than $5.86 would tip the scales in favor of sulfur-fertilized range. Higher range costs would favor sulfur-plus-nitrogen.
Several factors account for the lower cost of grazing per animal with a particular kind of fertil- izer at a given evaluation of range costs. Probably the greatest con- tributing factor is the increased grazing capacity on the fertilized range units. A second factor is earlier range readiness on range units fertilized with sulfur-plus- nitrogen. As the cost of maintain- ing the livestock during the win- tering period goes up, early range readiness becomes increasingly more valuable. Finally, as the costs of a resource such as range- land and of labor increase, the relative cost of a fertilizer de- creases. Thus when land and labor are high enough, the cost per animal will be least on the nitrogen-plus-sulfur-fertilized units. At one extreme it could be more economical to buy or lease more land than to fertilize. At the other extreme, great expense for fertilizer may be justified to get the highest possible produc- tion per unit of resource.
Summary
26 CONRAD ET AL. study, begun in mid-1959, in-
cluded two years of severe drought and poor rainfall dis- tribution.
The greatest effect of using fertilizer was to increase grazing capacity. Little important differ- ence in daily gain was noted ex- cept in the first year of dry-sea- son grazing. The number of ani- mal-days of grazing in the dry season was increased by 45% on the sulfur-fertilized units, and by 141% on sulfur-plus-nitrogen- fertilized range units. On the same kind of range grazed in the green season, the increase was 82 “/o on sulfur-fertilized units and 145% on sulfur-plus-nitro- gen-fertilized units . Also the green season began an average of 17 days earlier on the sulfur- plus-nitrogen-fertilized range.
We considered the additional grazing capacity produced on
fertilized range a useful way of evaluating a fertilizer program. Even considering the longer green season and greater grazing capacity, the cost of grazing per animal for the sulfur-plus-nitro- gen-fertilized range was higher than for sulfur alone so long as the cost of the rangeland, equip- ment, labor, etc. was below $5.86 /acre/year. This includes con- sideration of the cost of main- taining the animal on winter range plus supplement during the 17 days when the green sea- son had started on the sulfur- plus-nitrogen-fertilized units.
LITERATURE CITED
BENTLEY, J. R., L. R. GREEN, AND K. A. WAGNON. 1958. Herbage pro- duction and grazing capacity on annual-plant range pastures fer- tilized with sulfur. J. Range Manage. 11: 133-140.
GREEN, L. R., .~ND J. R. BENTLEY. 1954. A report on some costs and re-
turns from applying sulfur fertil-
izers on rangeland. Northrup King, Westland Pasture J. 5(2):1.
GREEN, L. R., K. A. WAGNON, AND J. R. BENTLEY. 1958. Diet and graz-
ing habits of steers on foothill range fertilized with sulfur. J. Range Manage. 11: 221-227. MCKELL, CYRUS M., CHARLES A.
GRAHAM, AND ALMA M. WILSON. 1960. Benefits of fertilizing annual range in a dry year. U. S. Forest Serv., Pacific Southwest Forest and Range Exper. Sta. Res. Note 172, 9 p.
MARTIN, W. E. 1958. Sulfur defi- ciency w i d es p r e a d in California soils, Calif. Agr. 12 (11) : 10-12. REPPERT, JACK AND DON DUNCAN.
1960. Range annuals endure rec- ord fall drought. West. Livestock J., Oct’ober, p. 23.
WAGNON, K, A., J. R. BENTLEY, AND L. R. GREEN. 1958. Steer gains on annual-plant range pastures fer- tilized with sulfur. J. Range Manage. 11: 177-182.
WOOLFOLK, E. J., AND D. A. DUNCAN. 1962. Fertilizers increase range production. J. Range Manage, 15: 42-45,
Interval of Observation of Grazing Habits of Range
Beef Cows
A. B. NELSON,~ AND R. D. FURRY Associate Professor and Graduate Assistant, Department of Animal Science, Oklahoma State University, Stillwater.
Highlight
Reasonably accurafe esfimafes of acfivifies of longer duration, such as grazing and ruminating, can be obtained by observafions ai intervals of 15 or even 30 min. Observations af 15 min or longer intervals failed fo give reliable esfimafes of such aciivifies as walking, sleeping, nurs- ing calves, defecation, urination and drinking.
IPresent address: Professor of Ani- mal Science, New Mexico State University, University Park, New Mexico.
2 Present address: Livestock Special- ist, Agricultural Extension Service, University of Hawaii, Honolulu, Hawaii.
ous observation, but the procedure is laborious. A larger number of ani- It is important to know animal
mals may be observed with less la- bor by lengthening the interval be- tween observations. Hughes and grazing behavior in pasture experi-
Reid (1951)) Tayler (1953) and Harker et al. (1954) concluded that ments. A large quantity of accurate
observing activities of grazing cattle at 4-min intervals yielded satisfac- data may be obtained from continu-
tory results. Sheppard et al. (1957) recorded observations of grazing habits at 30-min to 1-hr intervals, but did not make any observa- tions at night. Hull et al. (1960) com- pared 15-, 30-, and 60-min observa- tion intervals with continuous obser- vation using four steers in 0.4 acre of irrigated pasture. Among those re- porting grazing habits of range beef cattle observed continuously are Dwyer (1961) and Wagnon (1963). This study reports the frequency of observations necessary for an ac- curate estimate of the activity of range beef cows in a 24-hr period.
cattle grazing in excellent condition native grass pastures approximately 100 acres in size, eight miles north-
Methods
west of Stillwater, Oklahoma. The dominant grass species were little and big bluestem’ (Andropogon sco-
Five 24-hr grazing behavior
parius and A. gerardi), indiangrass (Sorghastrum nutans) and switch- grass (Panicum virgatum). The to- studies (continuous observation)
pography was gently rolling with some small hills, however, none was were conducted with grade Hereford
steep enough to hinder the natural travel of the cows.
The number of cows observed per study varied from 7 to 11; in three of the studies the cows were suck- ling calves. The first study began on August 18, 1959, at 10 AM and ended