Volume 02 Issue 03 April 2015
Available online at http://internationaljournalofresearch.org P a g e | 65
A Framework for Evaluating Ict Use in Teacher Education in
Kenya (8817 Words)
Nickson Moseti Ongaki1 Faith Wavinya Musa2
Jomo Kenyatta University of Agriculture and Technology P.O Box 62013 Nairobi,
Kenya
E-mail: [email protected]
Abstract
Teachers are under increasing pressure to use Information and Communication Technology to impart to students the knowledge, skills, and attitudes their need to survive in the twenty first century. The teaching profession needs to migrate from a teacher-centred lecture based instruction to a student-centred interactive learning environments. To attain this aspiration, an ICT enabled teacher education is fundamental. Towards this end, International and national authorities have been spending huge sums of money to facilitate the implementation of ICT teacher education. In order to understand and appreciate ICT integration in teacher education, it is useful to evaluate how it is being used as a catalyst for change; change in teaching style, change in learning approaches and change in access to information.
This work attempts to evaluate the usage of the available ICT facilities in the Kenyan public primary teacher colleges focusing on the quantity of computer use, focus of computer use, and the levels attained in terms of using ICTs to support, expand, and
transform teaching and learning. Using the Computer Practice Framework (CPF), three questions are posed to guide the evaluation. What is the quantity of computer usage? What is the focus of use? And, what is the mode of use? Data collected from a sample of PTTCs through questionnaires and interviews are used to address the questions. The study shows that the quantity of computer use is still very low and that there is a wide rhetoric-reality gap. A bigger chunk of time spent on computers is used to learn ICT skills. Since the CPF, that is used to perform evaluation was developed for use in primary schools and did not take into consideration the capabilities availed by the Internet, the study proposes a more expanded evaluation framework that can be used to holistically evaluate ICTs in teacher education. This work contributes to the theory, practice and policy regarding ICT integration in education.
1. Introduction
Available online at http://internationaljournalofresearch.org P a g e | 66 has made pervasive impacts both on society
and on our daily lives (Yuen, Law, Wong, 2003). ICT has become a principal driver of economic and social change worldwide. As ICTs become ubiquitous and embedded in society, they offer the potential to restructure organizations, promote collaboration, increase democratic participation of citizens, improve the transparency and responsiveness of governmental agencies, make education and healthcare more widely available, foster cultural creativity, and enhance the social integration of individuals with different abilities and groups of different cultural backgrounds (Kozma, 2005a). Global and national policy makers have been putting effort into crafting policies to enable countries to cope with these demands and harness their effects to support economic growth. As Kozma (2005b) ascertains, policy makers worldwide concur on the fact that education is among the public sectors that most affects – and is most affected by – these developments. Further, the improvement of educational systems and increased educational attainment are seen as primary ways that countries can prepare for these global, technology based changes. And within education, ICT is seen as a way to promote educational change, improve the skills of learners, and prepare them for the global economy and the information society (Haddad & Draxler, 2002; UNESCO, 2002).
It is thus not surprising to find increasing interest, attention and investment being put into the use of ICT in education all over the
world (Yuen, Law, and Wong, 2003). The desire of countries’ to be globally competitive, grow economically and improve social conditions is often used to up the ante for increased investment in educational improvement and the application of ICT in learning institutions. At the global level, the Millennium Development Goals (MDGs) which have been adopted by the United Nations as the key development targets for the 21st Century, mentions achievement of basic education as one of the prominent goals. This goal builds on the Education For All (EFA) initiative which was hatched in Jomtien (Thailand) in 1990 and reaffirmed at a second EFA meeting in Dakar in 2000. In the Dakar meeting (UNESCO, 1990, 2000), item 69 explicitly states:
Information and communication technologies (ICT) must be harnessed to support EFA goals at an affordable cost. These technologies have great potential for knowledge dissemination, effective learning and the development of more efficient education services. This potential will not be realized unless the new technologies serve rather than drive the implementation of education strategies. To be effective especially in developing countries, ICTs should be combined with more traditional technologies such as books and radios, and be more extensively applied to the training of teachers.
Volume 02 Issue 03 April 2015
Available online at http://internationaljournalofresearch.org P a g e | 67 economic and social programs. In Kenya,
the first comprehensive and stakeholders-driven ICT policy was discussed and approved by the cabinet in January 2006 and an ICT policy document published through the Kenya Government Gazette notice No. 24 in March 2006 (KIC, 2006). The mission of this policy is a “Prosperous ICT-driven Kenyan society”, which puts ICT in the centre of national development (Kashorda, Waema, 2007). The policy, among other national policy areas, addresses issues of ICT in education in general. The policy aims at encouraging the use of ICT and promoting the growth and development of e-learning across all levels of education in a bid to leverage learning and teaching.
Drawing from the aspirations of the national ICT policy, the Ministry of Education, Science, and Technology through Sessional Paper No 5 of 2004 on a policy framework for education, training, and research whose vision is “quality education and training for development” targets to achieve Education for All (EFA) by 2015 (MOEST, 2005). The kernel of the policy is “to integrate ICT education and training into education and training systems in order to prepare learners and staff of today for the Kenyan economy of tomorrow and therefore enhance the nation’s ICT skills”. In 2006, the Ministry of Education crafted the “National Information and Communication Technology Strategy for Education and Training”, a sector-wide five-year ICT strategy document. The document was developed in line with the sessional paper
No. 1 of 2005, national ICT policy of 2006, Kenya Education Sector Support Program (KESSP) framework, Economic Recovery Strategy for Wealth Creation (ERS), e-Government strategy of 2004, and the Millennium Development Goals. The strategy contains details of the strategic objectives, expected outcomes and implementation log frames.
Available online at http://internationaljournalofresearch.org P a g e | 68
2. Teacher Education in Kenya
The development of teacher education in Kenya can be traced back to the middle of the 19th century when freed slaves were admitted to the Sharanpur Nasik in India to train as teachers amongst other courses in 1860 (Bogonko, 1993). These people returned to Kenya in the 1970s and became pioneers in promoting Christianity and education. Most of the teacher training in Kenya by the mid 1920s was on the job except high school which was said by the Phelps-Stokes Commission to be giving good teacher education (Bogonko, 1993). Missionaries dominated the training of teachers up to the eve of independence (Eshiwani, 1999) and virtually every missionary body had teacher training facilities at one or more of its central stations(Bogonko, 1993). By 1930s, the CMS trained their teachers at Kahuhia, Butere, and Kaloleni, Giriama; the CSM at Kikuyu and Tumutumu. The Roman Catholics trained their teachers at Kabaa and St. Mary’s Yala. Other centres of training were, Kamagambo(SDA), Kaimosi (Friends Church), Kima (Church of God Mission). By 1931 there were 15 teacher training institutions of which the missionaries managed 12 while the government managed 3 (Bogonko, 1993).
Despite all the efforts by the missionaries to train the teachers, their general standards were lamentably low (Bogonko,1993). To improve the standard of African education, the standards of teaching had to be raised. The Beecher report (1949) advocated the expansion and improvement of teacher
training facilities so as to improve the quality of teachers and as well as replace the untrained teachers with trained ones. In 1962, all the schools were integrated and a unified teaching profession created. The consolidation of the teaching process in the country has improved the qualification and quality of primary teachers. The certification of primary school teachers is divided in three levels: P1, P2 and P3. Currently about 75% of the students are admitted at P1 after passing O level examinations. All the three categories receive a pre-service training of two years. Currently there are 20 primary teacher training colleges in Kenya spread across all the provinces.
Due to the fact that teachers are multipliers and key agents in respect to educational change, continuing calls for raising standards of student learning and achievement have now focused national policies upon the quality of teachers and their teaching in classroom (Day, 1999). In Kenya, according to MOEST(2005), the government is committed to the improvement of primary teacher education to the standards of the latest international trends including equipping the institutions with ICT equipment. Currently, Kenya has 20 primary teacher training colleges all of which are equipped with computers.
3. ICT in Teacher Education
Volume 02 Issue 03 April 2015
Available online at http://internationaljournalofresearch.org P a g e | 69 Education, one of the man’s oldest social
activities, is slowly catching the wind of these new computer mediated technologies. These new technologies, coupled with a worldwide challenge to educate all children, has led to a global reform and development of teacher education (Moon, 2004). Given that teachers act as the change agents for technology in education (Zhao, Hueyshan & Mishra, 2001), it is essential that in-service and pre-service teachers have basic ICT skills and competencies (UNESCO, 2002). UNESCO (2000) emphasizes that teachers, professors and school administration staff must be given training that enable them to integrate ICTs into their teaching programs. It is therefore widely accepted that ICTs must be an essential component in teacher education. In fact, the question amongst the proponents of ICT use in education is no longer “if” but rather “which” and “how” these technologies can be effectively implemented. At the regional level, Nepad (2001) has articulated in its agenda that a functional education that integrates ICT into educational instruction and especially into the training of teachers should come into effect between 2006 and 2015. Many countries, Kenya included, are engaged in a number of efforts to effect changes in the teaching and learning processes to prepare students for information and technology based society (UNESCO, 2002). Towards this end, The National Information and Communication Technology Strategy for Education and Training (MOEST, 2006), recognizes that the integration of technology to support teaching and learning is necessary
Available online at http://internationaljournalofresearch.org P a g e | 70 The above issues are meant to stimulate
educators, administrators and other stakeholders to plan an evaluation component into the theoretically grounded adoption of new technologies in the classroom. While most researchers in the field would take cudgels with this position, Ehrmann (1995) cautions evaluators about making decisions solely based on the unit cost of a program, because this can be difficult to estimate. Evaluations of technology based on the principles of teaching and learning will surely bring us a step forward in understanding not only which technologies work best, but why. Kenya has placed considerable emphasis on the importance of ICT in its Education Sector Support Programme (KESSP) as evidenced in the promulgation of the National ICT Strategy for Education and Training. The Ministry of Education has taken steps to support the implementation of the strategy either by direct action or through the various institutions and agencies with which it works. In addition, there are many other organizations not involved directly with the Ministry of Education that continue to be active in implementing and supporting projects involving ICT in education.
4. Evaluation of ICT in Education
Literature suggests that there has been (and continues to be) substantial financial investment in computer use at all educational levels (e.g. Lemke & Coughlin, 1998; Twining & McCormick, 1999). The motivation for such investment is varied, but often justified in terms of the potential
impact that computer use has to enhance students’ learning (Twining, 2002). This situation, in which substantial amount of money are being invested in ICT in education but are not having substantial impact in schools is not sustainable. In order to justify continuity of investment, evidence needs to be found of ICT’s use effectiveness, and ways need to be found to increase the impact of those investments. There is, therefore great need to enhance the impact of investing in computer use in education at all levels (Twining, 2002).
Most discussions on educational evaluation refer to particular locales (for example, the classroom or the province) or particular purposes (for example, achievement or selection), and models of evaluation are similarly limited. A myriad methods and technologies have been in the past used to evaluate technology and learning. The argument has been that since learning environments and stakeholder interests are multi-faceted, it is impossible to use a single evaluation method. Owston (2000) states that one model or framework is unlikely to capture the complexity of the relationship between technology and learning, especially in a view of pedagogical, organizational, institutional and technical issues. To account for this complexity, evaluators and researchers have developed several evaluation frameworks.
5. Evaluation Frameworks
Volume 02 Issue 03 April 2015
Available online at http://internationaljournalofresearch.org P a g e | 71 follow the paradigm laid by Bloom (1970)
when he defined evaluation as a process of determining the achievement of specific educational objectives.
Among the many methods to the evaluation of technology and instruction in the literature, theorists (Jackson, 1990; Young, 2002) note six major ones: describing the universe, applying criteria, comparing institutions, improving programs, identifying outcomes, and justifying programs. Bullock and Ory ( 2001) also mention three other types of evaluations that appear less often in the literature: illuminative (Stake, 1978), participatory (Cousins & Earl, 1992), and integrative (Draper, Brown, Hederson, & McAteer, 1996). Illuminative evaluations use qualitative techniques to describe the impact of technology. Measuring the impact of technology is not the main concern. Rather, the goal of this type of evaluation is to uncover problems, issues or concerns. Participatory evaluations “involve a partnership between evaluation personnel and different evaluation audiences” (Bullock
& Ory 2000, P.318). Integrative evaluations are concerned with the goal of effectively integrating technology into a teaching and learning situation ( Bullock & Ory, 2000). z
5.1 The computer practice framework (CPF)
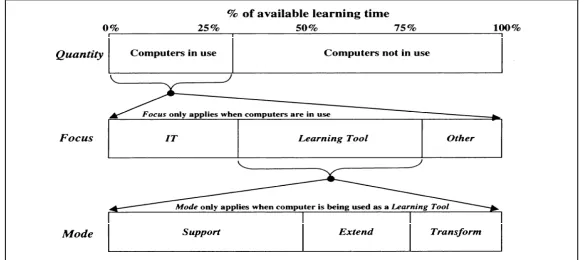
The CPF was researched by Peter twining of Open University and was published in 2002. The CPF has been chosen as a basis for this research because of its simplicity while at the same time presenting a rich picture. The CPF comprises of three core dimensions called the Quantity, Focus, and Mode. Quantity evaluates the quantity of computer use as a proportion of the available learning time. The focus dimension identifies the objectives supported by the computer use, while the mode is concerned with parameters that measure the impact of computer use on the curriculum (Twining, 2002).
Available online at http://internationaljournalofresearch.org P a g e | 72 5.2 Framework for ICTs in Teacher
Education
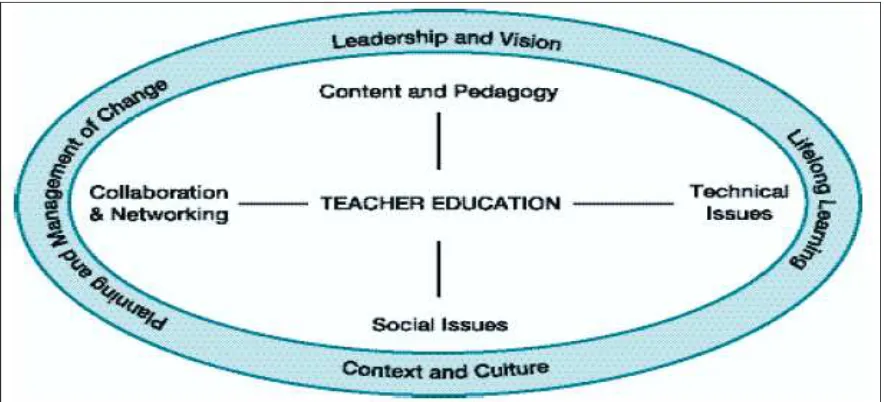
According to UNESCO (2002), ICT in teacher education can be organized around four competencies as follows:
1. Content and Pedagogy – focused on teachers’ instructional practices and knowledge of the curriculum.
2. Collaboration and networking – acknowledges communicative potential of ICTs to extend learning beyond the classroom.
3. Technical issues – teachers update their skills with software and hardware as new generations of technology emerge.
4. Social/Emerging Issues – competence to acknowledge that technology brings with it new rights and responsibilities.
Volume 02 Issue 03 April 2015
Available online at http://internationaljournalofresearch.org P a g e | 73
5.3 The Need for an Eclectic Model
While the description and trialing of CPF was based in the context of primary schools, Twining (2002) states that it can be applied in other educational contexts with minor modifications to the terminology used and exemplification provided. Twining, further notes that any conceptual framework inevitably has a value judgment about which aspects of practice are significant. It is on this backdrop that this research proposes a new eclectic model founded on the pillars of the CPF model relevant for evaluation of computer use in teacher education. InfoDev (the Information for Development Program) also observes in its report (infoDev, 2005) that no standard reference or methodology exists to evaluate ICT in education programmes including teacher education. This study proposes a triangulated approach by combining the CPF and the UNESCO’s framework for ICTs in teacher education.
6. Statement of the Problem
Since the integration of technology into education is an enormous endevour given the country’s poor state of technological infrastructure and manpower, there is, therefore, a need for a systematic evaluation of all the activities of ICT in education. Kashorda and Waema (2007) assert that one of the weaknesses of the Kenya’s national ICT policy is the lack of explicit targets that could be used for policy analysis and evaluation.
From the ICT in education policy paper (MOEST 2005b), it is clear that comprehensive indicators need to be developed to reflect the goals indicated in the ICT in education policy documents. The paper identifies the following as key areas for evaluation:
• Infrastructure and Access
• Training and Usage
• Impacts
This research is intended to come up with a hybrid model that can be used to evaluate the level of ICT use in education in general but with special reference to PTTCs.
7. Research Methodology
7.1 Conceptual framework
Available online at http://internationaljournalofresearch.org P a g e | 74
Figure 0: Research Conceptual Framework
7.2Study Population
This research was carried out in public Primary Teacher Training Colleges in Kenya. The PTTCs were chosen because they represent the basic teacher education institutions. The PTTCs also made a good research population for this study because of the government’s commitment in improving primary teacher education to make it more relevant to the needs of the country and in tandem with the latest international trends in teacher education (MOEST, 2005c).
Currently there are 20 public PTTCs in Kenya almost all of which have computer labs and are making bold efforts to establish and improve PTTC ICT capacity. The PTTCs enroll an average of 500 students annually for a two year course with 20 to 40 staff members. This leads to a population of 20,000 students and 800 teachers in all the PTTCs. Figure 3-2 below shows the distribution of teacher training colleges in Kenya.
Table 0-1:Primary Teacher Training Colleges in Kenya by Province
S.NO COLLEGE ADDRESS PROVINCE
1 ASUMBI BOX 119 KISII NYANZA
2 MOI BARINGO BOX 1, SERETUNIN RIFT VALLEY
3 BONDO BOX 424, BONDO NYANZA
4 EGOJI PRIV.BAG, EGOJI EASTERN
5 EREGI BOX100, MARAGOLI WESTERN
6 GARISSA BOX 496, GARISSA NORTH EASTERN
7 KAIMOSI BOX TIRIKI WESTERN
8 KAMWENJA BOX 152, NYERI CENTRAL
9 KERICHO BOX 10, KERICHO RIFT VALLEY
10 ST MARK’S KIGARI PRI.BAG, EMBU EASTERN
11 KILIMAMBOGO BOX 8, THIKA CENTRAL
Volume 02 Issue 03 April 2015
Available online at http://internationaljournalofresearch.org P a g e | 75
13 MERU BOX 46, MERU EASTERN
14 MIGORI BOX 123, SUNA NYANZA
15 MOSORIOT BOX 100, MOSORIOT RIFT VALLEY
16 MURANGA BOX 232, MAKUYU CENTRAL
17 NAROK BOX 709, NAROK RIFT VALLEY
18 SHANZU BOX 90533,MOMBASA COAST
19 TAMBACH PRIV.BAG, TAMBACH RIFT VALLEY
20 THOGOTO BOX KIKUYU CENTRAL
7.3Sample Population
A sample of 8 colleges was picked from the 20 colleges forming the research population. This was 40% of the total number of institutions. The five institutions were selected on the basis of being accessible
easily to the researcher. From each institution a sample of 10 teachers were chosen at randomly. The students were clustered into First and Second years from which a sample of 10 students was chosen at randomly from each cluster.
Table 0-2:The Sample percentages for Teaches
S.NO COLLEGE TOT TEACHERS SAMPLE SAMPLE %
1 THOGOTO 67 10 15
2 MACHAKOS 81 10 12
3 KILIMAMBOGO 78 10 13
4 KAMWENJA 0 0 0
5 MURANGA 67 10 15
6 KAIMOSI 69 10 14
7 NAROK 0 0 0
8 BONDO 53 10 19
TOTAL 415 60 14
Table 0-3:The Sample percentages for Students
S.NO COLLEGE STUDENTS SAMPLE SAMPLE %
1 THOGOTO 650 20 3
2 MACHAKOS 949 20 2
3 KILIMAMBOGO 1050 20 2
4 KAMWENJA 0 0 0
5 MURANGA 708 20 3
6 NAROK 0 0 0
7 BONDO 700 20 3
8 KAIMOSI 1100 20 2
Available online at http://internationaljournalofresearch.org P a g e | 76
7.4
Data Collection Methods
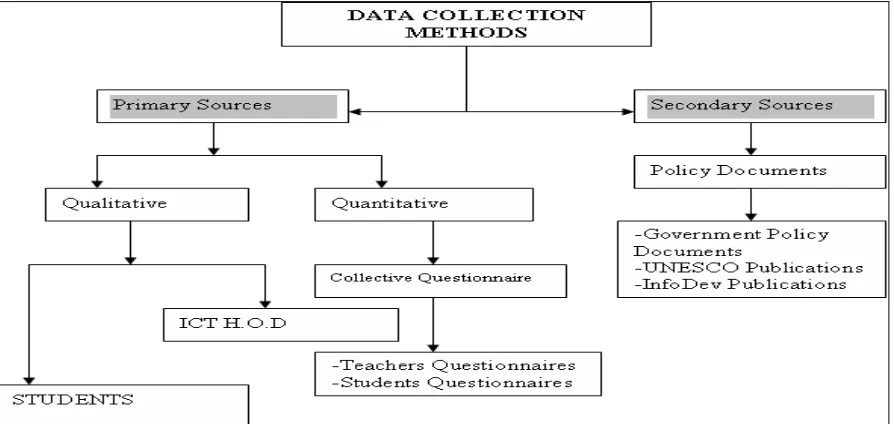
The two major approaches of data collection – qualitative and quantitative methods were used. On the side of quantitative, primary and secondary data sources were used. Secondary and primary data sources were used in this study. The secondary sources were used to collect data that already exist about public PTTCs in Kenya and their
status in ICT use. Since these PTTCs are government institutions, a lot of their operations are based on policies set by the government through the Ministry of Education, Science and Technology (MOEST). Another source of valuable information on education is the United Nations Education, Social, and Cultural Organization (UNESCO).
Figure 0-1:Data Collection Methods
Questionnaires
Questionnaires were chosen as the best instrument for this study because of a number of reasons:
• The public PTTCs are spread all over the country and therefore it was practically impossible to interview
the target respondents – teachers and students.
• It gives respondents anonymity, students and teachers would fill them truthfully thus improving reliability of the results.
Volume 02 Issue 03 April 2015
Available online at http://internationaljournalofresearch.org P a g e | 77 Different questionnaires were used for both
the teachers and students. While the majority of questions were different, a number of questions were similar for
validity and reliability reasons. The questionnaires consisted of both open ended and closed-ended questions.
Table 0-4:Teachers’ Questionnaire breakdown
Parts No. of Questions
Personal Details 3
Professional Details 3
ICT Use 7
Focus of ICT use 7
Competencies for Evaluation 4
TOTAL 24
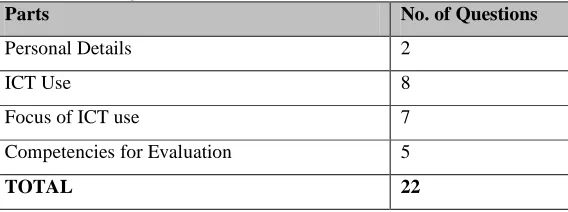
Table 0-5:Students’ Questionnaire breakdown
Parts No. of Questions
Personal Details 2
ICT Use 8
Focus of ICT use 7
Competencies for Evaluation 5
TOTAL 22
Interviews
Qualitative method was used in the form of both Focus Group Discussions (FGD) and In depth Interviews (IDI). The Focus Group Discussions were conducted with groups of 6 students in three colleges. The students were picked on the basis of those who were available on the day of the interview. These were mainly first year students as second year students were busy with their final national examinations.
Available online at http://internationaljournalofresearch.org P a g e | 78
Table 0-6:Teachers and Students Interviewed.
College In Depth Interviews Focus Group Discussion
Machakos ICT teacher
6 students Dean of Curriculum
H.O.D Creative Arts
Muranga ICT teacher
6 students B/Studies Teacher
Thogoto ICT teacher Non
Mathematics Teacher
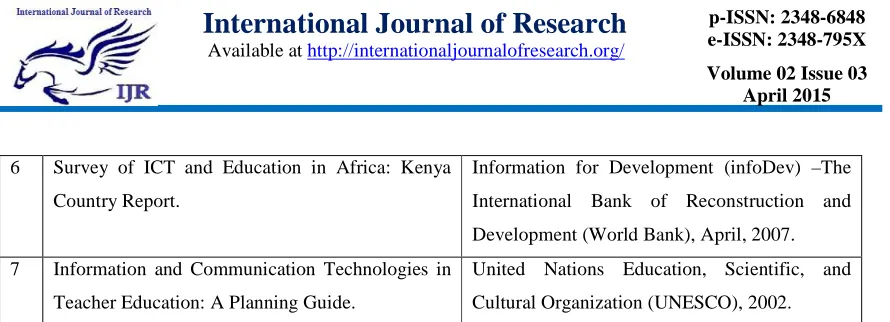
Secondary Sources
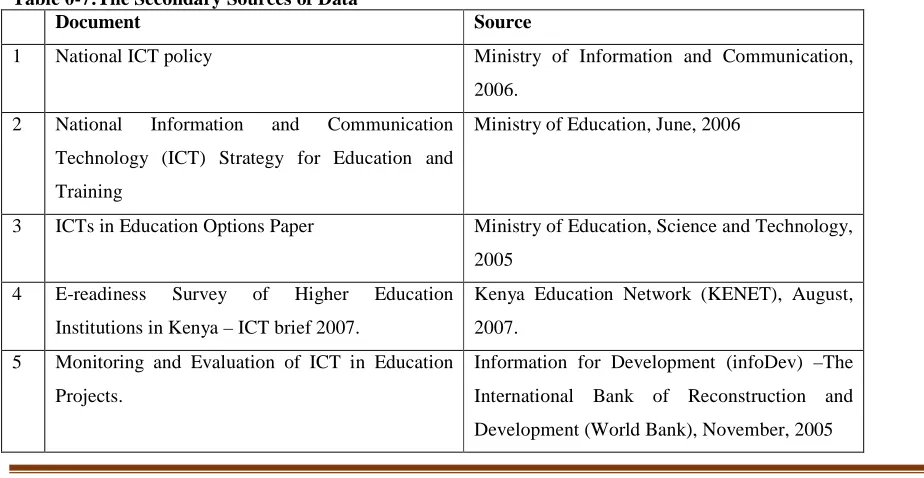
A good number of secondary sources were consulted during the data collection process. Many international bodies that deal with education produce periodical reports on the status of various aspects of education. Such bodies include but are not limited to the United Nations Education, Social and Cultural Organization (UNESCO), InfoDev which is a publication of World Bank and
New Partnership for African Development (NEPAD).
The government of Kenya through the Ministry of Education has also released several policy papers on education and more recently on the role of ICT in education. The particular policy papers that were consulted in this study are summarized in the Table 3-7.
Table 0-7:The Secondary Sources of Data
Document Source
1 National ICT policy Ministry of Information and Communication, 2006.
2 National Information and Communication Technology (ICT) Strategy for Education and Training
Ministry of Education, June, 2006
3 ICTs in Education Options Paper Ministry of Education, Science and Technology, 2005
4 E-readiness Survey of Higher Education Institutions in Kenya – ICT brief 2007.
Kenya Education Network (KENET), August, 2007.
5 Monitoring and Evaluation of ICT in Education Projects.
Volume 02 Issue 03 April 2015
Available online at http://internationaljournalofresearch.org P a g e | 79
6 Survey of ICT and Education in Africa: Kenya Country Report.
Information for Development (infoDev) –The International Bank of Reconstruction and Development (World Bank), April, 2007. 7 Information and Communication Technologies in
Teacher Education: A Planning Guide.
United Nations Education, Scientific, and Cultural Organization (UNESCO), 2002.
8. Research Findings
8.1Quantity of Computer Use
In establishing the quantity of computer use, teachers were asked to indicate the number of hours in which they have access to computers in a week. The following assumptions were made:
• Access to computers implies having a computer available for use regardless of the purpose of use.
• The computers could only be available for 8 hours a day for 5 days in a week – time during which teaching and learning takes place, resulting into a total of 40 hours per week.
• Quantity of computer use restricted to use within the institution. Any access to computers outside the institution is not factored in.
Quantity of Computer Use by Teachers
A total number of 40 teachers out of the 45 who returned their filled questionnaires responded by indicating the number of hours they use computers at their various institutions. The table below gives a summary of the response numbers. 5 teachers did not respond to the question.
Table 0-1: Quantity of Computer Use by Teachers.
COLLEGE CODE SAMPLED RESPONSE
200 8 8
201 6 6
202 7 7
204 9 8
205 5 5
206 10 6
TOTAL 45 40
Total Number of Hours Computers were Available= 40 x 8 x 5
Available online at http://internationaljournalofresearch.org P a g e | 80
Table 0-2:Summary of the Quantity of Computer Use by Teachers
Hours/Week Percentage
IN USE 346 21.63
NOT IN USE 1254 78.38
TOTAL 1600 100
The analysis of the data collected indicated that computer use by teachers was 22 % of
the total time computers were available for use as represented by Figure 4.1 below.
Comparison of Computer Use among the sampled PTTCs
Table 0-3:Comparison of Quantity of Computer Use by teachers in the sampled PTTCs College Code Hrs/Week Total
Hrs/Week
% IN USE % NOT IN
USE
No. Of
Teachers
C202 88 280 31 69 7
C200 87 320 27 73 8
C201 82 240 34 66 6
C204 19 320 6 94 8
C205 64 200 32 68 5
C206 6 240 3 78 6
TOTALS 346 1600 22 78 40
Quantity of Computer Use by Students
The analysis of the data collected indicated that computer use by students was a low 6 %
of the total time computers were available for use as represented by Figure 4.3 below.
Table 0-4:Summary of Quantity of Computer Use by Students
Hours % hours
IN USE 232 6
NOT IN USE 3888 94
Table 0-5:Comparison of Quantity of Computer Use by Students in the sampled PTTCs College Code Hrs/Week Total
Hrs/Week
% IN USE % NOT IN
USE
No. Of
Students
C202 35 640 5 95 16
C200 47 800 6 94 20
C201 48 800 6 94 20
C204 26 560 5 95 14
C205 40 720 6 94 18
C206 36 600 6 94 15
Volume 02 Issue 03 April 2015
Available online at http://internationaljournalofresearch.org P a g e | 81
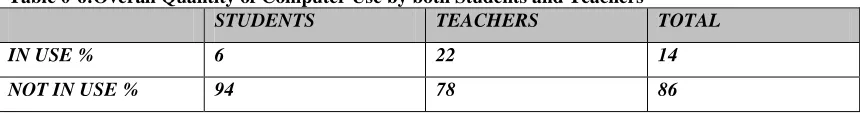
Quantity of Computer Use by Teachers and Students Combined
The overall computer use by both the students and teachers were as follows:
Table 0-6:Overall Quantity of Computer Use by both Students and Teachers
STUDENTS TEACHERS TOTAL
IN USE % 6 22 14
NOT IN USE % 94 78 86
8.2 Focus of Computer Use
This dimension of the CPF deals with the objectives underlying the computer use. It is divided into three categories. The focus dimension is divided into three different categories as follows:
1. IT – Using computers to help learners develop their IT skills. 2. Learning Tool – Using computers to
support aspects of learning other than IT skills.
3. Other – Using computers in ways not covered by IT or Learning Tool. Data for this section was collected by asking the respondents to grade on a scale of four (0-3) their use of computers for classroom teaching/learning, collaboration, and evaluation. The use was based on an estimate of the frequency of use.
Focus of Computer Use by Teachers
Table 0-7:Focus of Computer Use by teachers in the sampled PTTCs
SCORE/3 Pts % SCORE
Teaching/Learning 0.57 36.63
Collaboration 0.29 18.38
Evaluation 0.70 44.49
LEARNING/TEACHING TOOL 0.52 17.4
IT SKILLS & OTHER 2.48 82.6
The amount of use for IT skills & Other was derived from the results of Learning/Teaching tool. It was assumed that the time in which computers were used but not for Learning and Teaching purposes, it was being used for IT skills & Other. It was
Available online at http://internationaljournalofresearch.org P a g e | 82
Table 0-8:Summary of Focus of use by teachers in each of the sampled PTTCs
COLLEGE
TEACHING & LEARNING ICT SKILLS & OTHERS
C202 0.66 2.34
C200 0.57 2.43
C201 0.62 2.38
C204 0.46 2.54
C205 0.39 2.61
C206 0.49 2.51
AVERAGE TOTALS 0.53 2.47
% AVERAGE TOTALS 17.72 82.28
Focus of Computer Use by Students
Table 0-9:Summary of Focus of use by teachers in each of the sampled PTTCs
COLLEGE NO. OF
STUDENTS
TEACHING &
LEARNING
ICT SKILLS &
OTHERS
C202 16 0.3625 0.6375
C200 20 0.35 0.65
C201 20 0.18 0.82
C204 14 0.3786 0.6241
C205 18 0.4056 0.5944
C206 15 0.3625 0.6375
AVERAGE TOTALS 104 0.3398 0.6605
% AVERAGE TOTALS 100 33.46 66.54
Focus of Computer Use by Teachers and Students Combined
Table 0-10:Focus of Computer Use by Teachers and Students the sampled PTTCs
STUDENTS TEACHERS AVG. TOTAL
TEACHING &
LEARNING %
33.46 17.4 25.43
ICT SKILLS & OTHERS %
Volume 02 Issue 03 April 2015
Available online at http://internationaljournalofresearch.org P a g e | 83
8.3 The Mode Dimension
The mode dimension of the CPF is concerned with the impact that computer use has on the curriculum but excluding the IT curriculum. This includes both the content and the processes of the curriculum. The mode dimension is subdivided into three categories:
1. Support – Automating various aspects of the curriculum without changing the processes.
2. Extend – Using computers to enrich learning across the curriculum. 3. Transform – Using computers to
fundamentally change the teaching and learning processes.
This dimension was not measured directly due to the following complexities:
1. It was practically impossible for teachers to classify the mode of use since use of computers was not planned.
2. Teachers were not conversant with what comprises Support, Extension, or Transformation of teaching and learning focus of computer use. The results for this dimension were therefore derived on the basis of the following:
1. Judging by how computers were used for teaching and learning – as shown by figure 4.5 below, mainly for automation of results calculation, the study concluded that the mode is still at the support level.
Table 0-11:Use of Computers as a Teaching and Learning tool by teachers in each of the sampled PTTCs
COLLEGE CLASSROOM
TEACHING &
LEARNING
COLLABORATION EVALUATION AV. TOTAL
TEACHING &
LEARNING
C202 0.64 0.33 1.00 0.66
C200 0.56 0.46 0.69 0.57
C201 0.33 0.33 1.20 0.62
C204 0.69 0.19 0.50 0.46
C205 0.50 0.27 0.40 0.39
C206 0.59 0.22 0.67 0.49
AV TOT 0.55 0.30 0.74 0.53
Available online at http://internationaljournalofresearch.org P a g e | 84 2. The conclusion in (1) above was
further supported by the fact that the expertise levels of teachers in IT skills is still very low – being just able to perform basic computer operations and word processing
applications. The assumption is that for a teacher to be able to use computers to extend, or transform learning, (s)he must have very good or excellent IT skills.
Table 0-12:Summary of Teachers general level of expertise in the sampled PTTCs
Expertise Description Level Number Percentage
NON -Can not use computers at all L1 3 7
FAIR -Basic computer operations
and word processing
L2 30 68
GOOD -Able to use all office
applications for school related work.
L3 4 9
VERY GOOD -All the above skills plus use of Internet and its resources.
L4 6 14
EXCELLENT -All the above plus use of e-mail, Internet surfing and searching, development of web pages, participation in e-learning.
L5 1 2
TOTAL 44 100
Table 0-13:Summary of Students general level of expertise in the sampled PTTCs
Expertise Description Level Number Percentage
NON -Can not use computers at all L1 5 5
FAIR -Basic computer operations
and word processing
L2 55 54
GOOD -Able to use all office
applications for school related work.
L3 33 33
VERY GOOD -All the above skills plus use of Internet and its resources.
L4 7 7
EXCELLENT -All the above plus use of e-mail, Internet surfing and searching, development of web pages, participation in e-learning.
L5 1 1
Volume 02 Issue 03 April 2015
Available online at http://internationaljournalofresearch.org P a g e | 85
Table 0-14:Summary of general level of expertise for both students and Teachers in the sampled PTTCs
Expertise Description Level % Number Average
Percentage Teachers Students
NON -Can not use computers
at all
L1 7 5 6
FAIR -Basic computer
operations and word processing
L2 68 54 61
GOOD -Able to use all office applications for school related work.
L3 9 33 21
VERY GOOD -All the above skills plus use of Internet and its resources.
L4 14 7 10
EXCELLENT -All the above plus use of e-mail, Internet surfing and searching,
development of web pages, participation in e-learning.
L5 2 1 2
TOTAL 100 100 100
Summary of results
Available online at http://internationaljournalofresearch.org P a g e | 86
8.5 Inference
It is a well known fact that computer laboratories in educational institutions in Africa are underutilized (Unwin, 2004).The overall quantity of computer use by both teachers and students in the sampled schools stand at 14%. It is indicative to note that 5 out of 6 teachers who had access time of more than 10 hours a week (about 83% quantity of use) have computers in their offices. Since most institutions have just one computer lab for both teachers and students, most teachers find it difficult to access computers due to two main reasons. First, many teachers may be uncomfortably using computers side by side with students. Secondly, most of the times, computers are scheduled for students use but not teachers. Other indirect causes of low quantity of computer use were cited as:
1. Scarcity of time for both students and teachers
2. Inadequate computers. 3. Lack of basic ICT skills 4. Lack of appropriate software 5. Lack of Internet facilities
6. Some teachers indicated lack of technical support as contributing.
The PTTCs have an average of 69 teachers and 859 students each with an average of 45 computers. This gives a ration of 1:14( One computer to 14 people). A respondent (Respondent1) from college C201 said that
teachers who do not have computers in their offices hardly use computers and have a tendency of giving out their work to be done by computer teachers. Respondent3 in the same college said that teachers are mostly occupied with teaching and therefore have less time to use computers.
Recommendations
1. Increasing the quantity of computer hardware.
2. Provision of portable computers to reduce physical constraints.
3. Computers could be used in the evenings and at night by addressing the issues of security and staffing. 4. Kenya Institute of Education needs
to develop local digital curriculum content.
5. Need for ICT champions in every PTTC
6. In-Service of all PTTC college tutors in basic ICT skills.
Volume 02 Issue 03 April 2015
Available online at http://internationaljournalofresearch.org P a g e | 87
7 RECOMMENDED FRAMEWORK
7.3 General Framework for ICT Monitoring and Evaluation in Education
Figure 7-1:Conceptual Framework for ICT Monitoring and Evaluation (InfoDev, 2005)
This general conceptual framework takes into account all the broad development concerns including context-sensitive issues related to ICT use for educational development. The use of ICTs and ICT impact should be considered within this broad development context. Once this context is established, and the role of ICT is identified, then a plan for evaluation can be designed. While the framework identifies all the ICT interventions that need to be evaluated, this study is concerned with the teacher training component. The teacher
training component can has been divided into four key areas:
1. Equipment operation 2. Software use
3. Instruction 4. Interaction
Available online at http://internationaljournalofresearch.org P a g e | 88
Table 7-1:Comparison of terminologies used in the general framework for evaluating ICT in education and the Proposed framework for evaluating ICT in teacher education.
General Framework for ICT Monitoring and Evaluation in Education.
Proposed Framework for ICT Evaluation in Teacher Education
Equipment operation ICT Usage Skills
Software use
Instruction Content and Pedagogy
Interaction Collaboration and Networking
The proposed framework incorporates the social and health issues component to take of the increased need for teachers to address the challenges posed by adoption of technology in the society, locally and globally.
7.4 ICT in Teacher Education
According to UNESCO (2002), ICT in teacher education can be organized around four competencies as follows:
1. Content and Pedagogy – Focused on teachers’ instructional practices and knowledge of the curriculum.
2. Collaboration and networking – Acknowledges communicative potential of ICTs to extend learning beyond the classroom. 3. Technical issues – Teachers
update their skills with software and hardware as new generations of technology emerge.
Volume 02 Issue 03 April 2015
Available online at http://internationaljournalofresearch.org P a g e | 89 9 The Proposed Framework
Available online at http://internationaljournalofresearch.org P a g e | 90
9.1 The Proposed Competencies
Research done with teachers on the effectiveness of the CPF indicated that it was reliable for measuring quantity of computer use but the focus and mode dimensions were not reliable when applied to secondary descriptions of computer use (Twining, 2002). Several respondents commented that the difficulties encountered were due to lack of clear and detailed indicators. This lack of clear
indicators on which to measure the focus and mode dimensions made the research to measure those dimensions indirectly as explained in section 4.2 and 4.3. The new framework proposed some competencies on which indicators could be based. The teachers were asked through the questionnaire to rate them on a Likert scale consisting of Very necessary, Necessary, and Not Necessary. The following results were got from 21 teachers who answered the question.
Table 7-2:Ranking of the proposed competencies and indicators by teachers.
Code Number of Teachers
Very Necessary 3 11
Necessary 2 6
Not Necessary 1 4
TOTALS 21
The responses showed that 52% of the teachers considered the competencies and indicators proposed in the new framework were Very necessary, 29% as Necessary while 19% considered them Not necessary as shown by figure 5-3 below.
7.4.1 Development Context
Best practices in ICT integration into education points to the guiding principles recommended by international bodies. These best practices and guidelines can be adapted to meet the specific needs of every country. Bodies like UNESCO (2002), InfoDev (2005) and the Society for Information and Teacher Education SITE (2002) have recommended some guidelines to be followed when implementing ICT in teacher education. Summed up, indicators of good ICT uses in teacher education that are set up at the national level include:
1. ICT policy through which the government articulates her levels of support and commitment towards ICT implementation at institutional levels.
2. ICT infrastructure which enables connectivity to the Internet.
3. ICT curriculum to guide the application of ICT in education. These factors have a direct and indirect effect on computer use at the institutional levels.
9.3Computer Use
This defines the quantity of computer use as a proportion of the available learning time. Twinning (2002) provides a complete definition of the quantity of computer use as follows:
Volume 02 Issue 03 April 2015
Available online at http://internationaljournalofresearch.org P a g e | 91 computers are in use by students or
teachers.
2. The school day is taken to mean the time when students are in school and includes play times, lunch times, but not after-school clubs.
3. The number of students using a computer is irrelevant.
4. The number of computers in use is irrelevant.
In this new framework, the learning time includes all the eight hours students are in school. Given a tight schedule for lessons in PTTCs, students only make heavy use of computers during the breaks within the learning time.
Focus of Use
The focus of use explores what the computers are used for. The dimension deals with the objectives underlying the computer use (Twining, 2002). This dimension is subdivided into four parts in the proposed framework.
1. IT Skills – Using computers to help students acquire computer skills. This is mainly restricted to the understanding of computer hardware and software.
2. Learning Tool – Students using computers to support any aspect of their learning other than IT itself. Students applying IT in classroom activities and assignments (Auerswald & Magambo, n.d) 3. Teaching Tool – Focus is on how
teachers use computers to create better teaching and learning environments.
4. Other – The use of computers for other purposes that excludes IT skills, teaching, and learning. This includes objectives that do not relate directly to learning and teaching outcomes.
9.3ICT in Teacher Education Competencies
This section of the framework identifies categories of competencies that teachers and students should have in order to use ICT effectively. These competencies are in line with the SITE (2002) basic principles for development of effective ICT teacher education. These are:
1. Technology should be infused into the entire teacher education program. Students should learn about and with technology and how to incorporate it into their own teaching.
2. Technology should be introduced in context. Pre-service students should learn many uses of technology because they are integrated into their coursework and field experiences. Teacher educators, content specialists, and mentor teachers should expose the pre-service teachers to regular and pervasive modeling of technology and provide opportunities for them to teach with technology.
3. Students should experience innovative technology-supported learning environments in their teacher education programs.
Available online at http://internationaljournalofresearch.org P a g e | 92 1. Information and Communication
Technologies in Teacher Education : A planning guide (2002)
2. Department of Education and Science in England (1989)
3. Teacher Training Agency (2001) 4. Primary Teacher Education
Syllabus (K.I.E)
9.3.1 ICT Usage Skills
The term ICT Usage Skills is used here more broadly to include not only learning about computer software and hardware but also their application.
In the proposed framework, ICT usage skills support all the areas of technology use in teacher education. This approach is taken because technology should pervade the entire teacher education programme (SITE, 2000). Indicators for evaluation in ICT usage skills can be developed around the following two areas.
1. Demonstration of introductory knowledge, skills and understanding of concepts related to technology.
2. Demonstration of continual growth in technology, knowledge and skills to stay abreast of current and emerging technologies.
9.3.2 Content and Pedagogy
Content and Pedagogy can further be divided into three areas mainly to ease the development of indicators.
a) Planning and Designing Learning environments
Teachers should be able to plan and design learning platforms that are supported by technology that include:
1. Design appropriate learning opportunities that apply technology to support diverse needs of learners.
2. Apply current research on teaching and learning with technology when planning learning environments. 3. Identify and locate technology
resources and evaluate their potential value in classroom use and sustainability.
4. Plan for the management of the technology resources within the context of learning.
5. Plan strategies to manage student learning in technology enhanced context.
b) Teaching, Learning, and the curriculum.
Indicators in this area can be clustered around the following areas:
1. Use technology to support learner centred strategies that address diverse needs of students.
2. Apply technology to develop students’ higher order skills and creativity.
3. Manage student learning activities in a technology enhanced environment.
c) Assessment and Evaluation
This involves evaluating a teacher’s competence in applying technology to a variety of effective assessment and evaluation.
Volume 02 Issue 03 April 2015
Available online at http://internationaljournalofresearch.org P a g e | 93 2. Using technology resources to
collect data, interpret results, and communicate findings to improve instructional practice.
3. Determine students’ appropriate use of technology resources for learning, communication and productivity.
4. Evaluate the ways in which use of ICTs changes the nature of teaching and learning.
9.3.4 Collaboration and Networking
Teachers use technology to enhance their productivity and professional practice.
1. Use of technology to engage in on-going professional development and lifelong learning.
2. Using technology to share best practice and reduce bureaucracy. 3. Use technology to collaborate with
peers, parents and the larger community in order to nurture student learning.
9.3.5 Social and Emerging Issues
Teachers should understand the social, ethical, legal and human issues surrounding the use of Information and Communication Technologies in schools and apply that understanding in practice.
1. Model and teach legal and ethical practice related to technology use. 2. Apply technology resources to
enable and empower learners with
diverse backgrounds, characteristics and abilities.
3. Promotion of safe and healthy use of technology resources.
4. Facilitate equitable access to technology resources for all students and teachers.
9.4 Mode of Computer Use
The mode component of the proposed framework is concerned with the impact that computer use has on the curriculum. The curriculum includes:
1. The content (including but going beyond the explicit curriculum but then also excludes the ICT curriculum)
2. The processes involved in the delivery of the curriculum.
The mode of computer use is divided into three categories: Support, Extend and Transform. Table 5-3 summarizes the key distinctions between the three modes.
Suggested indicators for the various categories of the mode dimension are summarized in Table 5-4.
Table 7-3: Suggested Indicators of each aspect of Mode of Computer Use Mode Indicator area
Support 1. Using computers to support learning/teaching in other subject areas – Infusion (Anderson and Collins in (Harris, 1999))
Available online at http://internationaljournalofresearch.org P a g e | 94
3. Usage of Drill and Skill software (Clement et al, 1993 in (Harris,1999)) Extend 1. Use of problem solving software and tools to extend and enrich learning
(Clement et al, 1993 in (Harris,1999))
2. Promotion of learning/teaching communities - and seeing computers as 'mind-tools' that can make this possible (Cuban 1993).
3. Does it unlock new attitudes and behaviours, hopefully to be transferred to other learning situations (Hexel et al. 1998)?
Transform 1. Does technology transform knowledge itself (Clock, 2000)
2. Use of Hypermedia/Multimedia to alter what teachers and students can present and how we can represent it (Twining 2001).
3. Is technology "Transforming teaching and learning into an engaging and active process connected to real life" (Cuban 2001 p.14)?
10. CONCLUSIONS AND RECOMMENDATIONS
The study discovered that the quantity of computer use in PTTCs is 14% and it is mainly focused on the learning of ICT skills which takes 75 % of the time computers are used. The study concludes that the reality-rhetoric gap of the impact of ICTs in PTTCS is very big and needs to be bridged. The study recommends that the impact of ICT in PTTCs be evaluated from time to time to ensure that programme objectives are met. There is an urgent need
to conduct intensive in-training to all the teachers in the colleges. The curriculum developers should develop local content and make it available to all the training colleges. Several factors have been cited as responsible for low quantity of computer use in colleges. Some of these factors are: attitude towards new technologies, poor management, lack of local content, and shortage of equipment. A lot of research can still be done to establish to which extent these factors affect effective integration of ICTs in teacher education.
References
[1] Bloom, BS 1970, ‘Toward a theory of testing which includes measurement -evaluation – assessment’ in Wittrock, M. C. and Wiley, D. E. (eds), ‘The Evaluation of Instruction’, pp. 25-50. New York: Holt, Rinehart & Winston in J.C Clift, B.w. Imri. 1980, ‘The Design of Evaluation for Learning’
Higher Education, Vol. 9, No. 1, pp. 69-80.
[2] Bullock, C., & Ory, J 2000, ‘Evaluating instructional technology implementation in a higher education environment’ American Journal of Evaluation, Vol.21, No.3, pp.315-328.
[3] Cousins, JB., & Earl, L 1992, ‘The case for participatory evaluation’ Educational
Evaluation and Policy Analysis, Vol.4,
Volume 02 Issue 03 April 2015
Available online at http://internationaljournalofresearch.org P a g e | 95
[4] Draper, S., Brown, M., Henderson, F., & McAteer, E 1996, ‘Integrative evaluation: An emerging role for classroom studies of CAL’, Computers and Education, Vol.26, pp.1-3.
[5] Kahorda, M. & Waema T, ICT
strategy brief based on findings of e-readiness survey of higher education institutions in Kenya, Kenya Education Network, 2007
[6] Lemke, C. & Coughlin, EC 1998, Technology in American Schools: Seven
dimensions for gauging progress- A policy maker’s guide, Santa Monica, CA, Milken
Exchange on Education Technology.
[7] Ministry of Education 2006, National
Information and Communication
Technology(ICT) strategy for Education and Training, Government Printer, Nairobi.
[8] Ministry of Education, Science and Technology 2005, Sessional Paper No 5 of
2004 on a policy framework for education, training, and research, Government Printer,
Nairobi.
[9] Ministry Of Education, Science and Technology 2005, Kenya Education Sector
Support Programme: 2005-2010: Delivering Quality Equitable Education and Training to All Kenyans, 9 May 2005 Draft.
[10] Owston, RD 1999, Strategies for
evaluating Web-based learning. Invited address given to the SIG/Text, Technology, and Learning Strategies at the annual meeting of the American Educational Research Association, Montreal, April 1999.
[11] Owston, RD. 2000, A meta-evaluation
of six case studies of Web-based learning.
Paper presented at the annual meeting of the
American Educational Research Association, New Orleans, 2000.
[12] Stake, RE 1978, Program evaluation,
particularly responsive. Kalamazoo: Western
Michigan University.
[13] Teacher Training Agency 2001, The
use of ICT in subject teaching – Expected outcomes of the New opportunities Fund ICT training initiative for teachers in England, Wales and Nothern Ireland. Teacher Training
Agency: London, viewed 15 February 2002. http://www.webct.com
[14] Twining P 2002, Conceptualizing
Computer Use in Education: introducing the
Computer Use Framework, British
Educational Research Journal, Vol. 28, No.
[15] Twining, P 2001, E211 Learning
Matters: Challenges of the Information Age - Software Guide, Milton Keynes: The Open
University.
[16] Unwin, T 2004, ‘Towards a framework for the use of ICT in Teacher Training in Africa’, The Journal of Open and
Distance Education, Special Issue on Open