Testing Of Simulink/ Stateflow Model States Using Unified
Dependency Graph
1
Surya Prakash Sonwani, 2Keshav Tiwari, 3Pinkeshwar Mishra,
1
M.Tech., Dept. of CSE,
Swami Vivekanand College of Science and Technology Bhopal, Madhya Pradesh–462044,India
2
Asst. Prof., Dept. of CSE,
Swami Vivekanand College of Science and Technology Bhopal,Madhya Pradesh-462044,India
3
HOD., Dept. of CSE,
Swami Vivekanand College of Science and Technology Bhopal, Madhya Pradesh–462044,India
Abstract— The Simulink/Stateflow (SL/SF) executing from Mathworks is fitting the accepted routine in industry for model based improvement particularly for installed control frameworks. A few exchange instruments are accessible in the business for experiment era from SL/SF outlines; however, we have watched that these devices don't fulfill acceptable scope in situations when plans include non-direct squares and Stateflow pieces come to pass more profound inside the Simulink pieces. For this reason, we have set up a strategy that creates the test groupings and experiments from the Simulink/Stateflow model. In our methodology, firstly, we have added to a SL/SF model utilizing MATLAB device which produces mdl(model description language) document. Next, we change over that mdl record into xml document and afterward next xml document and mdl record way went as an info to our proposed procedure to produce Simulink/Stateflow Dependency graph(SSDG), Now utilizing SSDG we need to create test sequences by applying Depth First Search approaches(DFS). Next, with these outcomes we will analysis the states of Simulink and stateflow model with the help of unified dependent graph.
Keyword—SL/SF model; SSDG; test sequence; test cases; prioritization.
I. INTRODUCTION
MATLAB is a high-performance language for technical computing. It integrates computation, visualization, and programming in an easy-to-use environment where problems and solutions are expressed in familiar mathematical notation.
Matlab Simulink/Stateflow(SL/SF) demonstrate now turns into an inborn parts of numerous applications for implanted framework. Matlab SL/SF is utilized particularly for creating installed frameworks for unpredictable and composite frameworks.
SL/SF Model aides in demonstrating frameworks, regardless of the possibility that they are more intricate contains huge number of blocks. The subsequent model must be tried and approved with a specific end goal to recognize error and abandons in the framework. In any case, such model comprises of an extensive number of squares in the frameworks, because of which testing procedure gets to be hard to test.
Programming testing is the procedure of discovering bugs or absconds in the product by executing a project. Programming Testing can likewise be seen as the procedure of confirming and accepting the product items or application or system that meets the prerequisites of the product and outline of the product, functions as the desire of the product. Testing goes for screening that the deliberate and genuine practices of a framework differ, or at picking up confidence that they don't. The objective of testing is disappointment identification: perceptible differences between the practices of execution and what is expected on the premise of the specification.
Simulink: The Simulink library gives an energetic graphical limit with a custom arrangement of block libraries that are valuable in configuration, reproduction, execution, test scope, confirmation and acceptance of model based testing especially for inserted framework.
Stateflow: A Stateflow model serves to portray the framework conduct utilizing the few employments of graphical and non-graphical develop. Graphical develop incorporates states block, transition, and intersection and capacity components. Non-Graphical build incorporates an occasion identifier, condition and condition activities, capacity calls, and so forth.
Figure 1 is a specimen illustration of Stateflow model. Occasions and conditions cause the state to be transformed starting with one state then onto the next, i.e. from dormant to dynamic status. There are distinctive sorts of activity that the conditions of the Simulink/Stateflow support. These are:
ISSN 2348 – 7968
Fig.1. An example of State flow model.
During Actions: It characterizes what move is making spot when the state is as of now dynamic, i.e. these activities are to execute at whatever point a specific state is now dynamic and some occasion other than the predetermined condition stuff or way out state of move happens.
Exit section: It characterizes what move is to be made spot when states get to be dynamic to idle.
On Event Actions: It characterizes what move makes place when state is dynamic and specific specified occasion to be happening. In this model Simulink utilized as an interface for the Stateflow model.
II. PROPOSEDWORK
Our proposed work is based on the graph called Simulink/Stateflow Dependency Graph (SSDG), in which nodes delineate the blocks of the SL/SF model and edges delineate to the conditions between blocks. The overall algorithm of our work is as:
A)Overall Algorithm of our approach
Step1: Draw Simulink Model by utilizing MATLAB, Simulink tool and Stateflow model is added to the Simulink framework by utilizing the MATLAB Stateflow configuration apparatus. (It creates.mdl file)
Step 2: Produce XML file for Simulink Model for the overhead .mdl file.
Step 3: Read the Blocks of model (in Java using.mdl file path as input) and using an xml parser (xml file as an input), generate an adjacency matrix that contains a dependency amongst the blocks of SL/SF model and amass on dotty file.
Step 4: Using dotty file generated in Step3, generate an intermediate graph called Simulink/Stateflow Dependency graph (SSDG) using GraphViz tool. Step 5: Analysis of the intermediate unified dependent graph
by applying th
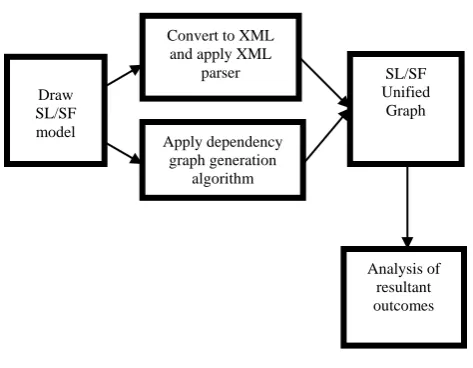
Figure 2 demonstrates our proposed procedure and orderly system for producing experiments and analysis using Dependency graph. Firstly, we need to make SL/ SF models utilizing Matlab, Simulink library tool, save it to .mdl document. Next we need to change over that .mdl record into xml document. Presently utilizing our proposed calculation dependency_Graph_Generation that takes .mdl record and xml document as information and produces SSDG utilizing the GraphViz device (that takes a dotty document as a data). Next, apply diverse testing scope criteria like state scope and transition scope to produce and analysis by applying Depth first search approaches (DFS).
Fig. 2. Proposed Methodology
B) Algorithm: Unified_Dependency_Graph_Generation Input: Xml file and mdl file path of SL/SF model. Output: Dependency graph
Start main
//First, create an SL / SF models using Matlab SL/SF design Tools and save it. (It creates .mdl file)
Take .mdl file path and xml file as an input and generate model object and passed it to the function graphGeneration.
For all up to all block present in the SL / SF model do
• Read each block
• Obtain all the neighbor next block of present block
• Write the next block in the matrix form and store that into dot file.
• If any present block contains Simulink/Stateflow subsystem then
Push that block into the queue. End if
End for
For all up to all block present in the queue, i.e. queue is not empty do
• Read each block
Draw SL/SF model
Convert to XML and apply XML
parser
Apply dependency graph generation
algorithm
SL/SF Unified
Graph
• Obtain all the neighbor next block of present block
• Write the next block in the matrix form and store that into dot file.
End for
Now using GraphViz Tool, take above dot file generated in the above step as in input to the tool.
Generate unified Graph using this tool. This Graph is Called SL/SF unified dependency Graph.
End main
III. IMPLEMENTATIONANDRESULT
In this area we have taken an illustration of contextual investigation electric device for producing experiments, test arrangements from a Simulink/ Stateflow model for electric device. So how about we examine our execution of contextual analysis orderly:
A) Construction of Simulink/Stateflow model:
Utilizing Matlab Tool and Simulink library, we first need to create Simulink/Stateflow demonstrate by drag and drop from the configuration board of Simulink library. Since in the Simulink library Stateflow configuration board is available, which further contains blocks, states, transition, and so forth are available for creating Stateflow model and running any one either Stateflow model or Simulink model, naturally both runs all the while that is motivation behind why produced model is known as a Simulink/Stateflow model. Its file extension is .mdl ((model description language).
Fig.3. Simulink/Stateflow Model for electric device Example.
Fig. 3 demonstrates the Simulink/Stateflow model for the contextual analysis of electric device. Signal Builder is utilized as a part of model for producing the signal for electric device case study,we have utilized Chart that speaks to the state outline for electric device model which further be subsystem into states and transitions.One scope block is utilized toward the end for showing the outcome.
One state chart block that further separated into subsystem that can be seen as distinctive conditions of the framework. This state diagram is available inside the Simulink configuration panel, so this contains both Simulink and Stateflow that is a reason we called Simulink Stateflow model. Running both of them will run both at the same time. One scope block toward the end is utilized for showing the consequence of the simulation.
Fig. 4 illustrate the state diagram for the electric device, which actualizes the outline in a Simulink model. It represent the diverse conditions of the framework makes a go at throughout its execution. It contains principally two states named "on" state and "off" state. Since each state diagram model contains the default move that shows from where execution begins. Here default move is "off" state. "On" state is further isolated into four sub states named as "one", "two", "three" and "four " states. It contains one variable name speed, which is utilized as a part of controlling between diverse states.
Off state: It is a default state which contains the section area in which speed is situated to 0. Whenever, if state "one" discovered the condition [off] to be true, then control goes to "Off" state.
On state: When "Off" state discovers the condition [speed==1] then move control goes into the "On" state which further contains four sub states in which express "one" is default move.
One state: Once "On" state is dynamic, control goes to express "one" on the grounds that the default move of "On" state will be express "one" furthermore when state "two" discovered the condition [speed==1] to be true, then control goes to the state "one". It contains entry section in which speed is situated to 1.
Fig. 4. State chart model for electric device
ISSN 2348 – 7968 [speed==2] to be true, then control goes to express "two". It
contains entry section in which speed is set to 2.
Three state: Once the state "two" discovered the condition [speed==3] is to be fulfilled, then controls goes to state "three" furthermore when state "four" discovered the condition [speed==3] to be true, then control goes to state "three". It contains section segment in which speed is set to 3.
Four state: Once the state "three" discovered the condition [speed==4] is to be fulfilled, then controls goes to state "four".It contains entry section in which speed is set to 4.
Fig. 5. Matlab process to convert .mdl to .xml
B) Convert to XML:
After developing the SL/SF model in Matlab. It generates .mdl file. Then we convert it into XML file. fig 5 show that using MATLAB command prompt with the help of predefined syntax coverting process of ‘.mdl’ to ‘.xml’.
Fig. 6 shows the converted xml file of electric device case study.
Fig. 6. Xml file of electric device model
C) Generation of Unified Simulink Dependency Graph:
Next step is to apply our proposed calculation of dependency graph approach that will takes .xml file and .mdl record as an information and gives dependent unified graph as a result.
This calculation takes .mdl document as a data. In the wake of making dependent model for the Simulink and stateflow model and passes .mdl record as the input value and graph_Generation approach and apply xml parser which takes
a .xml document as a data to xml parser. Next we need to apply loop up to all blocks covers in the model and inside of this loop, then we have to apply these following operations:
read every block and expand the abstract data of every state block, then acquire all the following neighbor states of block from the present state block, then Write the following state block in the form of matrix with help of adjacency matrix properties and then store that into dotty file. In the event if any present state block contains SimuLink/StateFlow subsystem, then push that state block into the process queue for operation. Subsequent to finishing of first loop, we need to check whether the process queue is vacant or not, if process queue is not void, then again apply one loop up to state block accessible in the process queue or until process queue gets to be discharge and perform the accompanying activities:
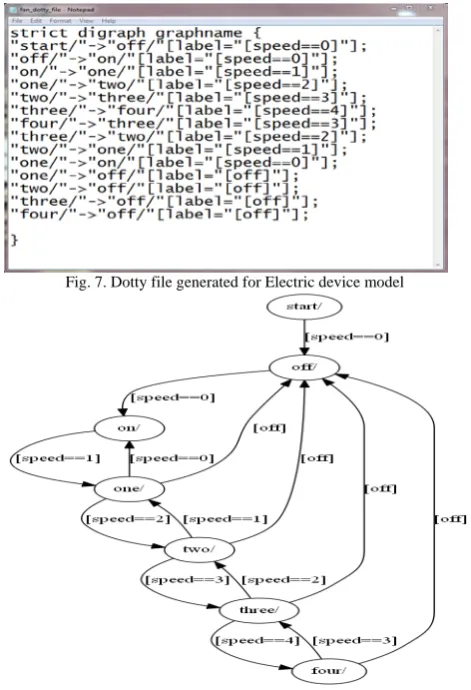
Fig. 8. SL/SF Unified Dependency Graph for Electric device
Read every state block and expand the data of every state block, then get all the following neighbor square of present state block, then compose the following state block in the matrix form and store that into dotty document format. Fig. 7 illustrate about the dotty document that store state block dependency, which is further used to create the dependent unified graph. GraphViz software tool is utilized to produce unified dependent graph utilizing produced dotty record. Fig. 8 illustrate about the SimuLink/StateFlow unified dependent graph for electric device model.
IV. COMPARISON WITH RELATED WORK
A wide range of methodologies are there identified concerned to our work.One methodology is T-Vec [2] analyzer that conveys a complete methodology for test era for Simulink model that offers a comprehensive methodologies for consistent model examination, test execution and programmed test generation. It bores the way limits for creating test vector for way all throughout the model hierarchy .Inaccessible ways that outcome in dead code are recognized and hyperlinked to the Simulink model components included. It is in light of the supposition that if there is no unintentional accuracy, then experiments that farthest point the limits of areas with subjectively high exactitude are satisfactory to test all the focuses in the area. Even then there is one drawback is that it doesn't consider the Stateflow of the Simulink.
Zhan and Clark[3] proposed a system called following and finding, that upgraded the ability of hunt based test information engender for Simulink.
Detriment of Zhan and Clark approach: They don't consider a state issue. The state issue remains a test for more elevated level and in addition code level test information era. Programmed era of test information for more elevated level models all the more for the most part is an extremely difficult challenge (execution, lessens as multifaceted nature of model increments).
Nayak [4] proposed a procedure Meta model for Simulink/Stateflow called as the Simulink Dependency Graph (SDG). The Simulink Dependency Graph catches every single verifiable dependencies between distinctive block of the SL/SF model and that show to them unequivocally, in this way making it conceivable to perform various number of examination on the SL/ SF model.
MirkoConard [5] et al proposed a methodology that outlines a test suite for code generation tools. They portray the configuration of a test suite for code generation tools. This technique gives arrangements of distinctive issues of diverse sorts of instruments that gives how the right change of a source dialect/model into an objective dialect can be demonstrated.The utilization of the proposed testing methodology prompts generation of sets of test suite, which is suitable for testing code generators efficiently.
In any case, the current code generators can't promise that the naturally created code from apparatus, accumulates effectively as specified in the configuration because of the accompanying reasons:
1. Slips in the Simulink/Stateflow chart hubs will get continued.
2. Slips in the programmed code generator for the Simulink/Stateflow chart brought on for instance by limited accuracy number juggling or timing requirements.
3. Any human blunders in the determination of code generation choices, library naming or consideration, and others.
However, our methodology defeats these constraints, no compelling reason to create code from the models in our methodology in light of that it beat the MrkoConard's methodology. We additionally cover all the blocks and all moves through the produced unified dependent graph so that our proposed approach over originated from these impediments. The Zhan's methodology additionally not covering all the Blocks because of little flag generation, however our methodology defeats this impediment too.
V. CONCLUSION
We proposed a procedure to create experiments from SL/SF models. In the first place, we develop the model working symbolic chart in the MATLAB environment by utilizing Simulink/Stateflow planning instrument and predefined tool. By simulation, we confirm the model. After confirmation by utilizing our methodology we created a unified dependent graph with the help of that we can analysis each and every states.This methodology covers much vital scope like state scope, move scope. This is more exact than the strategies which are creating experiments utilizing code generation.
This approach covers much important coverage like state coverage, transition coverage.
References
[1] The MathWorks, Mathworks MATLAB Simulink. "http://www.mathworks.com/products/simulink.
[2] T-vec," Website. http://www.t-vec.com/
[3] Y. Zhan and Clark, A search-based framework for automatic test-set generation for Matlabsimulink models," Software Eng. SE-10, vol. PhD thesis, December 2005. University of York.
[4] SurajNayak. "A Metamodel for Simulink/Stateflow models and its applications", M. Tech. Thesis, IIT Kharagpur, Computer Science Department (2013).
[5] I. Sturmer and M. Conrad, "Test suite design for code generation tools," in Automated Software Engineering, 2003. Proceedings.18th IEEE International Conference on, pp. 286-290, IEEE, 2003.
[6] N. Vamshi Vijay, "Regression test selection based on analysis of Simulink/Stateflow models", M.Tech. Thesis, IIT Kharagpur, Computer Science Department (2012).
[7] A. Windisch, "A Search based testing of Simulink models containing stateflow diagrams,"IEEE Trans., vol. Software Engineering Companion Volume, pp. 395-398, 2009. Daimler Center for Automotive IT Innovations DCAITI, Tech. Univ. Berlin, Berlin, Germany.
[8] R. Systems, "Reactis simulator / tester." Website. http:www.reactive-systems.com.
ISSN 2348 – 7968 [10] Bates, Samuel, and Horwitz, Susan. "Incremental program testing using
program dependence graphs", In Proceedings of the 20th ACM SIGPLAN SIGACT symposium on Principles of programming languages, (1993), pp. 384-396.
[11] R. Alur, A. Kanade, S. Ramesh and K.C. Shashidhar, “Symbolic analysis for improving simulation coverage of Simulink/Stateflow models”. Proceedings of the 8th ACM international conference on Embedded software P. 89-98, 2008.
[12] R. P. Pargas, M. J. Harrold, and R. R. Peck. Test-data generation using genetic algorithms. Journal of Software Testing,Verification and Reliability, 9(4):263–282, 1999.