Comparative Study on Fuzzy Logic Based Mixed Noise
Filter for Colour Images
P
1
P
M.Syed Mohamed Ibrahim, P 2
P
S.Abdul Saleem,
1M.phil scholar, 2Assistant professor,
P
1,2
P
PG & Research Dept.of comp.science,
Jamal Mohamed college(Autonomous) Trichirapalli-620 020,
ABSTRACT
The objective of this project is to denoise the color images. This project denoises the images which are only affected by the Gaussian, Impulse and mixed Gaussian-impulse noise. In this project a new filter is used to remove the noise. This filter uses the fuzzy peer group concept to remove the noise. The fuzzy peer group extends the peer group concept in the fuzzy setting. A fuzzy peer group will be defined as a fuzzy set that takes a peer group as support set. The fuzzy peer group of each image pixel will be determined by means of a novel fuzzy logic-based procedure. The fuzzy peer group concept is used to design a two-step color image filter. Cascading a fuzzy rule-based filter which is designed to remove the impulsive noise. Fuzzy average filtering is designed to remove the Gaussian noise. The performance of this filter is compared to the fuzzy logic based adaptive filter noise filter. Peak-Signal-to-Noise-Ratio, Mean Square Error and Root Mean Square Error metric are used to measure the performance of the denoising filter
1. INTRODUCTION
A technique in which the data from an image are digitized and various mathematical operations are applied to the data, generally with a digital computer, in order to create an enhanced image that is more useful or pleasing to a human observer, or to perform some of the
entertainment industries. The concept of an image has expanded to include three-dimensional data sets (volume images), and even four-dimensional volume-time data sets. An example of the latter is a volume image of a beating heart, obtainable with x-ray computed tomography (CT). CT, PET, single-photon emission computed tomography (SPECT), MRI, ultrasound, SAR, co focal microscopy, scanning tunneling microscopy, atomic force microscopy, and other modalities have been developed to provide digitized images directly. Digital images are widely available from the Internet, CD-ROMs, and inexpensive charge-coupled-device (CCD) cameras, scanners, and frame grabbers. Software for manipulating images is also widely available. Image enhancement improves the quality (clarity) of images for human viewing. Removing blurring and noise, increasing contrast, and revealing details are examples of enhancement operations. For example, an image might be taken of an endothelial cell, which might be of low contrast and somewhat blurred. Reducing the noise and blurring and increasing the contrast range could enhance the image. The original image might have areas of very high and very low intensity, which mask details. An adaptive enhancement algorithm reveals these details. Adaptive algorithms adjust their operation based on the image information (pixels) being processed. In this case the mean intensity, contrast, and sharpness (amount of blur removal) could be adjusted based on the pixel intensity statistics in various areas of the image. An image is enhanced when it is modified so that the information it contains is more clearly evident, but enhancement can also include making the image more visually appealing. An example is noise smoothing. To smooth a noisy image, median filtering can be applied with a 3 × 3 pixel window. This means that the value of every pixel in the noisy image is recorded, along with the values of its nearest eight neighbors. These
nine numbers are then ordered according to size, and the median is selected as the value for the pixel in the new image. As the 3 × 3 window is moved one pixel at a time across the noisy image, the filtered image is formed.
Denoising is the one of the pre processing technique in digital image processing. Digital images are often corrupted by noise during their acquisition and transmission. Noise is also introduced in digital images when scanning damaged surfaces of the originals. The noise in the digital image is removed by the denoising technique. It is the first step of the most image processing techniques. Several denoising methods are available. It gives confusion for select the best filters. To avoid the confusion this project compares the three techniques and gives the final best filters. This is the motivation of this project. The objective of this project is to denoise the color images. There are several types of noises are occurred. But this project denoises the images which are only affected by the Gaussian, Impulse and mixed Gaussian-impulse noise. Several filters are used to reduce the noises. This project investigates three denoising methods. They are Adaptive Bilateral Filter (ABF), Fuzzy Peer Group Filter and Switching Bilateral Filter. The performance of the above three filters are compared by using three performance metrics. They are Peak-Signal-to-Noise-Ratio, Mean Square Error and Root Mean Square Error.
not retain the frequency selective properties of the linear filters and do not suppress Gaussian noise optimally [42]. Hybrid schemes combining both rank order filtering and linear filtering have been proposed in order to take advantage of both approaches [43], [25]. These nonlinear rank order approaches in general improve the edge sharpness, but they are more complex to implement than a spatial linear filter. In more recent years, a new concept in edge-preserving de-noising was proposed by Smith and Brady [40] and Tomasi and Manduchi [45]. Although their algorithms were developed independently, and named the “SUSAN” filter and the “bilateral filter,” respectively, the essential idea is the same: enforcing both geometric closeness in the spatial domain and gray value similarity in the range in the de-noising operation. The idea of bilateral filtering has since found its way into many applications not only in the area of image de-noising, but also computer graphics [9], [10], video processing [11], [12], image interpolation [13], illumination estimation [14], as well as relighting and texture manipulation, dynamic range compression, and several others pointed out in [15]. Several researchers have provided a theoretical analysis of the bilateral filter and connected it with the classical approaches to noise removal. Elad [16] demonstrated that the bilateral filter emerges from the well-known Bayesian approach [17], [18], when a novel penalty function is used. Based on this observation, he proposed methods to speed up the bilateral filtering and to implement a bilateral filter for piece-wise linear signals. In [14], Elad also pointed out that the bilateral filter is a discrete version of the short-time effective kernel of the Beltrami flow discussed in [19] and [20]. Barash and Comaniciu [21], [22] demonstrated that the nature of the bilateral filter resembles that of anisotropic diffusion [34], [6], and outlined a common framework for bilateral filtering, nonlinear diffusion, adaptive smoothing [38], and a
been recently introduced. These filters may be classified into the following categories: switching filters, filters using weighting coefficients, fuzzy filters, and neuro-fuzzy filters. However, many of these techniques select the appropriate noise-free output from the input samples, and, therefore, they are not useful to remove Gaussian noise because in such a case there are no noise-free samples. According to the above, the filter design is a challenging task for mixed Gaussian-impulse noise removal. A possible solution is to apply two consecutive filters to remove first impulse noise and then Gaussian noise, or vice versa. However, the application of two filters could dramatically decrease the computational efficiency of the method which implies that this solution could not be practical for real applications. Therefore, it is more interesting to devise specific filters to remove mixed noise. To date, a few methods in the literature are able to approach this problem efficiently. The Peer Group Averaging (PGA) technique presented in [9]–[22] removes mixed noise by combining a statistical method for impulse noise detection and replacement with an averaging operation to smooth out Gaussian noise.
2 .Methodology:
In this the modules of the existing system and the proposed system are described briefly.
2.1 Existing System
2.1.1 Modules
Choose Original Image
Apply Noise
Apply Median Filter
Apply Fuzzy Logic Median Filter of 3x2
Apply Fuzzy Logic Median Filter of 4x2
Apply Histogram
Fig 2.1 Block Diagram of Noise Detection & Reduction Process
2.1.2 Modules Description
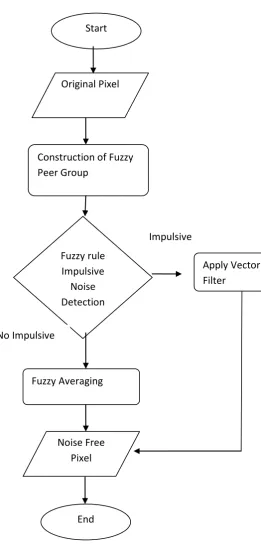
Choose Original Image Original Pixel
Construction of Fuzzy Peer Group
Fuzzy rule Impulsive
Noise Detection
Fuzzy Averaging
Noise Free Pixel
Start
End No Impulsive
Impulsive
o In choosing the original image, the gray scale image read by the MATLAB software.
Apply Noise
In order to test the performance rate of this proposed algorithm experiments are Performed at different noise levels ranging from 5% to 40% on two types of images.
Apply Median Filter
In this step 3x3 matrix scanning fuzzy logic based median filtering. The neighbouring pixels are ranked according to brightness (intensity) and the median value becomes the new value for the central pixel. Median filters can do an excellent job of rejecting certain types of noise, in particular, “shot” or impulse noise in which some individual pixels have extreme values. In this filtering operation, the pixel values in the neighbourhood window are ranked according to intensity and the middle value (the median) become the output value for the pixel under evaluation. so the process is apply to the 3x3 matrix scanning fuzzy logic based median filter to the noisy gray scale image. It removes the noise from the previously generated noisy image.
Apply Fuzzy Logic Median Filter of 3x2
In the step 4 3x2 matrix scanning fuzzy logic based median filter to the noisy gray scale image. Process is same as in the previous step but in the previous 3x3 scan matrix has some disadvantage that it remove the noise from the centre of the image but some kind of noise is remain on the edges of the image. So to remove the noise from the edges of image 3x2 matrix scanning is used.
Apply Fuzzy Logic Median Filter of 4x2
Again to improve the image quality 4x2 matrix scanning fuzzy logic based median filter is used and create the histogram also. Histogram is creating to show the
remaining noise in the image. Same process is repeated again for the 4x4 matrix scanning for the removal of noise by using fuzzy based median filter.
Apply Histogram
Remaining noise is removed from the image by creating histogram of the image.
2.2 Proposed System
2.2.1 Modules
Choose Original Image Apply Noise
Apply Fuzzy Peer Group
Noise Reduction based on Fuzzy Peer group
Fig 2.2 Block Diagram of Fuzzy Peer Group Construction
2.2.2 Modules Description
Choose Original Image
In choosing the original image, the gray scale image read by the MATLAB software.
Apply Noise
n order to test the performance rate of this proposed algorithm experiments are performed at mixed noise levels ranging from 5% to 40% on two types of images.
Apply Fuzzy Peer Group
In fuzzy peer group the similarity between each of the pixel in the input image is calculated and the member of the pixel is taken based on the fuzzy similarity and the neighbors of the input pixels. Apply the below steps for processing all pixels in the input image. Get the input pixels. Find the neighbors of the input pixel. Find the fuzzy similarity for the input pixel. Find the Best Member of that pixel based on the fuzzy similarity
Noise Reduction based on Fuzzy Peer group
In noise reduction based on fuzzy group, the noises are gradually reduced by the fuzzy peer group members which is created in the previous step. To do this, the pixel members are taken and the following the fuzzy rule is applied on the input pixels which is as follows.
1.Apply the Fuzzy Rule 1 on the Best members of the input pixels
2.If the rule 1 is satisfied that pixel is considered as the salt & pepper noise pixel
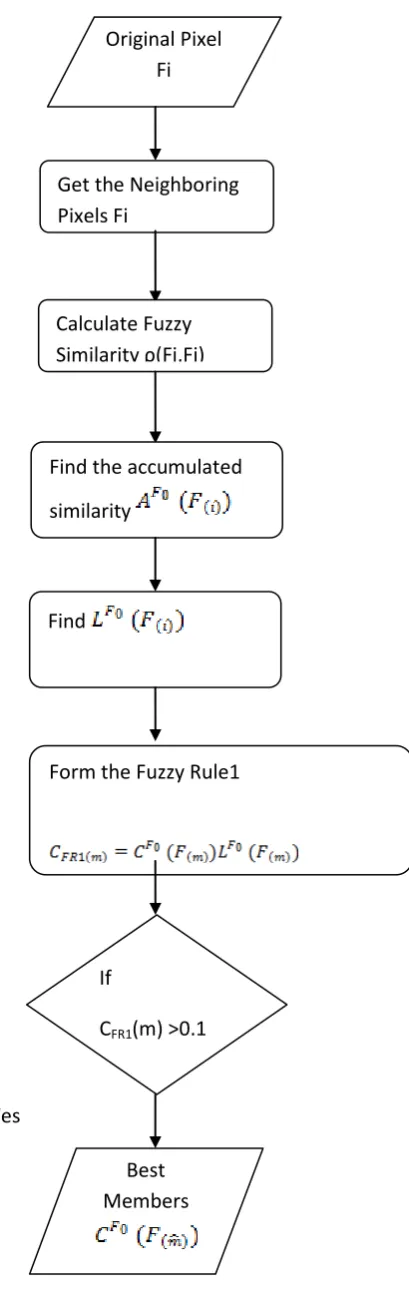
Original Pixel Fi
Get the Neighboring Pixels Fj
Calculate Fuzzy Similarity ρ(Fi,Fj)
Find the accumulated similarity
Find
Form the Fuzzy Rule1
If
CFR1(m) >0.1
Yes
3.Then apply vector median filter on the pixel
4.Otherwise it is considered as the Gaussian pixel
5.Then apply the smoothing procedure for remove the Gaussian pixel
6.Repeat the above steps for all input pixels
7.Finally we get the noise free image
Apply Histogram
Remaining noise is removed from the image by creating histogram of the image.
3.COMPARATIVE STUDY
In comparative study, both the existing and the proposed work are combined to study the difference between them. For this, the existing and the proposed work are experimented by various images and it is evaluated by using various performance metrics which is as follows.
3.1 EXPERIMENTAL ANALYSIS
In experimental analysis the existing system and the proposed system are experimented with various standard input images.
3.1.1 EXISTING SYSTEM
In order to evaluate the working of the existing of the system, it is processed with various input images and the results are shown.
3.1.1.1 Experimental Images
The standard input images given are shown below.
(a) (b)
(c) (d)
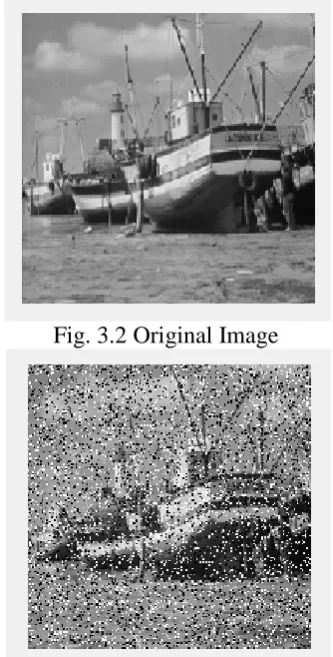
Fig. 3.1 Various Input Images (a) Boat (b) Cameraman (c) Lena (d) Peppers
3.1.1.2 Experimental Results
The existing system is implemented using MATLAB program where it is evaluated for denoising the noised image.
Fig. 3.2 Original Image
Fig. 3.4 Median Filtered Applied Image
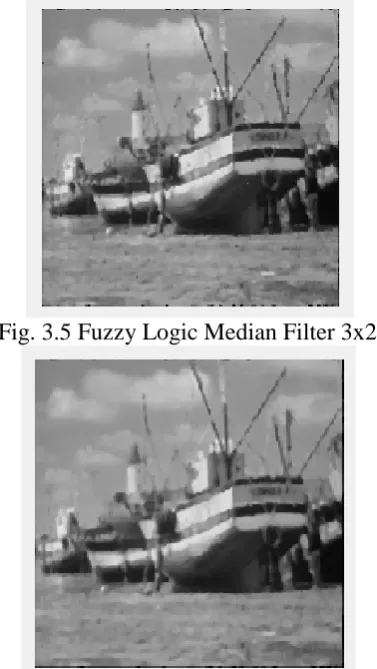
Fig. 3.5 Fuzzy Logic Median Filter 3x2
Fig. 3.6 Fuzzy Logic Median Filter 4x2
Fig. 3.7 Histogram of Denoised Image 3.1.2 PROPOSED SYSTEM
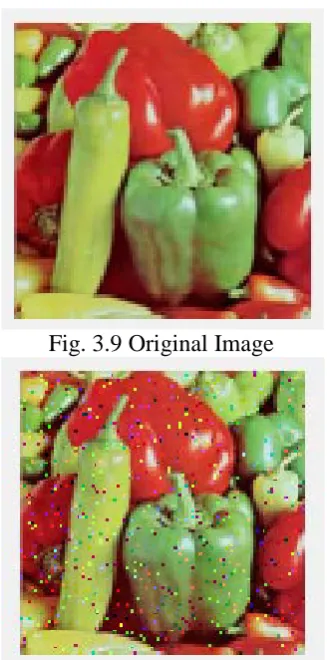
The proposed method uses the concept of fuzzy peer group for a colour image pixel which extends the concept of peer group in the fuzzy setting. This concept aims to represent the set of all pixel neighbours to a given pixel which are similar to it. Since the similarity between colour pixels is an imprecise concept, this method has represented it using fuzzy similarities. Thus, fuzzy peer groups are built as fuzzy sets where the membership degree of the neighbour pixels depends on their fuzzy similarity with respect to the pixel under processing. In order to evaluate the working of the proposed the system, it is processed with various input images and the results are shown.
3.1.2.1 Experimental Images
The standard input images given are shown below.
(c)
(d)
Fig. 3.8 Various Colour Input Images (a) Boat (b) Cameraman (c) Lena (d) Peppers
3.1.2.2 Experimental Results
The existing system is implemented using MATLAB program where it is evaluated for denoising the noised image.
Fig. 3.9 Original Image
Fig. 3.10 Noise Applied Image
Fig. 3.11 Apply Noise Reduction based on Fuzzy Peer Group
Fig. 3.12 Histogram of Denoised Image
3.2 PERFORMANCE METRICS
There are various performance metrics available to evaluate the performance of the project. In our project, we use the peak signal to noise ratio (PSNR), mean squared error rate (MSE) and root mean squared error rate (RMSE). The performance formulas are shown below.
3.2.1 Peak Signal-to-Noise Ratio (PSNR)
The peak signal-to-noise ratio (PSNR) is used to evaluate the quality between the denoised image and the original image. The PSNR formula is defined as follows:
𝑃𝑆𝑁𝑅
= 10 𝑋𝑙𝑜𝑔10 1 255 𝑋 255
𝐻𝑋𝑊 ∑𝐻−1𝑥=0∑𝑊−1𝒴=0[𝑓(𝑥,𝒴)− 𝑔(𝑥,𝒴)]2 𝑑𝐵
coordinate (x,y) of the original image and denoised image, respectively.
3.2.2 Mean Squared Error Rate (MSE)
The mean square error or MSE of an estimator is one of many ways to quantify the difference between an estimator and the true value of the quantity being estimated. As a loss function, MSE is called squared error loss.
𝑀𝑆𝐸= 1𝑛 �(𝑌� −𝚤 𝑌𝑖)2
𝑛
𝑖=1
Where 𝑌�𝚤 is the vector of n predictions and
𝑌𝑖 is the vector of true values.
3.2.3 Root Mean Squared Error Rate (MSE)
The RMSE is frequently used to measure the difference between values predicted by a model or an estimator and the values actually observed. It the square root of the mean squared root error value.
𝑅𝑀𝑆𝐸= �1
𝑛 �(𝑌� −𝚤 𝑌𝑖)2
𝑛
𝑖=1
Where 𝑌�𝚤 is the vector of n predictions and
𝑌𝑖 is the vector of true values.
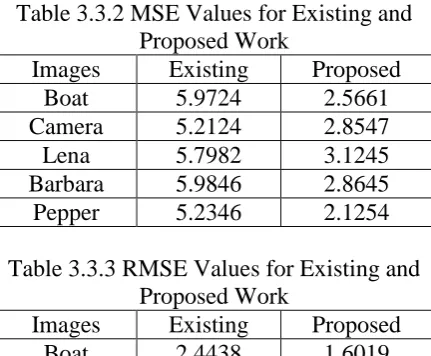
3.3 PERFORMANCE EVALUATION In order to evaluate the performance metrics, it is plotted in the table to identify the values of the proposed system. The tables are shown below.
Table 3.3.1 PSNR Values for Existing and Proposed Work
Images Existing Proposed
Boat 32.6078 35.2014
Camera 33.7908 34.2513
Lena 32.8650 34.5261
Barbara 33.2874 35.2614
Pepper 32.8547 34.5216
Table 3.3.2 MSE Values for Existing and Proposed Work
Images Existing Proposed
Boat 5.9724 2.5661
Camera 5.2124 2.8547
Lena 5.7982 3.1245
Barbara 5.9846 2.8645
Pepper 5.2346 2.1254
Table 3.3.3 RMSE Values for Existing and Proposed Work
Images Existing Proposed
Boat 2.4438 1.6019
Camera 2.2831 1.6896
Lena 2.4079 1.7676
Barbara 2.4463 1.6925
Pepper 2.2879 1.4579
To evaluate the performance metrics of the proposed system in an efficient way, it is plotted in the graph, in which it shows the difference in a graphical way. The graphs are shown below.
Table 3.13 PSNR Values for Existing and Proposed Work
Table 3.14 MSE Values for Existing and Proposed Work
30 32 34 36
PS
N
R V
al
ues
Various Images
Existing Proposed
0 5 10
M
SE
V
al
ue
s
Various Images
Table 3.15 RMSE Values for Existing and Proposed Work
4.CONCLUSION
In this work, the removing of the noise is done by using the median filters in the existing work and with fuzzy peer group in the proposed work. To denoise the image from the noisy image, first the Gaussian noise is applied on the image and then it is denoised using the two techniques. In existing the median filter is applied by changing the filter size with various techniques. The noise removed by the median filter is not good enough. In proposed work, the fuzzy peer group is used. It extends the peer group concept in fuzzy setting. By this, the mixed noise is filtered. The noise removed by the fuzzy peer group is better than the existing work. In existing work, only the grayscale images are denoised. But in proposed work, the colour images also can be used. From the experimental results and comparative study, the proposed work shows better results.
5. FUTURE ENHANCEMENT
In future, this system can be used to remove noise in video. In this, we used vector methods to remove the noises, in future this technique can be enhanced by latest methods. The peek signal to noise ratio will be improved in the future.
REFERENCES
[1] Abreu, E., Lighstone, M., Mitra, S. K. And Arakawa, K.,“A new efficient approach for the removal of impulse noise from highly corrupted images,” IEEE Trans. Image Process., vol. 5, no. 6, pp. 1012–1025, Jun. 1996.
[2] Arce, G. R. And Foster, R. E. “Detail-preserving ranked-order based
filters for image processing,” IEEE Trans. Acoust., Speech, Signal Process., vol. 37, no. 1, pp. 83–98, Jan. 1989.
[3] Astola, J., Haavisto, P. And Neuvo,Y. “Vector median filters,” Proc. IEEE, vol. 78, no. 4, pp. 678– 689, Apr. 1990.
[4] Barash, D., “A fundamental relationship between bilateral filtering, adaptive smoothing, and the nonlinear diffusion equation,” IEEE Trans. Pattern Anal. Mach. Intell, vol. 24, no. 6, pp. 844–847, Jun. 2002.
[5] Barash, D. And Comaniciu, D. “A common framework for nonlinear diffusion, adaptive smoothing, bilateral filtering and mean shift,” Image Vis. Comput., vol. 22, no. 1, pp. 73–81, 2004.
[6] Black, M. J., Sapiro, G., Marimont, D. H. And Heeger, D. “Robust anisotropic diffusion,” IEEE Trans. Image Process., vol. 7, no. 3, pp. 421– 432, Mar. 1998.
[7] Celebi, M. E., Kingravi, H. A. And Aslandogan, Y. A. “Nonlinear vector filtering for impulsive noise removal from color images,” J. Electron. Imag., vol. 16, no. 3, Jul.–Sep. 2007, paper number 033008.
[8] Comaniciu, D. And Meer, P. “Mean shift: a robust approach towards feature space,” IEEE Trans. Pattern Anal. Mach. Intell., vol. 24, no. 5, pp. 603–619, May 2002.
[9] Deng, Y., Kenney, C., Moore, M. S. And Manjunath, B. S. “Peer group filtering and perceptutal color image quantization,” in Proc. IEEE Int. Symp. Circuits Systems, 1999, vol. 4, pp. 21–24.
[10] Elad, M., “On the origin of bilateral filter and ways to improve it,”
0.0000 2.0000 4.0000
RM
SE
V
al
ues
Various Images
IEEE Trans. Image Process., vol. 11, no. 10, pp. 1141–1151, Oct. 2002.
[11] Elad, M. “On the origin of the bilateral filter and the ways to improve it,” IEEE Trans. Image Process., vol. 11, no. 10, pp. 1141–1151, Oct. 2002.
[12] Elad, M. “Retinex by two bilateral filters,” in Proc. 5P
th
P
Int. Conf. Scale Space, 2005, pp. 217–229.
[13] Eng, H. L. And Ma, K. K., “Noise adaptive soft-switching median filter,” IEEE Trans. Image Process., vol. 10, no. 2, pp. 242–251, Feb. 2001.
[14] Fleishman, S., Drori, I. And Cohen-Or, D. “Bilateral mesh denoising,” ACM Trans. Graph., vol. 22, no. 3, pp. 950–953, 2003.
[15] Gabbouj, M., Coyle, E. J. And Gallagher, N. C. “An overview of median and stack filtering,” Circuits Syst. Signal Process., vol. 11, no. 1, pp. 7–45, 1992.
[16] Garnett, R., Huegerich, T., Chui, C., and He, W., “A universal noise removal algorithm with an impulse detector,” IEEE Trans. Image Process., vol. 14, no. 11, pp. 1747–1754, Nov. 2005.
[17] Hewer, G., Kenney,C., Peterson, L. And Van Nevel, A. “Applied partial differential variational techniques,” in Proc. Int. Conf. Image Processing, 1997, vol. 3, pp. 372–375.
[18] Ho, J. Y. F. “Peer region determination based impulsive noise detection,” in Proc. Int. Conf. Acoustics, Speech and Signal Processing, 2003, vol. 3, pp. 713–716.
[19] Jain, A. K. Fundamentals of Digital Image Processing . Englewood Cliffs, NJ: Prentice-Hall, 1989.
[20] Jones, T. R., Durand, F. And Desbrun, M. “Non-iterative, feature-preserving mesh smoothing,” ACM Trans. Graph., vol. 22, no. 3, pp. 943– 949, 2003.
[21] Karakos, D. G. And Trahanias, P. E., “Generalized multichannel image-filtering structure,” IEEE Trans. Image Process., vol. 6, no. 7, pp. 1038–1045, Jul. 1997.
[22] Kenney, C., Deng, Y., Manjunath, B. S. And Hewer, G. “Peer group image enhancement,” IEEE Trans. Image Process., vol. 10, no. 2, pp. 326–334, Feb. 2001.
[23] Kim S. And Hong, K. “Composite video artifact removal by nonlinear bilateral filtering,” in Proc. SPIE Int. Soc. Opt. Eng., 2005, vol. 5960, pp. 306–315.
[24] Lagendijk, R. And Biemond, J. Iterative Identification and Restoration of Images . Norwell, MA: Kluwer, 1991.
[25] Lee, Y. H. And Kassam, S. A. “Generalized median filtering and related nonlinear filtering techniques,” IEEE Trans. Acoust., Speech, Signal Process., vol. ASSP-33, no. 3, pp. 672–683, Jun. 1985
[26] Longbotham, H. G. And Bovik, A. C. “Theory of order statistic filters and their relationship to linear fir filters,” IEEE Trans. Acoust., Speech, Signal Process., vol. 37, no. 2, pp. 275–287, Feb. 1989.
[27] Lucchese, L. And Mitra, S. K. “A new class of chromatic filters for color image processing: Theory and applications,” IEEE Trans. Image Process., vol. 13, no. 4, pp. 534–548, Apr. 2004.
and enhancement solutions,” in Advances in Imaging and Electron Physics, P. W. Hawkes, Ed. New York: Elsevier, 2006, vol. 140, pp. 187–264.
[29] Lukac, R., Smolka, B., Martin, K., Plataniotis, K. N. And Venetsanopoulos, A. N. “Vector filtering for color imaging,” IEEE Signal Process. Mag., vol. 22, no. 1, pp. 74–86, Jan. 2005.
[30] Morillas, S., Gregori, V., and Sapena, A. “Fuzzy bilateral filtering for color images,” in Proc. Int. Conf. Image Analysis and Recognition, 2006, vol. 4141, pp. 138–145, Lecture Notes in Computer Science.
[31] Morillas, S., Schulte, S., Mélange, T., Kerre, E. E. And Gregori, V. “A soft-switching approach to improve visual quality of colour image smoothing filters,” in Proc. Advanced Concepts for Intelligent Vision Systems, 2007, vol. 4678, pp. 254– 261, Lecture Notes in Computer Science.
[32] Paris, S., Kornprobst, P., Tumblin,
J. And Durand, F. “A gentle
introduction to bilateral filtering and its applications,” presented at the ACM SIGGRAPH, 2007.
[33] Perona, P. And Malik, J., “Scale-space and edge detection using anisotropic diffusion,” IEEE Trans. Pattern Anal. Mach. Intell., vol. 12, no. 7, pp. 629–639, Jul. 1990.
[34] Perona, P. And Malik, J. “Scale-space and edge detection using anisotropic diffusion,” IEEE Trans. Pattern Anal. Mach. Intell., vol. 12, no. 7, pp. 629–639, Jul. 1990.
[35] Pham T. Q. And Vliet, L. J. V. “Separable bilateral filtering for fast video preprocessing,” in Proc. IEEE
Int. Conf. Multimedia Expo, 2005, pp. 454–457.
[36] Pitas, I. And Venetsanopoulos, A. N. “Order statistics in digital image processing,” Proc. IEEE, vol. 80, no. 12, pp. 1893–1921, Dec. 1992.
[37] Plataniotis, K. N. And Venetsanopoulos, A. N. Color Image Processing and Applications. Berlin, Germany: Springer, 2000.
[38] Saint-Marc, P. Chen, J. And Medioni, G. “Adaptive smoothing: a general tool for early vision,” IEEE Trans. Pattern Anal. Mach. Intell., vol. 13, no. 6, pp. 514–529, Jun. 1991.
[39] Schulte, S., Witte, V. De and Kerre, E. E., “A fuzzy noise reduction method for colour images,” IEEE Trans. Image Process., vol. 16, no. 5, pp. 1425–1436, May 2007.
[40] Smith, S. M. And Brady, J. M. “Susan—A new approach to low level image processing,” Int. J. Comput. Vis., vol. 23, no. 1, pp. 45–78, 1997.
[41] Sochen, N., Kimmel, R. And Malladi, R. “A geometrical framework for low level vision,” IEEE Trans. Image Process., vol. 7, no. 3, pp. 310– 318, Mar. 1998.
[42] Sochen, N., Kimmel, R. And Bruckstein, A. M. “Diffusions and confusions in signal and image processing,” J. Math. Imag. Vis., vol. 14, no. 3, pp. 195–209, 2001.
[43] Thompson, E. A., Hardie, R. C. And Barner, K. E. “Hybrid order statistic filter and its application to image restoration,” Appl. Opt., vol. 40, no. 5, pp. 656–661, 2001.
[45] Tomasi, C. And Manduchi, R. “Bilateral filtering for gray and color images,” in Proc. Int. Conf. Comput. Vis., 1998, pp. 839–846.
[46] Trahanias, P. E., Karakos, D. And Venetsanopoulos, A. N. “Directional processing of color images: Theory and experimental results,” IEEE Trans. Image Process., vol. 5, no. 6, pp. 868– 880, Jun. 1996.
[47] Tukey, J. W., “Nonlinear (nonsuperposable) methods for smoothing data,” in Proc. Congr. Rec. EASCOM, 1974, vol. 74, pp. 673–681.
[48] Van de Ville, D., Nachtegael, M., Van der Weken, D., Philips, W., Lemahieu, I., and Kerre, E. E., “Noise reduction by fuzzy image filtering,” IEEE Trans. Image Process., vol. 11, no. 4, pp. 429–436, Apr. 2001.
[49] Vardavoulia, M. I., Andreadis, I. And Tsalides, Ph., “A new vector median filter for colour image processing,” Pattern Recognit. Lett., vol. 22, no. 6–7, pp. 675–689, May 2001.