S O F T W A R E A R T I C L E
Open Access
AlignMiner: a Web-based tool for detection of
divergent regions in multiple sequence
alignments of conserved sequences
Darío Guerrero
1, Rocío Bautista
1, David P Villalobos
2, Francisco R Cantón
2, M Gonzalo Claros
1,2*Abstract
Background:Multiple sequence alignments are used to study gene or protein function, phylogenetic relations, genome evolution hypotheses and even gene polymorphisms. Virtually without exception, all available tools focus on conserved segments or residues. Small divergent regions, however, are biologically important for specific quantitative polymerase chain reaction, genotyping, molecular markers and preparation of specific antibodies, and yet have received little attention. As a consequence, they must be selected empirically by the researcher.
AlignMiner has been developed to fill this gap in bioinformatic analyses.
Results:AlignMiner is a Web-based application for detection of conserved and divergent regions in alignments of conserved sequences, focusing particularly on divergence. It accepts alignments (protein or nucleic acid) obtained using any of a variety of algorithms, which does not appear to have a significant impact on the final results. AlignMiner uses different scoring methods for assessing conserved/divergent regions,Entropybeing the method that provides the highest number of regions with the greatest length, andWeightedbeing the most restrictive. Conserved/divergent regions can be generated either with respect to the consensus sequence or to one master sequence. The resulting data are presented in a graphical interface developed in AJAX, which provides remarkable user interaction capabilities. Users do not need to wait until execution is complete and can.even inspect their results on a different computer. Data can be downloaded onto a user disk, in standard formats.In silicoand experimental proof-of-concept cases have shown that AlignMiner can be successfully used to designing specific polymerase chain reaction primers as well as potential epitopes for antibodies. Primer design is assisted by a module that deploys several oligonucleotide parameters for designing primers“on the fly”.
Conclusions:AlignMiner can be used to reliably detect divergent regions via several scoring methods that provide different levels of selectivity. Its predictions have been verified by experimental means. Hence, it is expected that its usage will save researchers’time and ensure an objective selection of the best-possible divergent region when closely related sequences are analysed. AlignMiner is freely available at http://www.scbi.uma.es/alignminer.
Background
Since the early days of bioinformatics, the elucidation of similarities between sequences has been an attainable goal to bioinformaticians and other scientists. In fact, multiple sequence alignments (MSAs) stand at a cross-road between computation and biology and, as a result, long-standing programs for DNA or protein MSAs are nowadays widely used, offering high quality MSAs. In recent years, by means of similarities between sequences
and due to the rapid accumulation of gene and genome sequences, it has been possible to predict the function and role of a number of genes, discern protein structure and function [1], perform new phylogenetic tree recon-struction, conduct genome evolution studies [2], and design primers. Several scores for quantification of resi-due conservation and even detection of non-strictly-con-served residues have been developed that depend on the composition of the surrounding residue sequence [3], and new sequence aligners are able to integrate highly heterogeneous information and a very large number of sequences. Without exception, the sequence similarity of * Correspondence: [email protected]
1Plataforma Andaluza de Bioinformática (Universidad de Málaga), Severo
Ochoa, 34, 29590 Málaga, Spain
MSAs is optimised [4]. Some databases such as Ensembl and PhIGs can provide information on conserved regions across different species.
In contrast, meanwhile, detection of divergent regions in alignments has not received the necessary attention, with the inevitable consequence of a lack of appropriate tools to address this subject. Divergent regions are in fact as biologically interesting as similar regions, since they are useful in the following aspects: (i) high-throughput expression profiling using quantitative PCR (qPCR), which is considered to distinguish between clo-sely-related genes [5]; (ii) confirmation of expression results obtained by microarray technology, as well as quantification of low-abundance transcripts; (iii) taxon-omy and varietal differentiation is based on small differ-ences between organisms: it enables appropriate categorisation. Since the genetic material of individuals from the same species is very similar, it is necessary to detect specific differences to distinguish between them [6]; (iv) SNP (single nucleotide polymorphism) and dis-eases: most differences between healthy and unhealthy organisms are based on single-nucleotide differences [7]; (v) identification of pathological and autopsy specimens in forensic medicine is based on minimal sequence dif-ferences among samples [8]; (vi) primer design for PCR-based molecular markers relies on differences among DNA sequences [9]; (vii) one way of preparing highly-specific monoclonal antibodies is by immunisation with highly-divergent peptides, instead of with the whole pro-tein [10].
Analysis of gene and genomic variation has been revo-lutionised by the advent of next-generation sequencing technology, revealing a considerable degree of genomic polymorphism. This has led to studies focusing on SNP discovery and genotyping [7,11-18], as well as the design of properly conserved primer candidates from MSAs [19,20], for comparative studies of genes and genomes [21]. Most of these tools are operating system-depen-dent and only a few are Web-based, in which case they have a relatively static interface. However, there is neither adequate software for, nor study on, MSAs for detection of polymorphic regions and discrepancies (beyond single nucleotide dissimilarities) that would provide a numerical score related to divergence signifi-cance. In short, researchers find themselves empirically detecting which sequence fragment, among a series of paralogs and/or orthologs, can be used to design specific primers for PCR, or which specific probes or specific linear epitopes can be synthesised in order to obtain antibodies. Together, these factors have been the main motivation for development of AlignMiner: this software was intended to cover the gap in bioinformatic function by evaluating divergence, rather than similarity, in align-ments that involve closely-related sequences. For any
type of DNA/protein alignment, through its Web inter-face AlignMiner is able to identify putative SNPs, diver-gent regions, and conserved segments. The results can be inspected graphically via an innovative, interactive graphical interface developed in AJAX, or saved in any of several formats.
Implementation
Architecture
AlignMiner is a free Web-based application that has been developed in three layers, each making use of object-oriented methodologies. The first layer contains the algorithm core. It is written entirely in Perl and uses Bioperl [22] libraries for MSA loading and manipulation. Hence, it can run in any operating system provided that Perl 5.8, BioPerl 1.5.2, and the Perl modules Log::Log4-perl, JSON and Math:FFT are installed. BioPerl has been chosen because it provides a rich set of functions and an abstraction layer that handles nearly all MSA formats currently available. The second layer links the algorithm with the interface using the necessary CGIs written in Perl. The third (top) is a front-end layer based on AJAX [23] techniques to offer an interactive, quick and friendly interface. Intermediate data and final results are saved using JSON [24], a data format that competes with XML for highly human-readable syntax, and for efficiency in the storage and parsing phases. Firefox or Safari Web browsers are recommended, since Internet Explorer does not support some of the advanced fea-tures of AJAX. AlignMiner has been tested for correct operation in a few flavours of Linux and various Mac OS X machines, to verify full compatibility.
Owing to its layered architecture, AlignMiner can function in four execution modes: (i) as a command line for advanced users to retain allUnixcapabilities of inte-gration, within any automation process or pipeline; (ii) as a REST Web service, also for advanced users, which enables its integration in workflows; (iii) as a single workstation where jobs are executed on the same com-puter that has the Web interface – this setting is not recommended since it is prone to saturation when mul-tiple jobs are sent simultaneously; (iv) as an advanced Web application (this is the preferred mode), where jobs are transferred to a queue system which schedules the execution depending on the resource availability –this minimises the risk of saturation while maintaining inter-activity. Data management remains hidden to users.
Algorithm
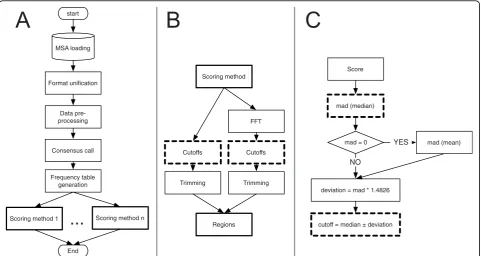
The AlignMiner algorithm is outlined in Figure 1A. It can be divided into the following main steps:
are expected to load already-built MSAs obtained using external programs such as M-Coffee [25,26] or MultAlin [27] (for a review of MSA tools, see [4]). However, AlignMiner is also able to align a set of sequences in FASTA, MSF, CLIJSTALW and other formats using the fast, accurate and memory-effi-cient Kalign2 [28]. The alignment file is loaded into the Bioperl SeqIO abstraction object, which enables AlignMiner to read nearly all MSA formats. The for-mat is not inferred from the file extension but by searching the file contents for format-specific pat-terns. Users are alerted if there are faulty, corrupted or unknown file formats.
2. Format unification: For efficient data manage-ment, all MSA formats are encapsulated into a com-mon JSON representation and saved to disk to make them accessible to other AlignMiner modules. 3.Data pre-processing: The alignment is examined to extract basic characteristics that are used in inter-nal decisions, such as the number of sequences, MSA length, type of aligned sequences (DNA/pro-tein), and MSA format, and an identifier is assigned to each sequence. These characteristics are also dis-played in the ‘Job List’tab in order to provide some information regarding the MSA content. Finally,
AlignMiner automatically analyses the MSA to determine the region where the algorithm is going to be applicable: there is usually a high proportion of gaps at each MSA end that would lead to mis-leading results for frequencies (see below), due to the small number of sequences and the low align-ment reliability at these positions [1]. The MSA ends are then sliced until at least two contiguous positions do not include any gap. Slicing limits can also be set manually if desired.
4.Consensus call:A consensus sequence is assessed from the whole MSA using BioPerl capabilities to serve as the weighting reference for calculations. When a user defines one sequence within the MSA as themaster sequence, scoring calculations (see below) will now be referred to it instead of to the consensus.
5.Frequency table:Since the scores implemented in AlignMiner require knowledge of the number of nucleotides or amino acids present at each position of the MSA, these frequencies are stored in tempor-ary tables as a simple caching mechanism to speed up the algorithm performance, in order to spend nearly the same time with a few aligned sequences as with a large number of aligned sequences (see below). start
MSA loading
Data pre-processing
End Format unification
Consensus call
Frequency table generation
Scoring method 1
...
Scoring method nScoring method
Cutoffs
Trimming
FFT
Cutoffs
Trimming
Regions
Score
mad (median)
mad = 0 mad (mean)
cutoff = median ± deviation deviation = mad * 1.4826
YES
NO
A
B
C
6. Scoring: Several scoring methods (see next sec-tion for details) are included in AlignMiner in order to enhance different aspects of each MSA. This is the slowest portion of the algorithm since each scor-ing method has to read and process the complete MSA (further optimisation, including parallelisation, will be addressed to this step in the near future). Each scoring method provides a single value for each alignment column that enables the evaluation of conservation (positive value) or divergence (nega-tive value) at every column of the MSA (Figure 1B). Concerning gaps, there is neither consensus inter-pretation nor an adequate model for handling gaps in alignments. Therefore, in this work, the presence of a gap in a column is considered as the lowest conservative substitution. By default, it is expected that sequence divergence is spread over the sequence (as was previously with the case with pro-tein MSAs), such that scores produce clear maxi-mum and minimaxi-mum peaks reflecting conserved and divergent positions, respectively. In order to extract the significant peaks, a robust and consistent mea-sure is calculated based on the median value of the score and two cutoffs (Figure 1C). Cutoffs rely on 1.4826 times themedian absolute deviation (MAD=
median[abs(X– median[X])]) such that they define a
margin equivalent to one standard deviation from the median. When sequences in the MSA are closely related (note that DNA sequences are to be closely related), the median is 0, and the MAD is also 0 or very close to 0. In such a case, a reliable cutoff was established using a MAD-like measure based on the mean (instead of the median) to avoid the overpopu-lation of zero-valued positions, such as MAD_mean
= mean[abs(X - mean[X])]. This cutoff will only
reveal divergent regions of the MSA.
7. Regions: Nucleotides whose score is below the low cutoff boundary are reported as a putative SNP provided that each variation appears in at least two sequences (as a consequence, alignments of less than four sequences would lack the capacity for SNP pre-diction). It should be taken into account that neither synonymy nor the potential effects on protein struc-ture are checked for these putative SNPs, since AlignMiner is not designed to predict the signifi-cance of SNPs. Obviously, such a calculation is not performed with protein MSAs. Raw scores are smoothed by a fast Fourier transform ("FFT”in Fig-ure 1B) such that contiguous sharp peaks become wide ranges in order to assess changes in regions, rather than nucleotides. The algorithm reports those positions of the raw and FFT-transformed values that have a score higher (conserved) or lower (diver-gent) than the corresponding cutoffs for conserved/
divergent regions. In the case of DNA alignments, divergent regions must additionally include at least two putative SNPs. The arithmetic mean of the score of every nucleotide/amino acid encompassed by that region gives the characteristic score for the region.
Scoring methods
All scoring methods described below are included in the common base algorithm depicted in Figure 1, since they are all based on the information contained in each col-umn of MSAs. The only differences between the scoring methods are in the weight table and formula for each. All scores are calculated specifically for each type of sequence (DNA/protein) and for the particular MSA being processed, so it is up to users to decide which one best applies in their situation. Common parameters for all scoring methods are:
•g(i, b)® Count of nucleotide instancesb at posi-tioniof the MSA.
•C(i)®Nucleotide at position iin the consensus or master sequence.
•M(b1,b2)® Weighting for nucleotideb2 when its correspondingC(i) isb1.
•D(i)® Number of different nucleotides found at positioniof the MSA.
•B®Set of nucleotides found in the MSA.
•nseq®Number of sequences in the MSA.
It should be taken into account that each of the fol-lowing scoring methods will provide a different score range. However, all of them are intended to produce positive values for conserved regions and negative values for divergent regions, and are not zero-centred in any case.
Weighted The Weighted score is applicable to any sequence type. For each positioniof the alignment, it is calculated as:
Weighted i
b i M C i b b B nseq ( ) ( ( , )* ( ( ), )) = ∈ ∑ (1)
Protein alignments are weighted using “Blosum62” [31,32].
DNAWDNAW applies only to DNA sequences
contain-ing A, C, T and G, since it is a simplification of the Weightedscore when weights are 1 for identity and 0 for difference. Hence, for each position i of the align-ment,
DNAW i C i i nseq nseq
( )=2* ( ( ), ) − (2)
As a result, and like Weighted, a lower value is obtained when the difference found between sequences is higher. Again, it is not zero-centred.
Entropy A parameter frequently used for quantifying the composition of an individual column i is its entropy H(i), since it is an ideal representation of disorder at every MSA position and can be very usefully employed to assess differences in a MSA.H(i) is defined as follows (using frequencies instead of probabilities):
H i b i
nseq
b i nseq
b B
( )= − ( , )* log ⎛ ( , ) ⎝ ⎜ ⎞ ⎠ ⎟ ⎡ ⎣ ⎢ ⎢ ⎤ ⎦ ⎥ ⎥ ∈
∑
2 (3)However, for consistency with the rest of the scoring results (where divergent regions are represented with lower values than conserved ones),Entropyscoring is sign-switched, such thatEntropy=–H(i).
VariabilityVariability represents another way to evalu-ate changes in an alignment position without taking into account whether variations are conservative or not. The rationale is that any position change is valid for marking a difference between sequences. Negative values indicate greater variability. It is defined by the equation:
Variability i D i nseq
C i i
( ) ( )*
( ( ), )
= − (4)
Primer design module
One of the most useful applications derived from retrie-val of divergent regions is the design of PCR primers
“on the fly”. A window containing the divergent region plus five nucleotides on each side defines a primer by default. Parameters for the displayed nucleotide window are calculated as in [33], that is: length, GC content, melting temperature, absence of repeats and absence of secondary structures. An optimal primer sequence should contain: (i) two to three G’s or C’s for 3’-end sta-bility; (ii) a GC content of between 40% and 60%; (iii) a melting temperature above 52°C; and (iv) the absence of secondary structure formation, that is, the maximum free energy must be above -4 kcal/mol for dimer forma-tion or -3 kcal/mol for hairpin formaforma-tion. Every
parameter is printed over a colour that suggests the value compliance: green indicates that the primer is in agreement with the above requirements, and orange, red or blue that the sequence should be optimised. Users can move the window size in order to obtain optimal parameters so that the optimal primers are expected to have “green” properties (Additional file 1 Figure S1).
The primers so designed can be tested in silica by
means of the “PCR amplification” Web tool [34] at BioPHP [35] against every sequence of the alignment. It should be noted that primers designed with AlignMiner are intended to identify a specific sequence; therefore, degenerate primer design is disabled.
Usage
The AlignMiner Web interface was designed for maxi-mum simplicity and convenience of use. Users must log on with their e-mail to obtain a confidential space within the public environment (no registration is needed). Their data are stored there for at least four weeks, although old jobs may be deleted by the adminis-trator for space limitation reasons; in fact, users are recommended to locally save their analysis. A new job starts when a file containing one MSA (most popular formats are accepted such as Clustal, NEXUS, MSF, PHYLIP, FASTA...), or a set of sequences to be aligned with Kalign2, is uploaded and a name is optionally given. A small amount of basic information (sequence count, length, file type, etc) about every job is shown to the user in order to verify that it has been correctly pre-processed. Users can then decide to mark a specific sequence asmaster. In such a case, the algorithm is directed to look for the most divergent/conserved regions with respect to the master instead of the con-sensus sequence. This option enables identification of overall divergences (by default) or regions that serve to clearly differentiate the master sequence from the other sequences. Finally, users can either decide themselves which portion of the alignment will be analysed, or allow AlignMiner to decide.
At this moment, the job is already shown in the Job List with a “waiting” status. Once the“Run” button is pushed, the batch system takes control, and the status (pending, queued, running or completed) is displayed in real time. Afterwards, users can decide to (1) wait until the most recent job is finished, (2) browse previously-completed jobs, (3) launch new jobs, or (4) close the Web browser and return later (even on a different com-puter) to perform any of the first three operations. Job deletion is always enabled.
dragging, zooming, and even“snapshooting” a portion of the graphical plot. The plot can be saved on the user’s computer in PNG format; a record of snapshots is addi-tionally maintained on the screen. Results are also represented in a tabular form linked to the graphical plot: each table row is linked to its corresponding region in the plot, and vice-versa. Tables can be ordered by position or score values, and exported to GFF (general features format) for external processing.
AlignMiner can also be used as a Web service. The REST protocol has been used due to is wide interoper-ability and because it only needs an HTTP stack (either on the client or the server) that almost every platform and device has today. The Web service of AlignMiner can be invoked to send, list, delete, or download jobs. Job results can be downloaded as a whole, or file by file. URL, http verb and optional fields are indicated in Additional file 2 Table S1. Theapi_login_key field is compulsory for any REST invocation of AlignMiner since it serves to allocate the corresponding disk space. An example of submitting a new job using thecurl cli-ent is:
curl -X POST
-F http://api_login_key=your@email. net
-F alignment_file_field=@/tmp/tests/ sequences.fna
-F job_name_field=MyAMtest -F master_field=NONE
-F align_start_field = 0 -F align_end_field = 0
http://www.scbi.uma.es/ingebiol/com-mands/am/jobs/0/stage/1.json
Obtaining a job status by means of a browser is per-formed by:
http://www.scbi.uma.es/ingebiol/com- mands/am/jobs/[email protected]
Polymerase chain reaction
Each PCR was performed on a T1 Thermocycler (Bio-metra). The PCR reaction mixture for a 100μl volume contained 75.5μl of distilled water, 10μl 10 × PCR buf-fer, 2μl dNTP mix (12.5 mM each), 2μl of each primer (20 μM), 0.5 μl Taq polymerase (5 U/μl), and 5 μl of template DNA. The PCR commenced with 5 min of denaturation at 94°C and continued through 35 cycles consisting of the following steps: 94°C for 1 min, 4°C over the lowest melting temperature (Tm) of the corre-sponding primer pair for 1 min, and 72°C for 2 min. Cycles were followed by a final extension step at 72°C for 8 min. When the template was cDNA or plasmid
DNA, the 5 μl of template contained 20 ng of DNA,
whereas it contained 1 μg when template was genomic
DNA. The amplification products were analysed using 1.5% (w/v) agarose gel electrophoresis.
Results and Discussion
The vast amount of data involved in MSAs makes it impossible to manually identify the significantly diver-gent regions. In order to assess the speed, success rate and experimental usefulness of AlignMiner with differ-ent real and hypothetical MSAs, two algorithms for MSA were used: one is M-Coffee [25] which generates high-quality MSAs by combining several alternative alignment methods into one single MSA, and the other is MultAlin [27] which is based on a hierarchical clus-tering algorithm using progressive pairwise alignments.
AlignMiner Performance
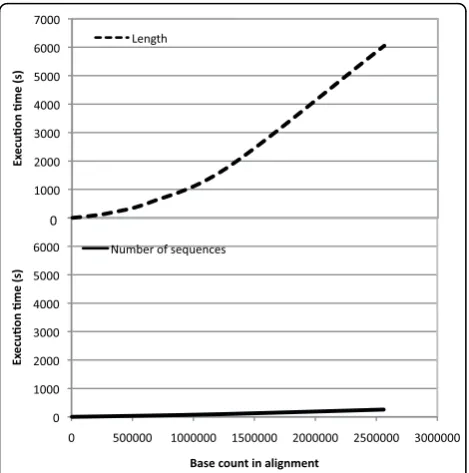
The speed and performance of AlignMiner were ana-lysed by increasing the two-dimensional size of the MSA. A first assay was designed to test AlignMiner per-formance when increasing the number of aligned sequences for a fixed length. The second test was designed to assess AlignMiner behaviour when a fixed number of sequences (four in this case) contained longer and longer alignments. Figure 2 clearly shows that execution time increased with the number of nucleotides included in the MSA. However, it was not significantly affected by the number of aligned sequences (solid line), but by the increase in alignment length (dashed line). Accordingly, the execution time would be long only when relatively long genomic sequences were analysed. This behaviour was expected, since AlignMiner is optimised to work with an extre-mely large number of sequences through the use of fre-quency tables (see the Algorithm section).
These caching techniques allowed the algorithm to use the same amount of memory and spend a fixed time in score calculation, independently of the number of sequences loaded. The subtle increment in time related to the increment in sequences arises from population of the frequency table, which was done sequentially for every aligned sequence.
Computationally, these assays provided further infor-mation for AlignMiner, since they were executed on a multiprocessor computer where the queue system was to be given some information regarding the estimated execution time for each job. Obviously, it is impossible to provide an exact value in every case, but the execu-tion times shown in Figure 2 served to provide an esti-mated execution-time curve for the queue system.
Scoring method characterisation
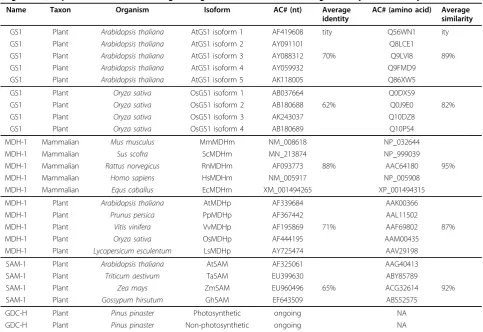
scores was performed with the 23 full-length sequences (nucleotide and amino acid) of genes described in Table 1. They include genes having at least four different para-logs in one organism, and others with several orthopara-logs in at least four organisms. All of the sequences were compliant with the maximum MSA size that prevents overflow of the M-Coffee size limits. As example of clo-sely-related paralogous genes, the five cytosolic
gluta-mine synthetase isoforms of Arabidopsis thaliana
(AtGS1) and the four cytosolic glutamine synthetase
iso-forms of Oryza sativa(OsGS1) were included. As an
example of orthologous genes, the five genes of mam-malian malate dehydrogenase 1 (MDHm), five plant genes of the mitochondrial NAD-dependent malate dehydrogenase (MDHp), and four plant genes ofS -ade-nosylmethionine synthetase (SAM) were included. Sequences were aligned with both MultAlin [27] and M-Coffee [26] using default parameters. Average nucleo-tide identity was over 62% and the amino acid similarity was over 82%. No clear correlation was found among identity/similarity and orthologs/paralogs in these MSAs, and so further testing would not be biased. The terminal portions of the MSAs were automatically removed by AlignMiner in order to analyse only the portions where all sequences were aligned, and so
discard the highly “noisy” ends. Hence, uninformative hyper-variable segments were not included in the analy-sis. However, it should be noted that these hyper-vari-able regions in nucleotide MSAs could be considered for designing specific probes for Northern and Southern blots.
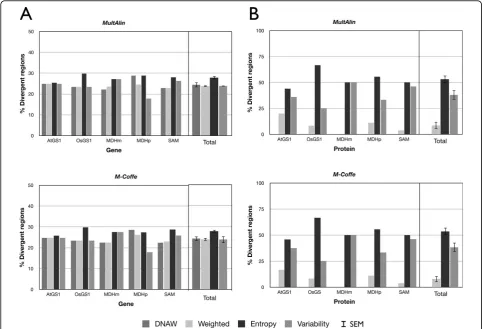
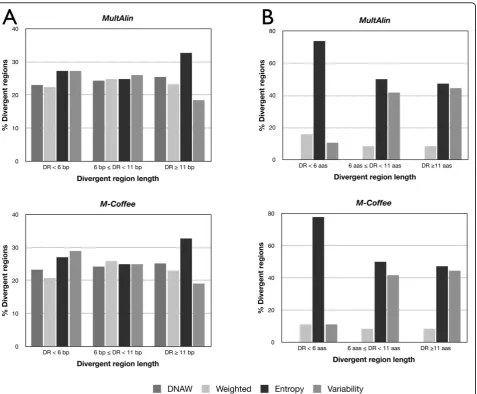
At first, the proportion of divergent regions was com-pared between MSAs (Figure 3). A percentage was used in order to obtain comparable results, since MSAs of less similar sequences (OsGS1 [paralogs] and SAM [orthologs]) provided more highly-divergent regions than MSAs containing closely-related sequences. In
nucleotide MSAs (Figure 3A), Entropy provided the
highest number of divergent regions in the five MSAs,
while theDNAW, Weightedand Variability
meth-ods exhibited variable behaviour. Averaging all the results for a single value with its SEM (standard error of the mean) confirmed the previous result, i.e. the number of divergent regions usingEntropywas clearly higher than when using the other methods, among which the percentage was lower and statistically-similar. For amino acid MSAs (Figure 3B), the percentages were more
vari-able among the scoring methods, but Entropyagain
provided the highest value, while Weightedgave the lowest value in all instances (clearly, it was the most restrictive in both nucleotide and amino acid MSAs). On the other hand, Figure 3B also shows that, when the sequences aligned are very similar (AtGS1, SAM, and
MDMm), Entropy and Variabilitybehave
simi-larly with regard to the divergent region percentage,
whilst Variabilityclearly provides a lower number
of divergent regions than Entropy. Therefore,
Entropy was the method that identified the greatest number of divergent regions for any kind of MSA, while Weightedwas revealed to be the most restrictive.
Scoring methods should also be characterised by the region length they determine. Divergent regions were classified by their length in three intervals: less than six positions, between six and 11 positions, or more than 11 positions. In nucleotide MSAs (Figure 4A), it became apparent thatEntropyalso rendered the longest diver-gent regions, while all the methods were roughly equiva-lent for regions below 11 nucleotides. In protein MSAs
(Figure 4B),VariabilityandEntropy behave
simi-larly with respect to identification of divergent regions longer than either six or 11 amino acids, although Entropy in both cases identified a slightly larger
num-ber of divergent regions than Variability.
Weighted again provided a low number of long
diver-gent regions. However, Entropy provided by far the
highest number of divergent regions below six amino acids in length. In conclusion,Entropyseemed to pro-vide not only the highest number of divergent regions, but also the longest ones; in contrast,Weighted was Figure 2Execution time versus number of nucleotides in the
the most restrictive, providing the lowest number of divergent regions, which were also slightly shorter. It could be hypothesised that these differences are due to the fact thatEntropy considers only the frequency of symbols (and not the features of the represented object)
while Weighted (and DNAW) take into account the
properties of the subject amino acid or nucleotides. This is in agreement with the fact that the entropy concept has proven useful in many fields of computational biol-ogy, such as sequence logos corresponding to conserved motifs [36] and the identification of evolutionarily-important residues in proteins [3].
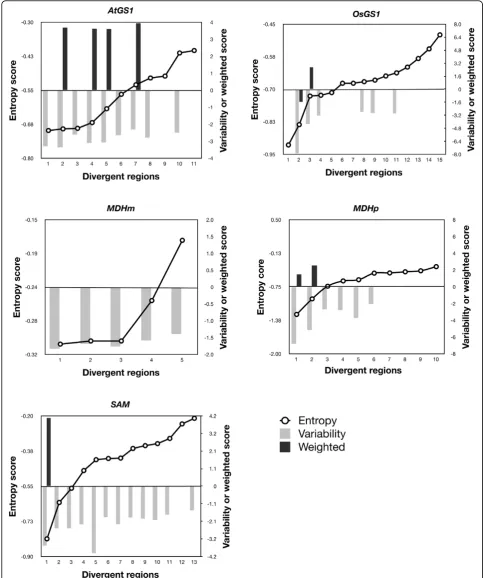
Since there seems to be a clear difference in the num-ber and length of divergent regions revealed by the dif-ferent scoring methods, it could be expected that
divergent regions discovered by Variability and
Weightedwould be included among the regions dis-covered byEntropy. Figure 5 and Additional file 3 Fig-ure S2 show the divergent regions revealed byEntropy ordered by score for every protein MSA and, superim-posed, the scores of the divergent regions revealed by VariabilityandWeighted. Clearly, theEntropy score included the divergent regions revealed by
Variabilityand Weightedbeside otherEntropy -specific regions (positions where no column is shown in Figure 5 and Additional file 3 Figure S2). Moreover, the divergent regions revealed byWeightedwere often the ones with the highest scores, which is consistent with the fact that this scoring method was the most restric-tive. In conclusion,Entropyshould be used if a greater number of divergent regions are desired, while Weighted will find use when a small list of only the most significantly-divergent regions is required, and
Variability behaves like Entropy when the
sequences in the MSA are closely related, but behaves likeWeighted in the remainder of cases.
The Entropy scoring method has previously been compared with a scoring method based on phylogenetic theory, such as phastCons [37]. Two different align-ments have been used for the comparison. One was a MSA containing the same 1000 nucleotides of four
genus Canis mitochondrial entries (AC numbers:
NC_009686, NC_008092, NC_002008, NC_008093); this alignment only contained 18 divergent positions. The other was the AtGS1 (Table 1) nucleotide MSA. The profile of both scores for both MSAs is shown in
Table 1 Description of sequences used in this work that served to assess the performance of different aspects of AlignMiner; sequences that have been aligned together have a common average identity and similarity values.
Name Taxon Organism Isoform AC# (nt) Average
identity
AC# (amino acid) Average similarity
GS1 Plant Arabidopsis thaliana AtGS1 isoform 1 AF419608 tity Q56WN1 ity
GS1 Plant Arabidopsis thaliana AtGS1 isoform 2 AY091101 Q8LCE1
GS1 Plant Arabidopsis thaliana AtGS1 isoform 3 AY088312 70% Q9LVI8 89%
GS1 Plant Arabidopsis thaliana AtGS1 isoform 4 AY059932 Q9FMD9
GS1 Plant Arabidopsis thaliana AtGS1 isoform 5 AK118005 Q86XW5
GS1 Plant Oryza sativa OsGS1 isoform 1 AB037664 Q0DXS9
GS1 Plant Oryza sativa OsGS1 isoform 2 AB180688 62% Q0J9E0 82%
GS1 Plant Oryza sativa OsGS1 isoform 3 AK243037 Q10DZ8
GS1 Plant Oryza sativa OsGS1 isoform 4 AB180689 Q10PS4
MDH-1 Mammalian Mus musculus MmMDHm NM_008618 NP_032644
MDH-1 Mammalian Sus scofra ScMDHm MN_213874 NP_999039
MDH-1 Mammalian Rattus norvegicus RnMDHm AF093773 88% AAC64180 95%
MDH-1 Mammalian Homo sapiens HsMDHm NM_005917 NP_005908
MDH-1 Mammalian Equs caballus EcMDHm XM_001494265 XP_001494315
MDH-1 Plant Arabidopsis thaliana AtMDHp AF339684 AAK00366
MDH-1 Plant Prunus persica PpMDHp AF367442 AAL11502
MDH-1 Plant Vitis vinifera VvMDHp AF195869 71% AAF69802 87%
MDH-1 Plant Oryza sativa OsMDHp AF444195 AAM00435
MDH-1 Plant Lycopersicum esculentum LsMDHp AY725474 AAV29198
SAM-1 Plant Arabidopsis thaliana AtSAM AF325061 AAG40413
SAM-1 Plant Triticum aestivum TaSAM EU399630 ABY85789
SAM-1 Plant Zea mays ZmSAM EU960496 65% ACG32614 92%
SAM-1 Plant Gossypum hirsutum GhSAM EF643509 ABS52575
GDC-H Plant Pinus pinaster Photosynthetic ongoing NA
Additional file 4 Figure S3. The minimum peaks in the
Canis MSA analysed with phastCons corresponded to
the divergent positions detected in AlignMiner. While phastCons provided different scores for the conserved portions, AlignMiner collapsed them to 0, as described previously. However, in the case of the AtGS1 MSA, where more differences can be found, the situation is the opposite: AlignMiner clearly identified the divergent regions while phastCons collapsed them to 0; moreover, the scores of the divergent regions in this MSA are more highly-negative than in theCanisMSA, reflecting the fact that there are more variations in the AtGS1 MSA than in theCanisMSA. Therefore, phastCons and AlignMiner appear to be complementary, since phast-Cons is devoted to conserved fragments while AlignMi-ner is specialised for divergent regions of MSAs with various levels of similarity. Only when the MSAs share over 99% identity do both algorithms identify the same divergent nucleotides without hesitation.
Figures 3 and 4, as well as Figure 5 and the Additional file 3 Figure S2, show that the AlignMiner results seem
to be independent of the alignment algorithm used, since the histograms of M-Coffee are almost identical to those of MultAlin in spite of their different rationales. This is not surprising, because divergent regions are still found among conserved sequences. Therefore, divergent regions found by AlignMiner should not be strongly biased by the alignment algorithm, and this enables users to seed AlignMiner with a MSA generated using their preferred algorithm. This finding is in agreement with other algorithms exploiting the information depos-ited in each column of a MSA [3]. In accordance with this robustness, only MSAs obtained with M-Coffee will be used from now on.
In silico proof-of-concept cases
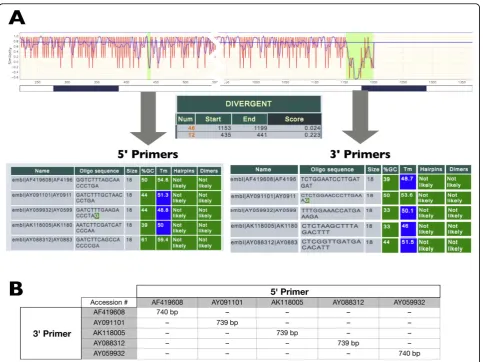
inspected with DNAW. The resulting divergent regions were sorted by decreasing score and the best regions (scores 0.223 and 0.024) were selected for primer design (Figure 6A and Table 2) with the help of the primer tool. These primers were shown to selectively amplify each isoform ofGS1 in silico (Figure 6B), as revealed by
“PCR amplification”of the BioPHP suite [35].
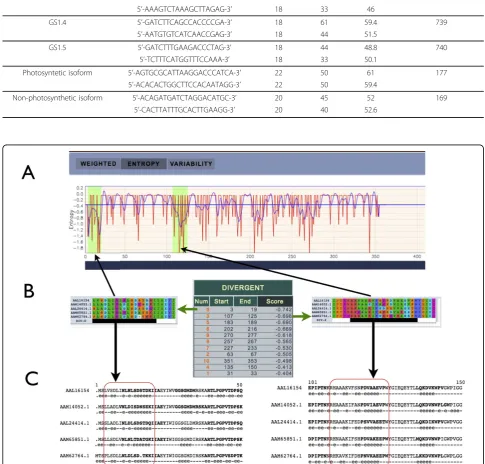
Identification of divergent regions among proteins can also be performed. It may be hypothesised that the most divergent regions could be epitopes for production of specific, even monoclonal, antibodies that can serve to distinguish very closely-related protein isoforms. As an example, the five glutamine synthetase (GS1) enzyme isoforms of A. thaliana(AtGS1, Table 1) were aligned with MultAlin using default parameters. TheEntropy scoring method was used since it identified the longest
divergent regions (Figure 4). The resulting divergent regions were sorted by score and the best ones were selected (Figure 7B). Each GS1 sequence was addition-ally inspected for solvent-accessible positions and highly antigenic regions using the SCRATCH Protein Predictor Web suite [38]. It appeared that the most highly-diver-gent Entropy-derived regions corresponded to the most solvent-accessible and most antigenic portions of the protein (Figure 7C). These sequences can then be used to challenge mice or rabbits and obtain specific antibodies against any one of the aligned sequences.
Experimental case study of divergent regions in a nucleotide MSA
of a Pinus pinastergene, one from photosynthetic tissue and one from non-photosynthetic tissue (Table 1) were analysed. Sequences were aligned with MultAlin using default settings. The resulting alignment was loaded into AlignMiner and divergent regions were identified with theWeighted score in obtain a small list of the most divergent regions. This enabled the design of specific primers for the photosynthetic and non-photosynthetic isoforms (Figure 8A, Table 2). PCR amplification with these primers using different DNAs as template (Figure 8B) confirmed that each primer pair amplified only the isoform for which it was designed, without any cross-amplification, using as template either total cDNA (Fig-ure 8B, lanes 3) or specific cDNA inserted into a plas-mid (Figure 8B, lanes 1 and 2). Since primers pairs are expected to span exon-exon junctions, no amplification was observed using genomic DNA (Figure 8B, lanes 4). These results suggested that the algorithm had correctly
identified a divergent region, and that the primers were correctly designed and worked as predicted by the software.
Conclusions
Table 2 Details of primers designed with AlignMiner to identify specifically by PCR the fiveA. thalianaGS1 genes as well as the two primer pairs that identify the photosynthetic and non-photosynthetic isoforms ofP. pinaster; note that the 3’(reverse) primer is complementary to the sequence appearing in Figures 6 and 8.
Isoform Primer Length %GC Tm (°C) Amplicon size (bp)
GS1.1 5’-GGTCTTTAGCAACCCTGA-3’ 18 50 54.6 740
5’-ATCATCAAGGATTCCAGA-3’ 18 39 48.7
GS1.2 5’-GATCTTTGCTAACCCTGA-3’ 18 44 51.3 739
5’-CTTTCAAGGGTTCCAGAG-3’ 18 50 53.6
GS1.3 5’-AATCTTCGATCATCCCAA-3’ 18 39 50 739
5’-AAAGTCTAAAGCTTAGAG-3’ 18 33 46
GS1.4 5’-GATCTTCAGCCACCCCGA-3’ 18 61 59.4 739
5’-AATGTGTCATCAACCGAG-3’ 18 44 51.5
GS1.5 5’-GATCTTTGAAGACCCTAG-3’ 18 44 48.8 740
5’-TCTTTCATGGTTTCCAAA-3’ 18 33 50.1
Photosyntetic isoform 5’-AGTGCGCATTAAGGACCCATCA-3’ 22 50 61 177
5’-ACACACTGGCTTCCACAATAGG-3’ 22 50 59.4
Non-photosynthetic isoform 5’-ACAGATGATCTAGGACATGC-3’ 20 45 52 169
5’-CACTTATTTGCACTTGAAGG-3’ 20 40 52.6
the predictions of AlignMiner are not markedly affected by the mode of MSA generation. This is mainly attributable to the fact that the MSAs com-prised highly similar sequences, and most differences among MSA algorithms involve divergent regions [40]. In this study, the degree of similarity among sequences did not appear to qualitatively affect the
results. While Entropyprovided the highest number
of divergent regions of the longest size, Weighted
provided only a small set of the most divergent regions. Additionally, AlignMiner was found to be complementary to the phastCons algorithm [37], since the former reinforces the differences and the latter, the similarities. Wet and dry laboratory experiments showed that AlignMiner can be used to provide speci-fic primers for PCR amplispeci-fication of one gene among a gene family of orthologs and paralogs, as well as to select protein epitopes for antibody production. More-over, use of this software confirmed that divergent regions in protein alignments can be viewed as puta-tive specific antigenic sequences.
The calculations in AlignMiner have been optimised in order to reduce execution times. In contrast
to other more static Web-based applications
[15-17,19,39], the AlignMiner interface is highly inter-active, using emergent Web technologies without third party solutions in order to resemble a stand-alone application. This renders the interactivity highly depen-dent on the computer capabilities and browser imple-mentation. Its implementation as a Web tool enables users to inspect their results on different computers, even those with different operating systems. The data flexibility means that it can handle most MSA formats, with each MSA obtained from orthologous and/or paralogous sequences, and can be saved in standard formats (PNG for images and GFF for data). We hope that AlignMiner will save researchers time when designing PCR primers, probes, and linear epitopes. We are also open to suggestions from the scientific community towards further development of AlignMi-ner. Institutions wishing to host mirrors of AlignMiner are encouraged to contact the authors.
Availability and requirements
Project name AlignMiner. No license or account is needed.
Operating systemsPlatform-independent
Programming languagesPerl for the algorithm; Ajax and HTML for the Web interface.
Other requirementsA Web browser supporting Java-Script and Ajax (preferably Mozilla Firefox or Safari) is required to use the public Web server. For installing AlignMiner, BioPerl, JSON, Log::Log4perl and Math:FFT Perl modules are required.
Additional material
Additional file 1: Figure S1. Examples of primer design using the primer tool of AlignMiner. In a good-quality set of oligonucleotides (left), all properties have a green background. When several primer properties are not in agreement with the characteristics stated in the text (right), they are marked in red (very bad), orange (adequate only) or blue (melting point is too low). In such a case, the sequence window must be moved around the divergent region (extending or narrowing it) in order to find a“green”primer; otherwise other divergent/conserved regions should be considered.
Additional file 2: Table S1. Details of the REST elements available, and the relevant instructions for invoking AlignMiner as a Web service.
Additional file 3: Figure S2. Distribution of score values of the divergent regions using the three scoring methods (Entropy, VariabilityorWeighting) in the five protein MSAs obtained with MultAlin.
Additional file 4: Figure S3. Scoring comparison provided by phastCons and AlignMiner with the MSAs of AtGS1 (left) and a highly-conserved fragment of 1000 nucleotides (right) from four differentCanis mitochondrial DNAs.
List of abbreviations
MSAs: multiple sequence alignments; PCR: polymerase chain reaction; dNTP: deoxynucleotide triphosphate; SEM: standard error of the mean; FFT: fast Fourier transform; DR: divergent region; bp: base pairs; aas: amino acids; AtGS1: cytosolic glutamine synthetase isoforms ofArabidopsis thaliana; OsGS1: cytosolic glutamine synthetase ofOryza sativa;MDHm: mammalian malate dehydrogenase 1; MDHp: plant mitochondrial NAD-dependent malate dehydrogenase; SAM: plantS-adenosylmethionine synthetase. Acknowledgements
The authors wish to acknowledge F. Lopes Pinto, H. Svensson and P. Lindblad for sharing with us the WebTag code. This study was supported by the Spanish MICINN grants AGL2009-12139-C02-02 and BIO2009-07490, European Union grant PLE2009-0016, and Junta de Andalucía funding to the research group BIO-114.
Author details
1Plataforma Andaluza de Bioinformática (Universidad de Málaga), Severo
Ochoa, 34, 29590 Málaga, Spain.2Departamento de Biología Molecular y Bioquímica (Universidad de Málaga), Campus de Teatinos, 29071 Málaga, Spain.
Authors’contributions
DG designed the interface and implemented the software. RB conducted thein silicotesting. DPV conducted the experimental testing. FRC supervised thein silicaand experimental testing, and helped in the manuscript writing. MGC conceived the study and wrote the manuscript. All authors read and approved the final manuscript.
Competing interests
The authors declare that they have no competing interests.
Received: 14 January 2010 Accepted: 2 June 2010 Published: 2 June 2010
References
1. Capra JA, Singh M:Predicting functionally important residues from sequence conservation.Bioinformatics2007,23(15):1875-1882. 2. Kim KM, Sung S, Caetano-Anollés G, Han JY, Kim H:An approach of
orthology detection from homologous sequences under minimum evolution.Nucleic Acids Res2008,36(17):e110.
4. Kemena K, Notredame C:Upcoming challenges for multiple sequence alignment methods in the high-throughput era.Bioinformatics2009,
25(19):2455-2465.
5. Czechowski T, Bari RP, Stitt M, Scheible W, Udvardi MK:Real-time RT-PCR profiling of over 1400 Arabidospis transcription factors: unprecedented sensity reveals novel root- and shoot-specific genes.Plant J2004,
38:366-379.
6. Claros MG, Crespillo R, Aguilar ML, Cánovas FM:DNA Fingerprinting and classification of geographically related genotypes of olive-tree (Olea europaea L.).Euphytica2000,116:131-142.
7. Savage D, Batley J, Erwin T, Logan E, Love CG, Lim GAC, Mongin E, Barker G, Spangenberg GC, Edwards D:SNPServer: a real-time SNP discovery tool.Nucleic Acids Res2005, ,33 Web Server:W493-5. 8. Ferri G, Alù M, Corradini B, Licata M, Beduschi G:Species Identification
Through DNA“Barcodes”.Genet Test Mol Biomarkers2009,13:421-426. 9. Bautista R, Crespillo R, Canovas FM, Claros MG:Identification of olive-tree
cultivars with SCAR markers.Euphytica2003,129:33-41.
10. Geysen HM, Rodda SJ, Mason TJ:The delineation of peptides able to mimic assembled epitopes.Ciba Found Symp1986,119:130-149. 11. Zhang J, Wheeler DA, Yakub I, Wei S, Sood R, Rowe W, Liu PP, Gibbs RA,
Buetow KH:SNPdetector: a software tool for sensitive and accurate SNP detection.PLoS Comput Biol2005,1(5):e53.
12. D RP, Del-Favero J:novoSNP3: variant detection and sequence annotation in resequencing projects.Methods Mol Biol2007,396:331-344. 13. Matukumalli LK, Grefenstette JJ, Hyten DL, Choi IY, Cregan PB, Van
Tassell CP:SNP-PHAGE-High throughput SNP discovery pipeline.BMC Bioinformatics2006,7:468.
14. Manske HM, Kwiatkowski DP:SNP-o-matic.Bioinformatics2009,
25(18):2434-2435.
15. Chang HW, Chuang LY, Cheng YH, Hung YC, Wen CH, Gu DL, Yang CH:
Prim-SNPing: a primer designer for cost-effective SNP genotyping. Biotechniques2009,46(6):421-431.
16. Tang J, Leunissen JA, Voorrips RE, van der Linden CG, Vosman B:
HaploSNPer: a web-based allele and SNP detection tool.BMC Genetics 2008,9:23.
17. Panitz F, Stengaard H, Hornshoj H, Gorodkin J, Hedegaard J, Cirera S, Thomsen B, Madsen LB, Hoj A, Vingborg RK, Zahn B, Wang X, Wernersson R, Jorgensen CB, Scheibye-Knudsen K, Arvin T, Lumholdt S, Sawera M, Green T, Nielsen BJ, Havgaard JH, Brunak S, Fredholm M, Bendixen C:SNP mining porcine ESTs with MAVIANT, a novel tool for SNP evaluation and annotation.Bioinformatics2007,23(13):i387-i391. 18. Wegrzyn JL, Lee JM, Liechty J, Neale DB:PineSAP - sequence alignment
and SNP identification pipeline.Bioinformatics2009,25(19):2609-2610. 19. Kim N, Lee G:QPRIMER: a quick web-based application for designing conserved PCR primers from multigenome alignments.Bioinformatics 2007,23(17):2331-2333.
20. Gadberry MD, Malcomber ST, Doust AN, Kellogg EA:Primaclade–a flexible tool to find conserved PCR primers across multiple species.
Bioinformatics2005,21(7):1263-1264.
21. Rascol VL, Levasseur A, Chabrol O, Grusea S, Gouret P, Danchin EGJ, Pontarotti P:CASSIOPE: An expert system for conserved regions searches.BMC Bioinformatics2009, ,10:284.
22. Stajich J, Block D, Boulez K, Brenner S, Chervitz S, Dagdigian C, Fuellen G, Gilbert J, Korf I, Lapp H, Lehvasläiho H, Matsalla C, Mungall C, Osborne B, Pocock M, Schattner P, Senger M, Stein L, Stupka E, Wilkinson M, Birney E:
The Bioperl toolkit: Perl modules for the life sciences.Genome Res2002,
12(10):1611-8.
23. Garret J:Ajax: A New Approach to Web Applications.Adaptive Path2005. 24. Java Script Object Notation. 1999 [http://www.json.org].
25. Wallace IM, O’Sullivan O, Higgins DG, Notredame C:M-Coffee: combining multiple sequence alignment methods with T-Coffee.Nucleic Acids Res 2006,34(6):1692-1699.
26. Moretti S, Armougom F, Wallace IM, Higgins DG, Jongeneel CV, Notredame C:The M-Coffee web server: a meta-method for computing multiple sequence alignments by combining alternative alignment methods.Nucleic Acids Res2007,35:W645-8 [http://www.tcoffee.org]. 27. Corpet F:Multiple sequence alignment with hierarchical clustering.
Nucleic Acids Res1988,16(22):10881-90.
28. Lassmann T, Frings O, Sonnhammer ELL:Kalign2: high-performance multiple alignment of protein and nucleotide sequences allowing external features.Nucleic Acids Res2009,37(3):858-65.
29. Pearson WR, Lipman DJ:Improved tools for biological sequence comparison.Proc Natl Acad Sci USA1988,85:2444-48.
30. Needleman SB, Wunsch CD:A general method applicable to the search for similarities in the amino acid sequence of two proteins.J Mol Biol 1970,48:443-453.
31. Sean R:Where did the BLOSUM62 alignment score matrix come from? Nature Biotechnology2004,22:1035-1036.
32. Blosum62 matrix.[http://www.ncbi.nlm.nih.gov/Class/FieldGuide/ BLOSUM62].
33. Pinto FL, Svensson H, Lindblad P:Webtag: a new web tool providing tags/anchors for RT-PCR experiments with prokaryotes.BMC Biotecnology 2007,7:73 [http://www.biomedcentral.com/1472-6750/7/73/].
34. PCR amplification at BioPHP. 2009 [http://biophp.org/minitools/ pcr_amplification/demo.php].
35. Bikandi J, San Millán R, Rementeria A, Garaizar J:In silicoanalysis of complete bacterial genomes: PCR, AFLP-PCR, and endonuclease restriction.Bioinformatics2004,20(5):798-799.
36. Schneider TD, Stephens RM:Sequence logos: a new way to display consensus sequences.Nucleic Acids Res1990,18(20):6097-6100. 37. Siepel A, Bejerano G, Pedersen JS, Hinrichs AS, Hou M, Rosenbloom K,
Clawson H, Spieth J, Hillier LW, Richards S, Weinstock GM, Wilson RK, Gibbs RA, Kent WJ, Miller W, Haussler D:Evolutionarily conserved elements in vertebrate, insect, worm, and yeast genomes.Genome Res 2005,15(8):1034-50.
38. SCRATCH Protein Predictor. 2009 [http://scratch.proteomics.ics.uci.edu/]. 39. Arvidsson S, Kwasniewski M, Riano-Pachón DM, Mueller-Roeber B:
QuantPrime–a flexible tool for reliable high-throughput primer design for quantitative PCR.BMC Bioinformatics2008,9:465.
40. Lassmann T, Sonnhammer E:Automatic extraction of reliable regions from multiple sequence alignments.BMC Bioinformatics2007,8(Suppl 5): S9.
doi:10.1186/1748-7188-5-24
Cite this article as:Guerreroet al.:AlignMiner: a Web-based tool for detection of divergent regions in multiple sequence alignments of conserved sequences.Algorithms for Molecular Biology20105:24.
Submit your next manuscript to BioMed Central and take full advantage of:
• Convenient online submission
• Thorough peer review
• No space constraints or color figure charges
• Immediate publication on acceptance
• Inclusion in PubMed, CAS, Scopus and Google Scholar
• Research which is freely available for redistribution