R E V I E W
Open Access
Observing the unwatchable through acceleration
logging of animal behavior
Danielle D Brown
1*, Roland Kays
2,3,4, Martin Wikelski
4,5,6, Rory Wilson
7and A Peter Klimley
8Abstract
Behavior is an important mechanism of evolution and it is paid for through energy expenditure. Nevertheless, field biologists can rarely observe animals for more than a fraction of their daily activities and attempts to quantify behavior for modeling ecological processes often exclude cryptic yet important behavioral events. Over the past few years, an explosion of research on remote monitoring of animal behavior using acceleration sensors has smashed the decades-old limits of observational studies. Animal-attached accelerometers measure the change in velocity of the body over time and can quantify fine-scale movements and body postures unlimited by visibility, observer bias, or the scale of space use. Pioneered more than a decade ago, application of accelerometers as a remote monitoring tool has recently surged thanks to the development of more accessible hardware and software. It has been applied to more than 120 species of animals to date. Accelerometer measurements are typically collected in three dimensions of movement at very high resolution (>10 Hz), and have so far been applied towards two main objectives. First, the patterns of accelerometer waveforms can be used to deduce specific behaviors through animal movement and body posture. Second, the variation in accelerometer waveform measurements has been shown to correlate with energy expenditure, opening up a suite of scientific questions in species notoriously difficult to observe in the wild. To date, studies of wild aquatic species outnumber wild terrestrial species and analyses of social behaviors are particularly few in number. Researchers of domestic and captive species also tend to report methodology more thoroughly than those studying species in the wild. There are substantial challenges to getting the most out of accelerometers, including validation, calibration, and the management and analysis of large quantities of data. In this review, we illustrate how accelerometers work, provide an overview of the ecological questions that have employed accelerometry, and highlight the emerging best practices for data acquisition and analysis. This tool offers a level of detail in behavioral studies of free-ranging wild animals that has previously been impossible to achieve and, across scientific disciplines, it improves understanding of the role of behavioral mechanisms in ecological and evolutionary processes.
Keywords:Accelerometer, Activity, Animal behavior, Bio-logging, Dead reckoning, Energy expenditure, Ethogram, Remote observation, Telemetry
* Correspondence:[email protected] 1
Department of Biology, Western Kentucky University, 1906 College Heights Blvd. #11080, Bowling Green, KY 42101-1080, USA
Full list of author information is available at the end of the article
Abstract
Resumen:El comportamiento es un mecanismo importante de la evolución y que se paga a través del gasto de energía. Sin embargo, los biólogos de campo raramente observan los animales durante más de una fracción de sus actividades y los intentos de cuantificar el comportamiento para el modelado de los procesos ecológicos a
menudo excluyen eventos crípticos pero importantes. En los últimos años se produjeron avances importantes en el monitoreo remoto del comportamiento de los animales, utilizando sensores de telemétro de aceleración
(acelerómetros) que empujan los límites tradicionales de los estudios observacionales. Acelerómetros unidos a los animales miden el cambio de la velocidad del cuerpo en el tiempo y pueden cuantificar los movimientos a escala fina y posturas corporales ilimitadas por la visibilidad, el sesgo del observador, o la escala de la utilización del espacio. Como pionero hace más de una década, la aplicación de los acelerómetros como una herramienta de monitoreo remoto ha aumentado recientemente debido al desarrollo de hardware y software más accesibles. Se ha aplicado a más de 120 especies de animales hasta hoy. Medidas de los acelerómetros se recogen típicamente en tres dimensiones de movimiento a muy alta resolución (>10 Hz), y hasta ahora se han aplicado hacia dos objetivos principales. Primero, los patrones de las formas de los acelerómetros de onda se pueden utilizar para deducir comportamientos específicos a través de movimiento de los animales y la postura corporal. Segundo, se ha demonstrado que la variación en las medidas de forma de los acelerómetros de onda se ha demostrado que se correlaciona con el gasto de energía, abriendo una serie de preguntas de carácter científico sobre especies muy difíciles de observar en la naturaleza. Hasta la fecha, los estudios de las especies acuáticas silvestres superan a las especies terrestres silvestres, y los análisis de los comportamientos sociales son muy pocos en número. Los investigadores de las especies domésticas y en cautiverio tienden a reportar metodología más completa que los que estudian las especies silvestres. Hay retos importantes para conseguir el máximo rendimiento de los acelerómetros, incluyendo la validación, calibración y gestión y análisis de grandes cantidades de datos. En esta revisión se ilustra cómo funciona el acelerómetro, se proporciona una visión general de las investigaciones
ecológicas que han empleado los acelerómetros y se destacan las mejores prácticas emergentes para la adquisición y análisis de datos. Esta herramienta ofrece un nivel de detalle en los estudios de comportamiento de los animales salvajes que han sido hasta ahora imposibles de alcanzar y, en todas las disciplinas científicas, que mejora la comprensión del papel de los mecanismos de comportamiento de los procesos ecológicos y evolutivos. Palabras claves:Acelerómetro, actividad, bio-registro, comportamiento animal, gasto energético, etograma, navegación a estima, observación a distancia, telemetría.
Review
“Man goes to nature to learn what nature is, but, in so doing, he introduces possibilities of distortion through his own presence.” –T.C. Schneirla (p. 1022, [1]).
Naturalists have long been aware that their presence can affect animal behavior [1,2]. Direct observation presents obvious difficulties when animals perceive humans as pred-ators [3] or when they are naturally secretive and elusive [4,5]. Habituating individuals to an observer is sometimes possible but it is labor-intensive, and can require long-term study [6,7]. Furthermore, though the subjects under study may be habituated, human presence can still affect their behavioral interactions with other non-habituated predator, prey or competitor species [8]. The observer is rarely un-detectable and even animals that do not appear to react to human presence may still change their behavior in subtle ways [9,10]. Direct observations are also biased by our own physical limitations [11-13] and tendencies to attend to some events and subjects more than others [14].
The field of biotelemetry grew out of the need to lo-cate animals at will and observe and record their habits des-pite their abilities to travel rapidly and widely in inclement
weather, underwater, or at night [12,13,15]. Locating ani-mals in space has progressed from manual tracking of animal-borne radio- or acoustic signals to automated depth and geomagnetic loggers and satellite-based positioning sys-tems that practically eliminate the observer effect and can now provide precise worldwide locations with few temporal or spatial constraints [11,16]. Nevertheless, a record of ani-mal locations or a depth profile tells where the aniani-mal was and how long it stayed there, but the behavioral context is absent and must either be inferred or demands a return to direct observation methods [17]. These issues underscore the need for remote measurement of animal behavior to re-duce or eliminate the potential effects of observer presence while maintaining a high level of detail in data recording that is comparable to direct observation [18]. Over the past few years, there has been an explosion of research on re-mote monitoring of animal behavior using measurements of acceleration (Figure 1) [19,20]. This tool, the accelerom-eter, has repeatedly circumvented many of the age-old limits of direct observation of animals in the field.
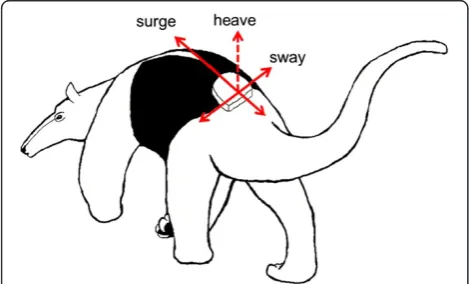
piezoelectric sensor. When deformed, the sensor gener-ates a wave-like voltage signal that is proportional to the acceleration (change in velocity) it experiences [22]. The sensor is deformed both by gravitational acceleration as well as inertial acceleration due to movement. From one to three of these sensors are aligned orthogonally to one another and affixed to an animal so that each sensor measures acceleration in a single plane, or dimension, of movement (surge, heave, and sway (Figure 2)). All three sensors collecting simultaneous measurements can rep-resent three-dimensional movement realistically [20,23]. The sensors can be user-programmed to sample acceler-ation at frequencies ranging from 0.5 to 10,000 Hz, and can be set to record continuously or in repeated bursts (e.g., every 2 min). The voltage signals, also known as raw accelerometer output, may be used in their raw state, or converted to actual acceleration if the unit is
carefully calibrated (measured ing; 1g= 9.8 m/s2). Under static circumstances, such as during rest or after death, the accelerometer signal only represents the gravitational force acting on the sensors. When an animal is moving, sensor output represents acceleration due to gravity combined with the inertial acceleration generated by movement [23]. Accelerometers typically incorporate a microprocessor and digital memory to store logged measurements until the in-strument is retrieved [24].
Measurement of acceleration is a well-established re-search tool in biomechanics [25,26] and exercise science [27,28]. The first (wired) accelerometers were used to examine the biomechanics of movement in humans [29] and fish [30] and then to ascertain the correlation be-tween bodily acceleration and oxygen consumption in human subjects [28]. The introduction of air-bag tech-nology in passenger vehicles lead to the development of relatively inexpensive accelerometers that use very little power [31]. These were quickly adopted for studies out-side the laboratory environment, because they are“small, low-cost instruments that provide quantitative [and ob-jective] measurements [of activity]”p. 679, [32]. Animal studies using these modern, truly portable acceleration sensors did not appear in the literature until the late 1990s [33,34]. Initially, animal studies were confined to captive and domesticated species, as well as aquatic taxa, for whom few other behavioral observation methods were possible [12,35,36]. Since then, the ongoing reduction in the size of computer microprocessors and improve-ments in battery size, weight, and longevity combined with these small solid-state acceleration sensors have resulted in a modern accelerometer that can weigh 0.7 g (without a battery) and measure 9.5 × 15 × 4 mm (available from: http://www.technosmart.eu/axy.php). Modern accelerome-ters also consume very little digital memory with each measurement [37], so data collection and data storage on-board the instrument itself is possible for up to several months or years, depending on the sampling schedule. Ac-celerometers that simply log their data must be retrieved after the sampling period, as with other types of telemetric data loggers. However, some accelerometers incorporate ultra-high frequency data download technology in similar frequency bandwidths as those used in cellular phones [38]. This feature makes it possible to download the data from the accelerometer from a reasonable distance (up to 500 m, personal observation) even if the device and its bearer are not visible or the instrument cannot be re-trieved because it has been discarded in a tree cavity, for example [21]. Radio or acoustic beacons are commonly used on loggers that must be retrieved [21,24].
Movement is the fundamental behavioral response to both internal motivations and the external environment [13,17]. Using accelerometers, biologists can measure the movement behavior of wild animals over biologically and Figure 1Primary papers using accelerometers in animal
behavior research 1998–2012.
ecologically significant events and periods, practically un-limited by visibility, observer bias, or geographic scale. Ac-celerometers can be deployed with other sensors, such as those recording location (GPS, acoustic telemetry, water depth), physiological measurements (heart rate, body tem-perature), and environmental variables like air temperature, light levels and magnetic heading [24,39,40]. Particularly when combined with other instruments, measurements of acceleration can provide a wide range of detailed informa-tion on the environmental context of animal behavior and physiology that can exceed the descriptive abilities of the human observer and deepen our knowledge even for well-known species such as domestic animals. Here, we review how accelerometers have been used to date in the study of animal behavior, including the taxonomic and research trends in the literature and we illustrate the type of data produced by this technology from instruments deployed on a variety of species. Further, we provide a summary of the currently available techniques for data calibration, management and analysis, and suggest key directions for future research.
Methods
We accessed BIOSIS® Previews and ISI Web of Know-ledge® online and ran searches for any publication contain-ing references to accelerometry in the title, abstract or keywords. We limited our analysis to primary research published in peer-reviewed journals and book chapters through December 2012. From those, we selected studies utilizing animal-borne sensors applied to non-human spe-cies. We assessed the resulting works for the following: i) study purpose; ii) species and whether subjects were cap-tive/domestic or free-ranging, and aquatic or terrestrial; iii) number of acceleration axes; iv) sampling frequency utilized; v) the behavioral resolution of the resulting mea-surements; vi) the parameters of the accelerometer data used for analysis; vii) whether or not behavioral classifica-tion accuracy was reported (if pertinent); and viii) whether accelerometry was combined with other telemetry sensors. Results are presented as percentages; not all percentages will sum to 100 because not all categories were mutually exclusive.
Results
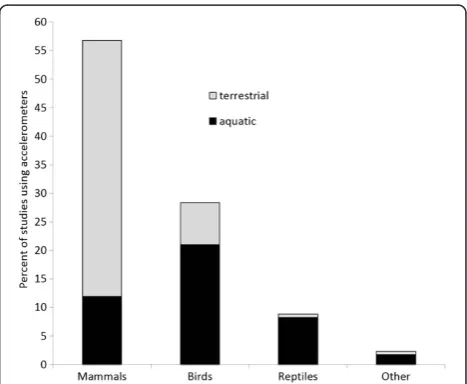
We discovered 176 accelerometry studies and counted 125 animal species that have borne accelerometers (Additional file 1). Studies were relatively evenly split between aquatic (48.3%) and terrestrial (52.8%) habitats and between free-ranging wild animals (50%) and domesticated/captive wild animals (33/27.3%), but there were biases among taxa for these categories (Figures 3 and 4). Mammals represented 45.6% of all study species with domestic cattle and Pinni-peds being the most-studied among the mammals (14% of studies and 18% of species, respectively). Birds comprised
33.6% of all study species and 38% of avian species were ei-ther Sphenisciformes or Suliformes. Fishes included 11.2% of species and half of all fish species were Elasmobranch sharks. Eight reptile species, five of them Chelonians, com-prised 6.4% of study subjects. Giant cuttlefish (Sepia apama), Humboldt squid (Dosidicus gigas), King scallop (Pecten maximus) and Cane toad (Bufo marinus) were the four study species remaining outside of these four taxon categories.
More than half of all studies (62.3%) utilized 3-axis ac-celerometers; 90.3% of studies utilized either 2- or 3-axis accelerometers. Sampling frequencies ranged from 0.5 Hz to 10,000 Hz, with 60% of studies using one of the follow-ing most common samplfollow-ing frequencies of 8, 10, 16, 32, 64 or 100 Hz. Forty-eight percent of studies collected Figure 3Accelerometry studies performed on wild free-ranging animals compared to domestic/captive animals by taxon.
acceleration data continuously and 13.3% collected data in discrete bursts or intervals; 38.7% of studies did not clearly report their collection method. Sixty-three percent of stud-ies combined an accelerometer with other telemetric in-struments; however, free-ranging wild species were 3 times more likely than captive wild species and 6 times more likely than domesticated species to be outfitted with telem-etry devices that contained multiple sensors. The most common remote sensors used in tandem with accelerome-ters measured depth (35.6% of studies), travel speed (16% of studies) and temperature (14.7% of studies).
Survey of questions currently served by accelerometry: body posture and body movement
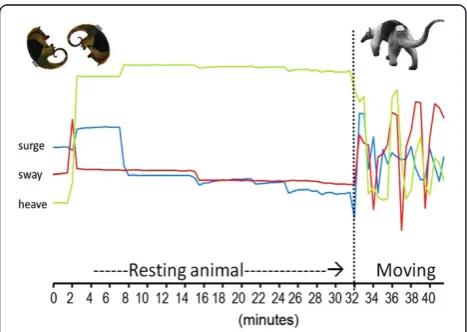
The acceleration waveforms over short (millisecond) to long (minutes) periods can be used to deduce behavior-specific body postures and body movements (Figures 5 and 6) [41,42]. Across taxa, 36.4% of studies reported ac-celeration ethograms or acac-celeration-based descriptions of behavior. Just under half (46.6%) of all studies utilized the accelerometer waveforms to determine activity budgets. As shown graphically in Figure 5, accelerometer voltage output of inactive or rest behavior is more or less constant, while whole-body movement of any kind produces fluctuat-ing acceleration waveforms with high levels of variance among measurements. Of the studies examining activity budgets, 35% of authors used this variance characteristic of accelerometer waveforms to simply identify the timing of activity vs. rest [43-46]. Sixty-five percent of authors identi-fied distinct waveforms for specific behaviors and then esti-mated the amount of time animals spent engaged in these behaviors such as chasing prey or feeding, flight, swimming,
walking, running, climbing, standing, lying down, thermo-regulation and sleeping. Quantifying foraging effort is an application of accelerometry that few other telemetry tech-nologies can accomplish and is particularly useful for ani-mals that forage or hunt out of sight. Researchers have documented foraging strategies that differ by species, age or sex [47-52]. Other studies placed accelerometer sensors on the head/mandible to directly measure attempts at food capture [53], although foraging effort did not necessarily correlate with foraging success [54]. There are several methods for identifying and categorizing waveforms that represent specific behaviors (see ‘Best Practices’, below). On average, these studies were able to identify four distinct acceleration waveform profiles (range 2 to 7), typically fall-ing under the broad behavioral categories of locomotion, resting, and feeding/foraging [55-57]. In general, while the accelerometer patterns of active locomotory behaviors (walking, running, climbing, swimming and flying) are clearly distinguishable from inactive behaviors such as sleep, thermoregulation and digestion, the waveforms of these types of relatively immobile behaviors are not par-ticularly distinct from one another [19].
When an accelerometer is combined with other sen-sors on a tagged animal, researchers can describe the broader ecological context of accelerometer-determined behaviors. Light level and ambient temperature sensors in tandem with accelerometry permit examination of activ-ity timing in relation to environmental conditions [58-61]. Accelerometers and remotely-sensed location via GPS, compass, depth or acoustic sensors provide the spatial dis-tributions of accelerometer-determined behaviors [62-66] and can lead to novel insights about species’ behavioral ecology. For example, traditional observation-only research of the little-known oilbird (Steatornis caripensis) led to the hypothesis that these nocturnal frugivorous birds were not seed dispersers because the seeds from their diet were re-gurgitated in the dark caves where the birds roost. Holland Figure 5Accelerometer-based determination of body posture
and the timing of rest vs. activity.Data are from a study of the northern tamandua anteaterTamandua mexicana[21]. Acceleration was sampled at 19 Hz for ~3 seconds every 2 min. For simplicity, the y-axis is not shown and waveforms represent the average voltage measured every 2 min for each axis.
et al. [38] determined that oilbirds outfitted with GPS/ac-celeration loggers spent only every third day in caves, otherwise remaining in the rainforest where they regurgi-tated seeds onto the forest floor at considerable distances from both feeding sites and cave roosts. The authors main-tained that oilbirds should be reconsidered as an important long-distance seed disperser in Neotropical forests, a novel hypothesis for the ecology of that ecosystem.
Behavioral analysis applied to monitor animal welfare was a significant component of accelerometry research on terrestrial animals; 80% of the terrestrial studies (and 25% of all studies) examined the welfare of domesticated species. Typically, authors used accelerometry to monitor behavioral changes associated with reproduction [67,68] or behavioral responses to veterinary or husbandry prac-tices [69-74]. In studying welfare of free-ranging wild spe-cies, mortality sensors are a common feature of telemeters and typically provide a special signal to alert researchers to the animal’s demise [75]. The advantage of using accel-erometers to detect mortality is that it includes a record of behavior leading up to the time of death, providing a richer context that a simple location and time of death often do not. For example, Kroneet al. [76] were able to identify a change in activity and, ultimately, the moment of death, due to toxin exposure in a white-tailed sea eagle (Haliaeetus albicilla).
What is largely absent from this body of 82 articles about activity budgets is the measurement of social behav-iors. While numerous studies compared behavior budgets during particular reproductive states and reported etho-grams for brooding or nest preparation [52,57,66,77-81], only two studies examined whether mating behavior had a characteristic acceleration profile [82,83]. The scarcity of published accelerometry ethograms for aggressive interac-tions, territorial or courtship displays, and play and parent-offspring behavior [84,85] could be because these social behaviors were generally rare in the majority of the species that have been studied, the acceleration waveforms of social behaviors were indistinguishable from those of non-social behaviors, or because it was not feasible to tag multiple animals in the same group. Inter-individual tel-emetry, with animals bearing tags that are able to record the date and time of proximity to other tagged animals has recently been reported for acoustic transmitters [86]. The application of accelerometers to studies of social be-havior would benefit mightily from accelerometer tags that have the ability to record proximity, identity or even behavior of tagged individuals in contact with the animal that bears the primary tag.
Survey of questions currently served by accelerometry: biomechanics and the energetics of movement
Energetics have long been of interest to behavioral ecolo-gists [87,88] because all movements require energy, and
prudent allocation of energy to specific activities such as foraging has direct consequences for fitness and natural selection [77,89,90]. Prior to the recent developments in accelerometry, measuring energy expenditure in wild ani-mals in the field involved doubly-labeled water or heart rate telemetry, both of which have logistical limitations that have restricted their use [91,92]. Accelerometer technology has dramatically advanced our understanding of the role of energy in behavioral strategies by making it possible to study fine-scale, behavior-specific energy expenditure out-side the laboratory in diverse taxa [93]. Wilson and Halsey et al. have tested for correlations between bodily acceler-ation and oxygen consumed (assuming at least predomin-antly aerobic metabolic pathways) across a wide range of species from aquatic mammals [94,95], birds [64,77,96-99], fishes [100,101], reptiles [52,102-104] and a bivalve [105], to terrestrial mammals, birds [56,106-108] and one am-phibian [109]. Although the strength of the relationship be-tween bodily acceleration and oxygen consumption (as a proxy for metabolic rate) varies and depends on a number of factors, the relationship is valid across all species exam-ined to date [110]. Wilson’s metric‘Overall Dynamic Body Acceleration’ (ODBA) [77] has become the most com-monly used acceleration-based proxy of metabolic rate (en-ergy expenditure) and several articles have been devoted to standardizing this proxy or variants of it [19,106,110-112]. The current available research indicates that bodily acceler-ation can qualitatively assess how the amount of mechan-ical work performed by the body differs among active locomotive behaviors, a distinct improvement on older techniques that were not behavior-specific (Figure 7) [110]. Seventy-three articles applied accelerometry to bio-mechanical research (42.7% of all articles examined). A small minority of these studies (7), eschewed applications to metabolism and instead remained within the traditional realm of evaluating performance: running in racehorses [113-117], swimming in sea snakes [118], and flight in Procellariform sea birds [119]. The remaining 90% of arti-cles focused on energy efficiency during locomotion for travel or foraging [31,35,94,120-124]. In order to better understand the selection pressures on current patterns of locomotor behavior, researchers compared movement en-ergetics across species, movement strategies, demographic classes and behaviors [42,48,102,107,122-127].
[109]. Battery size and weight still mostly preclude accel-erometry energetics studies of the smallest wild mammals (particularly bats) and birds. A further limitation is that ac-celerometers do not appear to be a particularly good proxy of energy expended during immobile but still energetically costly behaviors such as thermoregulation or gestation [107,135].
Potential application of accelerometry: position and location
Acceleration measurements can be used to derive animal speed, which, together with compass and depth/altitudinal information, could be used to ‘dead-reckon’ an animal’s position. There are several existing methods for locating animals in space and time including radio telemetry [136], satellite or geographic positioning systems [11,137,138] and acoustic arrays [139]. None of these methods works for all species and habitats and, consequently, travel paths are frequently reconstructed by bridging sporadic points and have low spatio-temporal resolution [140,141].
Dead-reckoning (also known as path integration) uses vector calculations from velocity and the change in height or depth together with a known start position (usually the animal release point) to derive new positions with respect to those previously known [24,142]. Locations obtained by dead-reckoning, therefore, are not subject to the same con-straints of receiver location or satellite access and represent an alternative method for studying movement paths when radio- or satellite-based telemetry methods are unsuitable. Dead-reckoning uses sensors on-board the telemetry tag that record heading/direction (usually measured with mag-netometers), altitude or depth (usually measured with pres-sure sensors), and speed. In theory, speed can be calculated by taking the derivative of acceleration over a known time interval [130] or by using a known stride length and the accelerometer-measured stride frequency [142]. However, speed determined in this way can be subject to large errors due to variation in slope and substrate during travel [67,139]. These errors are particularly unpredictable in
aquatic or volant species, due to drift caused by water and wind currents rather than animal locomotion [142]. In terrestrial systems, terrain incline and substrate impact stride length, affect speed calculations and consequently the determination of distance moved. Furthermore, these errors accumulate over time, making location estimates increasingly worse further from the last known location. Because of these problems, dead-reckoning from accele-rometry data has been used infrequently and most researchers interested in movement speed have added separate speed sensors (small external propellers) to the telemetry tags [24,137,141-144]. As GPS technology becomes more widely integrated into accelerometer tags, the greatest potential for dead-reckoned animal location comes in recreating the exact travel path between subsequent GPS locations collected at short intervals e.g., <15 min [24,139].
Best practices in data acquisition and data analysis: tag attachment and tandem sensors
independent of the animal (by a collar bouncing up and down on the neck, for example) is kept to a minimum [111]. For species that must wear collars or bracelets, a completely rigid attachment is not possible unless the col-lar can be prevented from turning around the neck/leg [55], which may present a welfare concern for free-ranging animals. For some questions, for example the timing of ac-tivity/rest, the requirement of rigid attachment may be re-laxed. Finally, accelerometer tags can also be deployed inside the body cavity of some species [61,148], which may reduce concerns about tag movements that are irrelevant to the research question. Internal deployments may pro-vide the advantage of recording accelerations due to physiological processes such as heartbeat and movements of smooth muscle during digestion [148], but can also have the disadvantage of necessitating surgical procedures for tag deployment and retrieval/removal, which can affect animal behavior and well-being.
The orientation of axes is typically placed so that the surge axis is aligned with the longitudinal body axis and sway with the horizontal body axis (Figure 2) [20]. Ensuring that tag position is as similar as possible between individ-uals, especially those of very different body sizes, improves the signal-to-noise ratio of the accelerometer output and minimizes errors in interpretation [20,63,101,131]. Beyond its orientation on the body, the specific anatomical location of the attached accelerometer tag largely determines, what behaviors can be distinguished by their accelerometry pat-terns. Both species morphology and tag placement will de-termine the number and type of behaviors with distinct acceleration profiles [44]. For example, tags attached to an animal’s back, as in Figure 2 [38,109], will not provide ac-celeration patterns of fine-scale feeding behaviors that only involve movement of the mouth. On the other hand, accel-erations of chewing movements may be detectable with neck collars [33,55]. In humans, it has been well established that precise accelerometer-based descriptions of full-body movement require at least five acceleration sensors, one mounted on the trunk of the body and one on each ex-tremity [26]. Studies of free-ranging wild animal are typic-ally limited to one telemetry tag per individual; however, multiple accelerometer instruments have been used on do-mesticated animals [149-152] and in a handful of wild mar-ine species [53,54,153-157], improving the precision of behavior measurements.
Even when contained in a single tag, most modern ac-celerometers are combined with other types of sensors to enhance the amount of information collected simul-taneously from the environment, such as light, air/water pressure, external air/water temperature, relative humidity and magnetic field [24], as well as from the animal, such as body temperature, heart rate and mouth/jaw move-ments [79,99,101,133,134,157-160]. In modern telemetry tags, each of these data sensors, including each axis of the
accelerometer, have their own separate channels for data re-cording, so that accelerometer data are collected independ-ently of other information like GPS [24,160]. As a result, even if one sensor malfunctions or cannot acquire informa-tion momentarily (for example, the GPS unit spends several minutes attempting to access satellites and obtain a loca-tion), the other sensors continue to record data on sched-ule. In some tags, the activity levels of the animal as determined by the accelerometer can be used to set the re-cording schedules of other sensors dynamically. For ex-ample, the GPS schedule is set to acquire locations more frequently during active behaviors such as foraging and travel and less frequently during rest, improving the overall performance and battery longevity of the telemeter [21].
Best practices in data acquisition and data analysis: sampling axes, sampling interval and sampling frequency Sampling of all three axes of acceleration (tri-axial) is the most accurate and precise way of measuring behav-ior that occurs in three dimensions as well as estimating energy expenditure [20,161]. For some research ques-tions or for relatively immobile species, one or two axes may be sufficient to characterize the behavior(s) of inter-est [23,80]. However, the efficiency of modern acceler-ometer sensors mean that little is gained, in terms of battery life, by using fewer axes.
interval) as long as the entire sampling period matches de-vice storage capacity, or there is periodic offloading of data via mobile receivers such as satellites.
Generally, the smaller the subject, the faster the move-ment and the higher the sampling frequency necessary to accurately characterize the pattern of acceleration [98,123,137]. From signal processing theory we have the rule-of-thumb that for adequate reconstruction of a con-tinuous waveform such as acceleration, the sampling fre-quency ought to be at least twice that of the highest frequency movement being classified [162]. Sato et al. [123] measured the dominant stroke frequencies for sev-eral species of aquatic birds and marine mammals and they ranged from 0.2 Hz for sperm whales to 9.3 Hz in guillemots. Meanwhile, the three most common sampling frequencies in the literature were 10, 16, and 32 Hz but there was little a priori justification for the choice of sam-pling frequency. Halsey et al. found that accelerometer-sampling frequencies of 2 to 10 Hz were adequate for characterizing energy expenditure in chickens [19]. These studies suggest that sampling frequencies higher than 50 to 60 Hz are probably unnecessary for most research questions and that in such cases the additional data gener-ated is wasteful of digital storage space. However, authors recommended that the research question and desired tempo-spatial resolution of the data should ultimately dic-tate the sampling frequency (and sampling interval) [19].
Best practices in accelerometer data analysis: describing the waveforms
For both continuous and burst sampling schemes, irre-spective of sampling frequency, acceleration sensors pro-duce raw data in a wave-like signal with units in voltage. Prior to analysis, researchers may use calibration equations to convert this signal into actual acceleration measured in m/s2orgunits where 1g= 9.80665 m/s2[57,127,154,159]. This calibration and conversion may be required for mea-suring the actual biomechanical forces experienced by ani-mals during different movements, for example, the air to water transition for a diving seabird, or the strike force on horses’hooves when running. The dynamic body acceler-ation metrics also use the signal converted to acceleracceler-ation as the proxy for metabolic exertion [96]. Alternatively, for simple acceleration ethograms or determining activity budgets, the signal may be used in the raw voltage state as depicted in Figure 6.
To describe the acceleration waveform patterns, re-searchers then calculate a wide variety of summary statistics using each burst’s population of values or subsamples of the continuous measurements (Table 1). The statistics listed in Table 1 could be calculated for each axis individually or combined to represent multiple axes simultaneously [149].
There is a dichotomy in the literature on how re-searchers process and describe the wave-like properties
of accelerometer output. Some researchers have uti-lized simple waveform statistics, such as the number of peaks (frequency of the movement), the mean value of the waveform (body angle), and their variances [23,35,121,131,146,160]. Others have used specialized pro-grams to perform complex analyses on the waveforms, resulting in a large number of additional descriptive sta-tistics [34,46,55,127,130,144,156,161,165]. There are nu-merous complex techniques for analyzing data that, like acceleration, exist in a time series [167,168]. The most commonly used method with accelerometer data is the fast Fourier transformation. Fourier transformations iden-tify the individual frequencies that are present in the raw acceleration waveform and determine the power spectral densities of those frequencies, i.e., how much of the total signal is present in each frequency [162]. Another com-plex approach is continuous wavelet transformation, which identifies not only which frequencies are present, but also Table 1 Statistics used to describe acceleration
waveforms
Summary statistic Representative
source(s)
Mean [20,23,38]
Running mean for continuous data [107,111]
Minimum, Maximum, Range [125,130,163]
Variance [23,36,112]
Standard deviation
Inverse coefficient of variation [62,112]
Resultant
Overall dynamic body acceleration [79,103]
Vector dynamic body acceleration [112]
Subsequent-measurement autocorrelation [62]
Trend (linear regression coefficient through axis data)
Pair-wise correlations between axes data
Inclination, azimuth of resultant and their circular variances
Frequency power spectrum
Fast Fourier transformation [43,48,57,126,129]
Continuous wavelet transformation
[164]
Δacceleration [20]
Δfrequency
Waveform frequency [43,130]
Waveform period and amplitude [32,164]
Area under the waveform curve [163]
Skewness and kurtosis of the waveform [165]
Signal magnitude area [166]
Waveform length
when during the signal they are present [164]. Shepard et al. [20] and Laichet al. [23] suggest that these complex analyses are not essential and that simpler statistics are both intuitively and practically more accessible for the broadest range of potential users. However, they acknowl-edged that when behaviors “are transitory and/or highly variable”p. 36 [23], or are measured using only one axis of acceleration, the more complicated techniques and the additional statistics they provide may prove helpful for identifying or distinguishing different behaviors.
Data filters for separating gravitational acceleration from inertial acceleration
Recall that the accelerometer waveform output during movement is a combination of acceleration due to grav-ity and inertial acceleration due to animal movement (dynamic acceleration). When isolated, gravitational ac-celeration can be used to determine the orientation of the body in space (posture or body angle) [23,55,57]. The gravitational component can be isolated by: i) applying a low-pass filter such as 0.1 Hz that removes high frequency acceleration [41,78,79,121,164]; or ii) by smoothing (i.e., calculating a running mean) over a large set of measure-ments [57]. For acceleration sampled over a few seconds in a burst, taking the mean value of a single burst’s measure-ments can suffice for isolating momentary gravitational ac-celeration, or body angle [21]. One can see how this works in Figure 5; note the relatively flat slope of voltage output for all three axes when the animal is more or less motion-less (left side designated‘resting’). Between minutes 2 and 4, the mean value of the heave axis shifts dramatically as the animal changed position during rest from a ‘feet-up’ posture to a‘feet-down’posture. The change in the mean value of the heave axis represents a change in voltage out-put stimulated by gravitational acceleration after the tag (the animal) changed orientation. Determining exact body angle requires calibration of accelerometer voltage output as the tag is passed through 360 degrees along each axis. Using this method, researchers calculated body “pitch” angle from the heave or surge axes and body “roll” angle from the sway axis, also correcting for the position of the tag on the animal [41,163].
Conversely, researchers used high-pass filters to examine accelerations due to movement in isolation from the gravi-tational component of acceleration [63,159]. This dynamic component was used to calculate the measures of dynamic body acceleration in the majority of the studies on energet-ics [19,20,24,77,97,107,109,111,142,159]. Frequency filters were also used to reduce the noise in the acceleration signal created by non-rigid attachments of accelerometer collars [31] and to isolate the pattern of one particular type of dy-namic behavior that occurred simultaneously with other movements, namely prey capture events during swimming [155,156]. Spectral and other waveform analyses discussed
in the previous section are often conducted on dynamic ac-celeration after its isolation by high-pass frequency filtering.
Best practices in accelerometer data analysis: validation and assigning characteristic waveforms to behavior The advantage of accelerometers is that they provide a remotely collected record of behavior: large sets of accel-eration waveforms that were mostly not observed by the human eye. To understand how the acceleration record and the statistical properties of the waveforms relate to observable behavior, researchers using this tool must have a way of assigning the waveforms to specific behaviors or behavioral categories with a high degree of accuracy (valid-ation). This task requires some prior knowledge of the be-haviors animals perform and studies, to date, have generally obtained this information from deployments on similar do-mesticated animals, captive individuals and brief periods of observation on free-ranging wild animals, some via video [36]. Carefully synchronized observations and accelerom-eter recordings validate what behaviors correspond to what accelerometer measurements, for example, the relatively flat waveforms that occur during rest compared to the vari-able waveforms that occur during activity (Figure 5). This process also must quantify to what extent accelerometer waveforms for the same behavior vary within an individual, or between individuals or species [19,109]. This validation process is a critically important part of using accelerome-ters. The accuracy of the conclusions drawn from assigning behaviors or energy expenditures to accelerometer wave-forms depend enormously on the accuracy of the assign-ments (see discussion below on methods reporting).
This fact notwithstanding, wild animals, particularly aquatic species, may not be observed at all between re-lease and tag recovery [42]. Even when animals are being observed directly, it is hard to be certain that all possible relevant behaviors have been witnessed [169], especially when extrapolating behavior in captivity to behavior in the wild. As accelerometry has matured, researchers have developed special software tools to address this obstacle and reduce the time and labor necessary for direct ob-servation [164,170]. With knowledge of i) general body shape, ii) form of locomotion (bipedal, quadrupedal, etc.), and iii) how the tag is attached to the body, these software programs can help researchers visualize the movement of their study animals according to the accelerometer signals recorded during tag deployment [170].
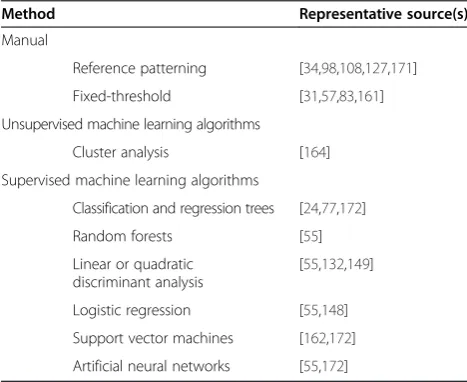
algorithms to cluster accelerometer waveforms with simi-lar characteristics and then assign each cluster to a general behavioral group [163]. For example, Sakamoto et al. [164] used an unsupervised k-means clustering algorithm to assign accelerometer waveforms from a diving seabird to 20 different groups, which they matched to simultan-eously recorded depth profiles and then labeled with dif-ferent behavior groups including ‘in flight’, ‘underwater diving’ and ‘on land’. The second, more common ap-proach is to use the accelerometer waveforms generated from known (observed) behaviors of similar domesticated or captive individuals to train an algorithm that will assign the remaining waveforms in the dataset to those specific behavioral categories. For example, Nathanet al. [56] ob-served wild and captive vultures exhibit a variety of be-haviors while wearing accelerometer tags and then used various supervised statistical algorithms to categorize the accelerometer waveforms as either active flight, pas-sive flight (soaring-gliding), eating, lying down, preening, standing or running. Both methods lessen the burdens of extended direct observations and manual analysis of accel-erometer data, however, the former has the potential to detect previously unknown or unobserved behaviors and behavioral sequences while the latter has the advantage that behavioral categories correspond directly to observa-tions. Both rely on the validation process for accurate con-clusions. Table 2 summarizes the assignment methods and algorithms represented in the literature; Nathanet al. [56] reviews and compares several of the supervised algo-rithms in detail.
Regardless of the method used to assign accelerometer waveforms to behaviors, each group of researchers de-velops its own set of waveform statistics to feed to what are largely custom-designed automatic classification sys-tems. Algorithms that deal with one particular domain
of activities (e.g., diving in aquatic animals) may not be easily adapted for a different environment or different set of movements [32]. Furthermore, 58% of scientists working with domestic species and 47.6% of those work-ing with captive wild species reported the performance and reliability of their chosen automated classification systems [55,72], while only 9.1% of those studying wild species did so [23,44,57,83]. Lack of methods reporting, from the accelerometer-recording schedule to whether and how accelerometer data is validated, stymies direct comparisons between studies and between analytical ap-proaches. As previously discussed, validation is an essen-tial part of using accelerometer as a stand-in for direct observation. If accelerometers are to achieve widespread use in studies of free-ranging wild species, there will have to be more complete reporting of methods, particu-larly for the classification phase of analysis.
Best practices in accelerometer data analysis: data visualization and storage
We noted earlier that the high resolution of accelerometry results in a large volume of data accumulating over a short period. For example, a single-axis accelerometer tag re-cording continuously at 8 Hz for 8 hours and 40 minutes resulted in 249,988 measurements [170]. When combined with the data from sensors deployed in tandem with tri-axial accelerometry, such as GPS, depth, or temperature telemeters, the dataset in its entirety can easily over-whelm basic spreadsheet and statistical programs and it becomes difficult to visualize more than one data stream at a time. ‘Igor Pro’ (WaveMetrics, Lake Oswego, OR, USA),‘R’(R Foundation for Statistical Computing, Vienna, Austria) and‘Matlab’(MathWorks, Natick, MA, USA) are commonly used for acceleration data analysis and can han-dle large datasets [83,164,165], although all three programs have a considerable learning curve. We are aware of two web-based options geared towards animal-borne telemeter data visualization, storage and analysis. MOVEBANK (available at https://www.movebank.org/) is a free, online database of animal tracking data that helps researchers to manage, selectively share, protect, analyze and archive their data. WithMOVEBANK,researchers can link animal behavior from accelerometer data with animal location data from GPS and information from global environmen-tal datasets, such as weather models and satellite imagery, making it easier to explore how animals’movements relate to their environment. Gaoet al. presented another online accelerometer data storage and analysis system, the Semantic Annotation and Activity Recognition system [166]. Their interactive web interface enables ecologists to visualize and correlate tri-axial accelerometer data streams while also facilitating accelerometer data analysis with a support vector machine classification algorithm. A major benefit to using these web-based repositories is that the Table 2 Methods for assigning accelerometer waveforms
to behavioral categories based on waveform statistics
Method Representative source(s)
Manual
Reference patterning [34,98,108,127,171]
Fixed-threshold [31,57,83,161]
Unsupervised machine learning algorithms
Cluster analysis [164]
Supervised machine learning algorithms
Classification and regression trees [24,77,172]
Random forests [55]
Linear or quadratic discriminant analysis
[55,132,149]
Logistic regression [55,148]
Support vector machines [162,172]
average biologist tracking a handful of animals gets access to collaborations with other biologists, statisticians, engi-neers and computer programmers who can collectively continue to develop this tool and the hardware and soft-ware that make the most of accelerometry’s potential.
Conclusions and future directions
Accelerometry is a tool for fine-scale observations of be-havior, unlimited by animal visibility, terrain, climate, observer bias or the scale of space use. To date, acceler-ometer tags have been applied to more than 120 species in diverse taxa in order to deduce body postures, behav-iors and energetics in the field. Accelerometry also shows potential as a method to‘dead reckon’ an animal’s exact travel path when applied in tandem with satellite-based lo-cation systems. In all of the research described, accelero-metry provided fine-scale behavioral measurements that, prior to its development, were rarely attainable outside of the laboratory setting and without the influence of the re-searchers’presence.
The literature shows several taxonomic biases in what research questions have been examined and how the re-sults have been reported. Studies of wild aquatic species outnumber studies of wild terrestrial species. Research on aquatic animals (whether captive or wild) has focused on describing the biomechanics and energetic consequences of behavior, while in terrestrial systems the focus was on determining activity budgets. Both at sea and on land, feeding, locomotion, and activity/rest were the behavior categories most frequently analyzed; social behaviors (par-ental care, territorial, mating and courtship behaviors, and antagonistic exchanges) are nearly absent from both etho-grams and energy budgets. Researchers of domestic and captive species tended to report analysis methods more thoroughly than those studying species in the wild.
There are substantial challenges to getting the most out of accelerometer data, including device retrieval and data calibration, validation, management and analysis. Nu-merous techniques for addressing these challenges have already been published in both human and animal studies and new methods continue to develop and are awaiting broad application to the field. With more thorough re-porting of methodology and habitual use of web-based data repositories, universal practices are bound to emerge as hardware and software continues to mature and be-come more broadly available across research groups.
Future directions
The rapid development of this tool in the field, thus far, leads us to anticipate two promising breakthrough applica-tions that will open even more doors in behavioral research. The first is the incorporation of inter-individual telemeters in the study of social behavior. Device-to-device data shar-ing and proximity sensors exist in the consumer electronics
industry and have already been incorporated into acoustic telemeters [86]. Most modern telemetry tags have multiple data channels and could be modified to include these fea-tures. Accelerometer tags that have the ability to record proximity, identity and even behavior of tagged individuals in contact with the animal that bears the primary tag, would reduce the burden of extensive direct observation, yet permit scientists to directly question how individuals interact and how those interactions shape behavior across a large number of social and territorial species. Secondly, we recommend that researchers entering the field of wildlife telemetry look to explicitly link energetic expenditure in wild animals with behavioral responses to human-altered habitats [163]. Whether considering climate change, re-source competition or anti-predator defenses, the potential toll on fitness should manifest in energetic expenditure and allow a window onto the longer-term consequences of our impacts on other long-lived species. Accelerometry of-fers a level of detail in behavioral studies of free-ranging wild animals that has previously been impossible to achieve and it has proven itself in furthering our understanding of the role of behavioral mechanisms in ecological and evolu-tionary processes.
Additional file
Additional file 1:Spreadsheet of all studies analyzed for this review.Column headings indicate the information taken from the study, studies are listed in rows by first author.
Competing interests
APK, MW, and RW are on the editorial board ofAnimal Biotelemetry. The authors declare that they have no other competing interests.
Author’s contributions
DB collected the articles used in this review, carried out the data analysis, and drafted the manuscript and Figures 1 to 5. RK initially conceived of the idea to write a review of the subject and heavily influenced the organization of the information. MW, RW, and APK made critical revisions to drafts for comprehensiveness and presentation of the information. All authors read and approved the final manuscript.
Acknowledgements
This review was supported by the New York State Museum; the Max Planck Institute for Ornithology; Swansea University; an NSF predoctoral fellowship (DD Brown) and the Biotelemetry Laboratory at the University of California, Davis. We thank Sebastián Cruz for contributing Figure 6 and Lewis Halsey for permission to reuse his figure (Figure 7) as well as helpful comments on an earlier draft.
Author details
1Department of Biology, Western Kentucky University, 1906 College Heights
Blvd. #11080, Bowling Green, KY 42101-1080, USA.2North Carolina Museum of Natural Sciences, 11 W. Jones Street, Raleigh, NC 27601, USA.3Fisheries, Wildlife & Conservation, North Carolina State University, Raleigh, NC, USA. 4Smithsonian Tropical Research Institute, Apartado 0843-03092, Balboa,
Received: 23 July 2013 Accepted: 7 October 2013 Published: 10 December 2013
References
1. Schneirla TC:The relationship between observation and experimentation in the field study of behavior.Annals NY Acad Sci1950,51:1022–1044. 2. Carpenter CR:A field study of the behavioral and social relations of howling
monkeys (Alouatta palliata).Comp Psychol Monographs1934,10:1–168. 3. Caro TM:Demography and behaviour of African mammals subject to
exploitation.Biol Conserv1999,91:91–97.
4. Maffei L, Noss AJ, Cuéllar E, Rumiz DI:Ocelot (Felis pardalis) population densities, activity, and ranging behaviour in the dry forests of eastern Bolivia: data from camera trapping.J Trop Ecol2005,21:349–353. 5. Chapman FM:Who treads our trails.Nat Geogr Mag1927,52:341–345. 6. Jack KM, Lenz BB, Healan E, Rudman S, Schoof VAM, Fedigan L:The effects
of observer presence on the behavior of Cebus capucinus in Costa Rica. Am J Primatol2008,70:490–494.
7. Crofoot MC, Lambert TD, Kays R, Wikelski MC:Does watching a monkey change its behaviour? Quantifying observer effects in habitutated wild primates using automated radiotelemetry.Anim Behav2010,80:475–480. 8. Isbell LA, Young TP:Human presence reduces predation in a free-ranging
vervet monkey population in Kenya.Anim Behav1993,45:1233–1235. 9. Caine NG:Unrecognized anti-predator behavior can bias observational
data.Anim Behav1990,39:195–197.
10. Martin P, Bateson PPG:Measuring Behaviour.3rd edition. Cambridge: Cambridge University Press; 2007.
11. Cagnacci F, Boitani L, Powell RA, Boyce MS:Animal ecology meets GPS-based radiotelemetry: a perfect storm of opportunities and challenges. Phil Transac Royal Soc B-Biol Sci2010,365:2157–2162.
12. Kooyman GL:Genesis and evolution of bio-logging devices: 1963–2002. Memoirs Nat Inst Polar Res Special Issue2004,58:15–22.
13. Cooke SJ, Hinch SG, Wikelski M, Andrews RD, Kuchel LJ, Wolcott TG, Butler PJ:
Biotelemetry: a mechanistic approach to ecology.Trends Ecol Evol2004,
19:334–343.
14. Altmann J:Observational study of behavior: sampling methods.Behaviour
1974,49:227–267.
15. Hart KM, Hyrenbach KD:Satellite telemetry of marine megavertebrates: the coming of age of an experimental science.Endangered Spec Res2009,
10:9–20.
16. Tomkiewicz SM, Fuller MR, Kie JG, Bates KK:Global positioning system and associated technologies in animal behaviour and ecological research. Philosophical Transac Royal Soc B-Biol Sci2010,365:2163–2176.
17. Fryxell JM, Hazell M, Borger L, Dalziel BD, Haydon DT, Morales JM, McIntosh T, Rosatte RC:Multiple movement modes by large herbivores at multiple spatiotemporal scales.Proc Natl Acad Sci USA2008,105:19114–19119. 18. Aguiar LM, Moro-Rios RF:The direct observational method and possibilities
for Neotropical Carnivores: an invitation for the rescue of a classical method spread over the Primatology.Zoologia2009,26:587–593. 19. Halsey LG, Green JA, Wilson RP, Frappell PB:Accelerometry to estimate
energy expenditure during activity: best practice with data loggers. Physiol Biochem Zool2009,82:396–404.
20. Shepard ELC, Wilson RP, Quintana F, Gomez Laich A, Liebsch N, Albareda DA, Halsey LG, Gleiss A, Morgan DT, Myers AE, Newman C, Macdonald DW:
Identification of animal movement patterns using tri-axial accelerometry. Endangered Spec Res2010,10:47–60.
21. Brown DD, LaPoint S, Kays R, Heidrich W, Kümmeth F, Wikelski M:
Accelerometer-informed GPS telemetry: reducing the trade-Off between resolution and longevity.Wildlife Soc Bull2012,36:139–146.
22. Dow C, Michel KE, Love M, Brown DC:Evaluation of optimal sampling interval for activity monitoring in companion dogs.Am J Vet Res2009,
70:444–448.
23. Laich AG, Wilson RP, Quintana F, Shepard ELC:Identification of imperial cormorant Phalacrocorax atriceps behaviour using accelerometers. Endangered Spec Res2010,10:29–37.
24. Wilson RP, Shepard ELC, Liebsch N:Prying into the intimate details of animal lives: use of a daily diary on animals.Endangered Spec Res2008,
4:123–137.
25. Morris JRW:Accelerometry–A technique for the measurement of human body movements.J Biomech1973,6:729–736.
26. Chen KY, Bassett DR:The technology of accelerometry-based activity monitors: current and future.Med Sci Sports Exer2005,37:S490–S500.
27. Servais SB, Webster JG, Montoye HJ:Estimating human energy expenditure using an accelerometer device.J Clin Eng1984,92:159–171. 28. Meijer GA, Westerterp KR, Koper H, Hoor FT:Assessment of energy
expenditure by recording heart rate and body acceleration. Med Sci Sports Exerc1989,21:343–347.
29. Cavagna G, Saibene F, Margaria R:A three-directional accelerometer for analyzing body movements.J Appl Physiol1961,16:191.
30. Dubois AB, Cavagna GA, Fox RS:Locomotion of bluefish.J Exp Zool1976,
195:223–235.
31. Sellers WI, Crompton RH:Automatic monitoring of primate locomotor behaviour using accelerometers.Folia Primatologia2004,75:279–293. 32. Mathie MJ, Celler BG, Lovell NH, Coster ACF:Classification of basic daily
movements using a triaxial accelerometer.Med Biol Engineer Comp2004,
42:679–687.
33. Scheibe KM, Schleusner T, Berger A, Eichhorn K, Langbein J, Zotto LD, Streich WJ:ETHOSYS (R)–new system for recording and analysis of behaviour of free-ranging domestic animals and wildlife. Appl Anim Behav Sci1998,55:195–211.
34. Sellers WI, Varley JS, Waters SS:Remote monitoring of locomotion using accelerometers: a pilot study.Folia Primatol1998,69:82–85.
35. Yoda K, Sato K, Niizuma Y, Kurita M, Bost CA, Maho YL, Naito Y:Precise monitoring of porpoising behaviour of Adélie penguins determined using acceleration data loggers.J Exp Biol1999,202:3121–3126. 36. Davis RW, Fuiman LA, Williams TM, Collier SO, Hagey WP, Kanatous SB,
Kohin S, Horning M:Hunting behavior of a marine mammal beneath the Antarctic fast ice.Science1999,283:993–996.
37. Kemp B, Janssen AJMW, Van Der Kamp B:Body position can be monitored in 3D using miniature accelerometers and earth-magnetic field sensors. Electroencephalogr Clin Neurophysiol1998,109:484–488.
38. Holland RA, Wikelski M, Kümmeth F, Bosque C:The secret life of oilbirds: New insights into the movement ecology of a unique avian frugivore. PLoS ONE2009,4:e8264.
39. Johnson MP, Tyack PL:A digital acoustic recording tag for measuring the response of wild marine mammals to sound.IEEE J Oceanic Engineer2003,
28:3–12.
40. Murchie KJ, Cooke SJ, Danylchuk AJ, Suski CD:Estimates of field activity and metabolic rates of bonefish (Albula vulpes) in coastal marine habitats using acoustic tri-axial accelerometer transmitters and intermittent-flow respirometry.J Experiment Marine Biol Ecol2011,396:147–155.
41. Sato K, Mitani Y, Cameron MF, Siniff DB, Naito Y:Factors affecting stroking patterns and body angle in diving Weddell seals under natural conditions.J Exp Biol2003,206:1461–1470.
42. Mitani Y, Andrews RD, Sato K, Kato A, Naito Y, Costa DP:Three-dimensional resting behaviour of northern elephant seals: drifting like a falling leaf. Biol Lett2010,6:163–166.
43. van Oort BEH, Tyler NJC, Storeheier PV, Stokkan K-A:The performance and validation of a data logger for long-term determination of activity in free-ranging reindeer, Rangifer tarandus L.App Anim Behav Sci2004,
89:299–308.
44. Gervasi V, Brunberg S, Swenson JE:An individual-based method to measure animal activity levels: a test on Brown Bears.Wildlife Soc Bull
2006,34:1314–1319.
45. Sakamoto Y, Kunisaki T, Sawaguchi I, Aoi T, Harashina K, Deguchi Y:A note on daily movement patterns of a female Asiatic black bear (ursus thibetanus) in a suburban area of Iwate prefecture, northeastern Japan. Mammal Study2009,34:165–170.
46. Whitney NM, Papastamatiou YP, Holland KN, Lowe CG:Use of an acceleration data logger to measure diel activity patterns in captive whitetip reef sharks, Triaenodon obesus.Aquatic Living Res2007,20:299–305. 47. Weimerskirch H, Shaffer SA, Tremblay Y, Costa DP, Gadenne H, Kato A,
Ropert-Coudert Y, Sato K, Aurioles D:Species- and sex-specific differences in foraging behaviour and foraging zones in blue-footed and brown boobies in the Gulf of California.Marine Ecol Prog Ser2009,391:267–278. 48. Laich AG, Quintana F, Shepard ELC, Wilson RP:Intersexual differences in
the diving behaviour of imperial cormorants.J Ornithol2012,153:139–147. 49. Zimmer I, Ropert-Coudert Y, Kato A, Ancel A, Chiaradia A:Does foraging
performance change with Age in female little penguins (eudyptula minor)?PLoS ONE2011,6(1):e16098.
51. Le Vaillant M, Wilson RP, Kato A, Saraux C, Hanuise N, Prud’Homme O, Le Maho Y, Le Bohec C, Ropert-Coudert Y:King penguins adjust their diving behaviour with age.J Experiment Biol2012,215:3685–3692. 52. Fossette S, Schofield G, Lilley MKS, Gleiss AC, Hays GC:Acceleration data
reveal the energy management strategy of a marine ectotherm during reproduction.Functional Ecol2012,26:324–333.
53. Kokubun N, Kim JH, Shin HC, Naito Y, Takahashi A:Penguin head movement detected using small accelerometers: a proxy of prey encounter rate.J Experiment Biol2011,214:3760–3767.
54. Viviant M, Trites AW, Rosen DAS, Monestiez P, Guinet C:Prey capture attempts can be detected in Steller sea lions and other marine predators using accelerometers.Polar Biol2010,33:713–719.
55. Watanabe S, Izawa M, Kato A, Ropert-Coudert Y, Naito Y:A new technique for monitoring the detailed behaviour of terrestrial animals: a case study with the domestic cat.App Anim Behav Sci2005,94:117–131.
56. Nathan R, Spiegel O, Fortmann-Roe S, Harel R, Wikelski M, Getz WM:Using tri-axial acceleration data to identify behavioral modes of free-ranging animals: general concepts and tools illustrated for griffon vultures. J Experiment Biol2012,215:986–996.
57. Yoda K, Naito Y, Sato K, Takahashi A, Nishikawa J, Ropert-Coudert Y, Kurita M, Maho YL:A new technique for monitoring the behavior of free-ranging Adélie penguins.J Experiment Biol2001,204:685–690.
58. Kappeler PM, Erkert HG:On the move around the clock: correlates and determinants of cathemeral activity in wild redfronted lemurs (Eulemur fulvus rufus).Behavioral Ecol Sociobiol2003,54:359–369.
59. Erkert HG, Kappeler PM:Arrived in the light: diel and seasonal activity patterns in wild Verreaux’s sifakas (Propithecus v. verreaux; Primates: Indriidae).Behavioral Ecol Sociobiol2004,57:174–186.
60. Gilly WF, Zeidberg LD, Booth JAT, Stewart JS, Marshall G, Abernathy K, Bell LE:
Locomotion and behavior of Humboldt squid, dosidicus gigas, in relation to natural hypoxia in the gulf of California, Mexico.J Experiment Biol2012,
215:3175–3190.
61. Baras E, Togola B, Sicard B, Benech V:Behaviour of tigerfish Hydrocynus brevis in the River Niger, Mali, as revealed by simultaneous telemetry of activity and swimming depth.Hydrobiologia2002,483:103–110. 62. Moreau M, Siebert S, Buerkert A, Schlecht E:Use of a tri-axial accelerometer
for automated recording and classification of goats’grazing behaviour. App Anim Behav Sci2009,119:158–170.
63. O’Toole AC, Murchie KJ, Pullen C, Hanson KC, Suski CD, Danylchuk AJ, Cooke SJ:Locomotory activity and depth distribution of adult great barracuda (Sphyraena barracuda) in Bahamian coastal habitats determined using acceleration and pressure biotelemetry transmitters. Marine Freshwater Res2010,61:1446–1456.
64. Wilson RP, Quintana F, Hobson VJ:Construction of energy landscapes can clarify the movement and distribution of foraging animals.
Proc Roy Soc B-Biol Sci2012,279:975–980.
65. Kays R, Jansen PA, Knecht EMH, Vohwinkel R, Wikelski M:The effect of feeding time on dispersal of Virola seeds by toucans determined from GPS tracking and accelerometers.Acta Oecologica-Int J Ecol2011,37:625–631. 66. Ropert-Coudert Y, Gremillet D, Kato A, Ryan PG, Naito Y, Maho YL:A fine-scale time budget of Cape gannets provides insights into the foraging strategies of coastal seabirds.Anim Behav2004,67:985–992.
67. Rothwell ES, Bercovitch FB, Andrews JRM, Anderson MJ:Estimating daily walking distance of captive African elephants using an accelerometer. Zoo Biol2011,30:579–591.
68. Takahashi M, Tobey JR, Pisacane CB, Andrus CH:Evaluating the utility of an accelerometer and urinary hormone analysis as indicators of estrus in a Zoo-housed koala (phascolarctos cinereus).Zoo Biol2009,28:59–68. 69. Thierman JL, Crowe TG, Stookey JM, Valentine B:Quantification of the
response of elk during velvet antler removal.Can Agri Engineer1999,
41:223–237.
70. Berger A, Scheibe K-M, Michaelis S, Streich WJ:Evaluation of living condi-tions of free-ranging animals by automated chronobiological analysis of behavior.Behav Rese Methods Instr Comp2003,35:458–466.
71. Schaer BLD, Ryan CT, Boston RC, Nunamaker DM:The horse-racetrack interface: a preliminary study on the effect of shoeing on impact trauma using a novel wireless data acquisition system.Equine Vet J2006,
38:664–670.
72. Cornou C, Lundbye-Christensen S:Classifying sows’activity types from acceleration patterns an application of the multi-process kalman filter. App Anim Behav Sci2008,111:262–273.
73. White BJ, Coetzee JF, Renter DG, Babcock AH, Thomson DU, Andresen D:
Evaluation of two-dimensional accelerometers to monitor behavior of beef calves after castration.Am J Vet Res2008,69:1005–1012. 74. Sullivan EL, Cameron JL:A rapidly occurring compensatory decrease
in physical activity counteracts diet-induced weight loss in female monkeys.Am J Physiol Reg Integ Compar Physiol2010,
298(4):R1068–R1074.
75. Cooke SJ:Biotelemetry and biologging in endangered species research and animal conservation: relevance to regional, national, and IUCN Red List threat assessments.Endangered Spec Res2008,4:165–185.
76. Krone O, Berger A, Schulte R:Recording movement and activity pattern of a white-tailed Sea eagle (haliaeetus albicilla) by a GPS datalogger. J Ornithol2009,150:273–280.
77. Wilson RP, White CR, Quintana F, Halsey LG, Liebsch N, Martin GR, Butler PJ:
Moving towards acceleration for estimates of activity-specific metabolic rate in free-living animals: the case of the cormorant.J Anim Ecol2006,
75:1081–1090.
78. Tsuda Y, Kawabe R, Tanaka H, Mitsunaga Y, Hiraishi T, Yamamoto K, Nashimoto K:Monitoring the spawning behaviour of chum salmon with an acceleration data logger.Ecol Freshwater Fish2006,15:264–274. 79. Yasuda T, Arai N:Changes in flipper beat frequency, body angle and
swimming speed of female green turtlesChelonia mydas. Marine Ecol Progress Ser2009,386:275–286.
80. Zimmer I, Ropert-Coudert Y, Poulin N, Kato A, Chiaradia A:Evaluating the relative importance of intrinsic and extrinsic factors on the foraging activity of top predators: a case study on female little penguins. Marine Biol2011,158:715–722.
81. Jensen MB:Behaviour around the time of calving in dairy cows. App Anim Behav Sci2012,139:195–202.
82. Whitney NM, Harold LP Jr, Pratt TC, Carrier JC:Identifying shark mating behaviour using three-dimensional acceleration loggers.
Endangered Spec Res2010,10:71–82.
83. Lagarde F, Guillon M, Dubroca L, Bonnet X, Ben Kaddour K, Slimani T, El Mouden EH:Slowness and acceleration: a new method to quantify the activity budget of chelonians.Anim Behav2008,75:319–329.
84. Ismail A, Rahman F, Miyazaki N, Naito Y:Initial application of bio-logging techniques on captive Milky Stork (Mycteria cinerea) in Malaysia. Trop Ecol2012,53:177–181.
85. Rushen J, de Passille AM:Automated measurement of acceleration can detect effects of age, dehorning and weaning on locomotor play of calves.App Anim Behav Sci2012,139:169–174.
86. Holland KN, Meyer CG, Dagorn LC:Inter-animal telemetry: results from first deployment of acoustic‘business card’tags.Endangered Spec Res
2010,10:287–293.
87. De Rouffignac C, Morel F:A comparative study of water turnover in 4 rodent species of which 2 are from the desert—Meriones-Shawi rat mouse gerbil.J de Physiologie (Paris)1966,58:309–322.
88. Arnould JPY, Boyd IL, Speakman JR:The relationship between foraging behaviour and energy expenditure in Antarctic fur seals.J Zool (London)
1996,239:769–782.
89. Brown JH, Gillooly JF, Allen AP, Savage VM, West GB:Toward a metabolic theory of ecology.Ecology2004,85:1771–1789.
90. Altmann S, Altmann J:The transformation of behaviour field studies. Anim Behav2003,65:413–423.
91. Speakman JR:Doubly Labelled Water: Theory and Practice.Cambridge: Cambridge University Press; 1997.
92. Butler PJ, Green JA, Boyd IL, Speakman JR:Measuring metabolic rate in the field: the pros and cons of the doubly labelled water and heart rate methods.Functional Ecol2004,18:168–183.
93. Ropert-Coudert Y, Wilson RP:Trends and perspectives in animal-attached remote sensing.Front Ecol Environ2005,3:437–444.
94. Hindle AG, Rosen DAS, Trites AW:Swimming depth and ocean currents affect transit costs in Steller sea lions Eumetopias jubatus.Aqua Biol2010,
10:139–148.
95. Fahlman A, Wilson R, Svard C, Rosen DAS, Trites AW:Activity and diving metabolism correlate in Steller sea lion Eumetopias jubatus.Aqua Biol
2008,2:75–84.