Shahid Kamal
Institute of Statistics, University of the Punjab Q. A. Campus, Lahore, 54590, Pakistan Email: kamal_shahid@hotmail.com
Sandra Lang
Department of Midwifery Studies, University of Central Lancashire Preston, U.K.
Abstract
In this paper we consider the application and analysis of a cross-over design in a medical problem. Some statistical detail is given of the linear model used and its analysis. This design is in the class of repeated measurement analyses which can, for the medical research worker, be a source of some difficulty. Its application to a study of the constituents of breast-milk, and their possible variation between hand and pump expression is examined. Data for this analysis comes from a study that has been carried out in Exeter, UK, in which information was collected on a number of different aspects of infant feeding. Results for sodium, potassium, and other constituents are reported, together with some discussion of the various practical difficulties that can arise in the organisation of studies of this kind. Comments are included concerning the extension from two to three-period designs, and in the testing of significance.
Introduction
There are considerable number of experiments in which repeated measurements are made on the same experimental unit. For example, plots of land on which different varieties of a crop are grown in successive seasons; individuals given different treatments in successive time-periods. These experiments can also be subject to specific design features to take account of other influencing factors and practical constraints. The effect of these types of experiment is that they require an analysis that incorporates the non-independence of some of the measurements made. As we might expect, model representations are most easily analysed if we use linear structures, combined with certain simplifying assumptions. The purpose of this paper is to report the results of a particular type of experimental arrangement, known as a cross-over design, to analyse of data from a study of human breast-milk.
nutrients, is particularly advantageous for preterm and sick infants, any differences between hand and pump expressed milk are important. Such information can contribute to the decision-making process of assessing the need for nutrient supplementation in milk given to young infants.
In the methodology section we outline the model and its analysis, present the outcome analyses in the results section, and in the final part discuss issues associated with this type of analysis and the results obtained.
Methodology
Let us assume that there are T treatments, t1, t2, .., tT, and that the purpose of
the analysis is to identify significant differences between them. Furthermore, each of the experimental units is given one of the T treatments in each time period j = 1,..,J
For example, one of the experimental units could be given the following sequence of treatments:
t1 t4 t2
j = 1 j = 2 .. .. j = J
Given values for J and T there are clearly a fixed, possibly large, set of treatment sequences that might be used. For most studies of this kind, a design comprising replications of every possible such sequence is not practical. As cross-over designs are most commonly used for the important reason that limited numbers of experimental units are available, restricting the experiment to a few sequences is quite common. This was the case in the breast-milk example considered in this paper.
There are also statistical reasons for not including certain sequences; where, for example, they do not contribute to the estimation of carry-over effects.
Suppose that the experimental units are allocated to one of S sequences s1,s2,..,sS, and that Y denotes the measurement made. Then a possible linear
model is given by
[ ]s,j [s,j 1] 1sk sjk2 j
sjk p t C e e
Y =µ+ + + − + +
where
µ = the general mean,
pj = effect of the jth period, j = 1, .., J,
[ ]s j
[s,j−1]
c = the effect of the carry – over of the treatment administered in period j–1 of sequences,
1 sk
e = random error effect of kth subject in sequence s, k = 1,..ns,
2 sjk
e = random error effect of kth subject in period j in sequence s.
Using appropriate statistics it is possible to test various hypotheses of interest. As a first step it is necessary to test the hypothesis H1: that the carry-over
effects c[s,j−1] are equal. If this hypothesis is accepted then the equality of treatment effects and of the period effects can be tested. On the other hand, if the carry-over effects are significantly different then only information from the first time-period can be used to compare the treatments. One of the first to consider the analysis of this type of design was Grizzle (1965). Variations and extensions of the 2-period design and their analyses can be found, for example, in Balaam (1968), Kershner and Federer (1981), Ebbutt (1984), and in Jones and Kenward’s book (1989).
An alternative formulation is to construct the linear model containing dummy variables; for each of the levels of the factors (period, treatment, carry-over) and subject effects.
Let {i = 1,..,K} and
{
pj, j=1,..,J}
denote the ‘maximal’ set of subjects and time points at which measurements were made. The model is assumed of the form,
− − −
− =X +e
Y β where the ‘design’ matrix is given by
s1 .. sK p1 .. pJ (f1,1 .. f1,c1) .. (fF,1 .. fF,cF)
[s1,p1] 1 0− 0 1 0− 0 * .. * .. * .. *
: : 0− 0− 0− .. 0− : .. : .. : .. :
−
X [s1,pJ] 1
−
0 0 0
−
0 1 * .. * .. * .. *
+ +
∑
= F i i c J K x KJ 1 )( : 0 : 0 : : : : .. : .. : .. :
[sk,p1] 0 0− 1 1 0− 0 * .. * .. * .. *
: 0− 0− : 0− .. 0− : .. : .. : .. :
[sk,pJ] 0 0− 1 0 0− 1 * .. * .. * .. *
and {Si; i=1,..,K}, {Pj; j=1,..,J}, and {f1m; 1=1,..,F and m=1,.., cF} denote levels
of subjects, time periods, and factors respectively; _
observations; and
−
e is an error vector with
( )
−
− =0
e
E . The (0,1) entries for the factor columns depend upon the nature of the experimental design, are indicated ‘*’, and will include both main treatment and carry-over effects.
In the case of the 2x2 cross-over design, the factors include 2 treatment levels and the 2 possible carry-over effects. The design matrix for the specific analyses used in this paper is shown in the appendix.
Although the dimension of
−
X is sometimes considerable, particularly when there are large number of subjects, there can be some benefit to the research worker in being able to view and identify each column with a specific influence in the experiment. Many statistical software packages are now well able to work with such large and sparse matrices, in the solution of the sets of linear estimating equations, necessary to determine
−
βˆ and the accompanying analysis of variance (ANOVA).
Results
The part of the Exeter study data considered in this paper, constitutes a 2 (treatment) by 2 (period) cross-over design; fuller details are given in Lang, et al (1994).
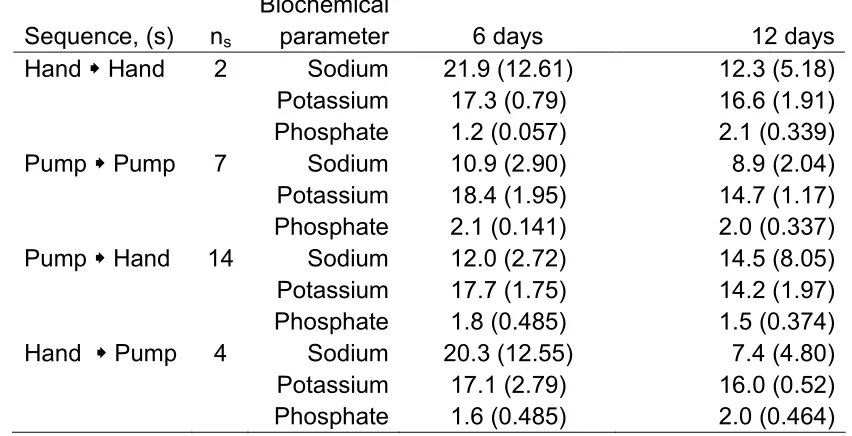
Table 1: Mean (and standard deviations) sodium, potassium, and phosphate concentrations in each sequence.
Measurement made, following birth, at:-
Biochemical
Sequence, (s) ns parameter 6 days 12 days
Hand Hand 2 Sodium 21.9 (12.61) 12.3 (5.18)
Potassium 17.3 (0.79) 16.6 (1.91)
Phosphate 1.2 (0.057) 2.1 (0.339)
Pump Pump 7 Sodium 10.9 (2.90) 8.9 (2.04)
Potassium 18.4 (1.95) 14.7 (1.17)
Phosphate 2.1 (0.141) 2.0 (0.337)
Pump Hand 14 Sodium 12.0 (2.72) 14.5 (8.05)
Potassium 17.7 (1.75) 14.2 (1.97)
Phosphate 1.8 (0.485) 1.5 (0.374)
Hand Pump 4 Sodium 20.3 (12.55) 7.4 (4.80)
Potassium 17.1 (2.79) 16.0 (0.52)
The model was applied to the biochemical parameters: sodium, potassium, and phosphate, contained in the breast-milk. Table 1 gives mean values, with standard deviations, at 6 days and 12 days postpartum (following birth) for each of the four treatment sequences (HandHand, PumpPump, PumpHand, and HandPump). Applying the above model gives the analysis of variance results shown in Table 2. For none of the biochemical parameters are the carry-over effects significant; allowing the use of the full data sets to test for period and treatment effects. We can see that in these Univariate ANOVAs the only parameter showing a significant period effect is potassium with, in all sequences, a decrease in mean value [see Figure 1(b)]. The treatment effects (Hand versus Pump expression) are seen to be statistically significant for both sodium and phosphate. The extent to which these are clinically independent is a somewhat open question. In Figure 2, a scatter plot of sodium and potassium for all 27 experimental units is given, and has an estimated correlation of 0.56.
Table 2: ANOVA analyses for Sodium, Potassium, and Phosphate.
Source of Variability Degrees of freedom Squares Sum of of Squares Mean sum F
Between subjects Sodium 26 1424.10 54.77
Potassium 26 113.88 4.38
Phosphate 26 6.01 0.23
Within subjects:
Periods (6, 12) Sodium 1 46.93 46.93 2.05
Potassium 1 117.84 117.84 66.58*
Phosphate 1 0.05 0.05 0.42
Trts (Hand, Pump) Sodium 1 382.76 382.76 16.76*
Potassium 1 7.12 7.12 4.02
Phosphate 1 1.06 1.06 8.83*
Carry-over Sodium 1 48.98 48.98 2.14
Potassium 1 8.61 8.61 4.86
Phosphate 1 0.57 0.57 4.75
Residual Sodium 24 526.12 21.92
Potassium 24 42.61 1.77
Phosphate 24 2.78 0.12
Total Sodium 53 2428.89
Potassium 53 290.06
Phosphate 53 10.47
In the analysis of the phosphate data, sodium can be included as a covariate, in which case the significance of the phosphate disappears, reflecting the association between them shown in Figure 2.
Figure 2: Scatter plot of phosphate against sodium, for all subjects.
Discussion
References
1. Anderson, G. H. and Bryan, H.M. (1982). Is the premature infant’s own mother’s milk best? Journal of Paediatric Gastroenterology and Nutrition 1(2), 157-159.
2. Balaam, L. N. (1968). A two period design with t experimental units.
Biometrics 24, 61-73.
3. Ebbutt, A. F. (1984). Three-period Crossover Designs for Two treatments.
Biometrics 40, 219-224.
4. Kershner, R. P. and Federer, W. T. (1981). Two-Treatment Crossover Designs for Estimating of a Variety of effects. Journal of the American
Statistical Association 76, 612-619.
5. Grizzle, J. E. (1968). The two-period Change-over design and its use in Clinical Trials. Biometrics 21, 467-480.
6. Jones, B. and Kenward, M. (1989). Design and Analysis of Cross-over Trials.
Chapman and Hall, London.
7. Lang, S. (1997). Breastfeeding Special Care Babies. Bailliere Tindall, London. 8. Lang, S., Lawrence, C. J., and Orme, R. (1994). Sodium in hand and pump
expressed human breast-milk. Early Human Development 38, 131-138.
Appendix:
Outline design matrix for the data set of 27 subjects:
S-1 S-2 … S-27 Pd-1 Pd-2 H(and) P(ump) CO (H-) CO (P-)
S-1, t-1 1 0 … 0 1 0 1 0 0 0
S-2, t-1 0 1 … 0 1 0 1 0 0 0
S-1, t-2 1 0 … 0 0 1 1 0 1 0
S-2, t-2 0 1 … 0 0 1 1 0 1 0
S-3, t-1 0 0 … 0 1 0 0 1 0 1
…
S-27, t-2 0 0 … 1 0 1 1 0 1 0