N
Ne
ettw
wo
orrk
kiin
ngg o
off d
diiffffe
erre
en
nttiiaallllyy e
ex
xp
prre
esssse
ed
d gge
en
ne
ess iin
n h
hu
um
maan
n ccaan
ncce
err cce
ellllss rre
essiissttaan
ntt
tto
o m
me
etth
ho
ottrre
ex
xaatte
e
Elisabet Selga, Carlota Oleaga, Sara Ramírez, M Cristina de Almagro,
Véronique Noé and Carlos J Ciudad
Address: Department of Biochemistry and Molecular Biology, School of Pharmacy, University of Barcelona, Diagonal Avenue, E-08028 Barcelona, Spain.
Correspondence: Carlos J Ciudad. Email: cciudad@ub.edu
A
Ab
bssttrraacctt
B
Baacck
kggrro
ou
un
nd
d:: The need for an integrated view of data obtained from high-throughput technologies
gave rise to network analyses. These are especially useful to rationalize how external
perturbations propagate through the expression of genes. To address this issue in the case of
drug resistance, we constructed biological association networks of genes differentially expressed
in cell lines resistant to methotrexate (MTX).
M
Me
etth
ho
od
dss:: Seven cell lines representative of different types of cancer, including colon cancer
(HT29 and Caco2), breast cancer (MCF-7 and MDA-MB-468), pancreatic cancer (MIA PaCa-2),
erythroblastic leukemia (K562) and osteosarcoma (Saos-2), were used. The differential
expres-sion pattern between sensitive and MTX-resistant cells was determined by whole human genome
microarrays and analyzed with the GeneSpring GX software package. Genes deregulated in
common between the different cancer cell lines served to generate biological association
networks using the Pathway Architect software.
R
Re
essu
ullttss:: Dikkopf homolog-1 (DKK1) is a highly interconnected node in the network generated
with genes in common between the two colon cancer cell lines, and functional validations of this
target using small interfering RNAs (siRNAs) showed a chemosensitization toward MTX.
Members of the UDP-glucuronosyltransferase 1A (UGT1A) family formed a network of genes
differentially expressed in the two breast cancer cell lines. siRNA treatment against UGT1A also
showed an increase in MTX sensitivity. Eukaryotic translation elongation factor 1 alpha 1
(EEF1A1) was overexpressed among the pancreatic cancer, leukemia and osteosarcoma cell lines,
and siRNA treatment against EEF1A1 produced a chemosensitization toward MTX.
C
Co
on
nccllu
ussiio
on
nss:: Biological association networks identified DKK1, UGT1As and EEF1A1 as important
gene nodes in MTX-resistance. Treatments using siRNA technology against these three genes
showed chemosensitization toward MTX.
Published: 4 September 2009
Genome Medicine 2009, 11::83 (doi:10.1186/gm83)
The electronic version of this article is the complete one and can be found online at http://genomemedicine.com/content/1/9/83
Received: 22 May 2009 Revised: 31 July 2009 Accepted: 4 September 2009
© 2009 Selga et al.; licensee BioMed Central Ltd.
B
Baacck
kggrro
ou
un
nd
d
The large amount of information obtained with high-throughput technologies like expression microarrays needs to be processed in order to be comprehensible to molecular biologists. In this regard, many computational methods have been developed to facilitate expression data analysis. Gene clustering, gene ontology and pathway analyses are commonly used [1,2]. Pathways are manually generated dia-grams that represent knowledge on molecular interactions and reactions [3] and they can be used to visualize the involvement of the differentially expressed genes in specific molecular, cellular or biological processes. However, the complexity of higher organisms cannot be explained solely as a collection of separate parts [4]; in organisms, pathways never exist in isolation, they are part of larger networks, which are more informative and real [5]. Gene networks are capable of describing a large number of interactions in a concise way, and provide a view of the physiological state of an organism at the mRNA level. Biochemical networks can be constructed at several levels and can represent different types of interactions. Literature mining allows the extraction of meaningful biological information from publications to generate networks [6]. Taking into account the progress in gene expression profiling, elucidating gene networks is an appropriate and timely step on the way to uncovering the complete biochemical networks of cells [5].
In this work, we use biological association networks (BANs) as a tool to define possible targets for gene therapy in combi-nation with methotrexate (MTX). This approach could serve to minimize the development of MTX resistance acquired by cancer cells, which remains a primary cause of therapy failure in cancer treatment [7]. A role in MTX resistance was established for the three node genes selected, namely those
encoding Dikkopf homolg 1 (DKK1),
UDP-glucuronosyl-transferases (UGTs; UGT1As) and Eukaryotic translation
elongation factor 1A1 (EEF1A1).
M
Me
etth
ho
od
dss
C
Ce
ellll lliin
ne
ess
Cell lines representative of five types of human cancer were used: HT29 and Caco-2 for colon cancer, MCF-7 and MDA-MB-468 for breast cancer, MIA PaCa-2 for pancreatic cancer, K562 for erythroblastic leukemia, and Saos-2 for osteosarcoma. These cell lines are sensitive to MTX, with
IC50s of 1.67 x 10⁻⁸M MTX for HT29, 4.87 x 10⁻⁸M MTX for
MDA-MB-468 and 1.16 x 10⁻⁸M MTX for MIA PaCa-2 cells.
IC50 values were calculated using GraphPad Prism 5 version 5.0a for Macintosh (GraphPad Software, San Diego, CA, USA). Resistant cells were obtained in the laboratory upon incubation with stepwise concentrations of MTX (Lederle) as previously described [8]. HT29, Caco-2 and K562
resistant cells were able to grow in 10-5M MTX; MIA PaCa-2,
Saos-2, MCF-7 and MDA-MB-246 cells were resistant to
10-6M MTX.
C
Ce
ellll ccu
ullttu
urre
e
Human cell lines were routinely grown in Ham’s F12 medium supplemented with 7% fetal bovine serum (both from
Gibco/Invitrogen, Grand Island, NY, USA) at 37°C in a 5% CO2
humidified atmosphere. Resistant cells were routinely grown in selective DHFR medium lacking glycine, hypoxanthine and thymidine (-GHT medium; Gibco), the final products of dihydrofolate reductase (DHFR) activity. This medium was supplemented with 7% dialyzed fetal bovine serum (Gibco).
M
Miiccrro
oaarrrraayyss
Gene expression was analyzed by hybridization to the
GeneChip®Human Genome U133 PLUS 2.0 from Affymetrix,
containing over 54,000 transcripts and variants. Total RNA for oligo arrays was prepared from triplicate samples of every sensitive and resistant cell line using the RNAeasy Mini kit (Qiagen, Germantown, Maryland, USA) following the recom-mendations of the manufacturer. Labeling, hybridization and detection were carried out following the manufacturer’s specifications.
M
Miiccrro
oaarrrraayy d
daattaa aan
naallyysse
ess
Gene expression analyses were performed using three samples of both sensitive and resistant cells for each of the seven cell lines studied. These analyses were carried out with the GeneSpring GX software v 7.3.1 (Agilent Technologies, Santa Clara, CA, USA), using the latest gene annotations available (March 2009). This software package allows multi-filter comparisons using data from different experiments to perform the normalization, generation of restriction (filtered) lists and functional classifications of the differentially expressed genes. Normalization was applied in two steps: ‘per chip normalization’, by which each measurement was divided by the 50th percentile of all measurements in its array; and ‘per gene normalization’, by which all the samples were normalized against the median of the control samples (sensitive cells). The expression of each gene was reported as the ratio of the value obtained for each condition relative to the control condition after normalization of the data. Then, data were filtered using the control strength, a control value calculated using the Cross-Gene Error model on replicates [9] and based on average base/proportional value. Measurements with higher control strength are relatively more precise than measurements with lower control strength. Genes that did not reach this value were discarded. Additional filtering was performed to determine differentially expressed genes. A first
filter was performed by selecting the genes that displayed a P
-value corrected by false discovery rate (Benjamini and
Hochberg false discovery rate) of less than 0.05.The output of
C
Co
om
mm
mo
on
n gge
en
ne
ess b
be
ettw
we
ee
en
n cce
ellll lliin
ne
ess
The lists of genes differentially expressed by at least twofold
with a P-value <0.05 including multiple testing correction
for each cell line were divided into two groups: overexpressed and underexpressed genes. Comparisons of lists of overexpressed genes were performed using Venn diagrams in GeneSpring GX. Lists of underexpressed genes were also compared using the same approach. All lists were compared in pairs and lists of genes in common between each pair were generated.
G
Ge
en
ne
erraattiio
on
n o
off b
biio
ollo
oggiiccaall aasssso
occiiaattiio
on
n n
ne
ettw
wo
orrk
kss
BANs were constructed with the aid of Pathway Architect software v3.0 (Stratagene-Agilent). Briefly, this software package generates interaction networks starting with the genes in a given list (entities) taking into account the information present in a database of known molecular interactions. The lists correspond to the collection of differentially expressed genes under specific conditions. The database of molecular interactions is composed of more than 1.6 million interactions divided into different classes (binding, regulation, promoter binding, transport, metabo-lism, protein metabolism and expression). The interactions are extracted from the literature using a Natural Language Processing (NLP) tool run on Medline abstracts (NLP refer-ences), plus those obtained from external curated databases like BIND (Biomolecular Interaction Network Database) [10] and MINT (Molecular INTeraction) [11]. Interactions in the interaction database are scored according to five different categories: maximum, high, medium, low and minimal. Curated interactions (BIND and MINT sources) are given the maximum quality score, as are any interactions that have at least three NLP references. Pathway Architect gathers all that information to construct novel views as to how the entities in a list could be interacting with each other, even including entities not present in the original list (neighbors resulting from the expanded interaction). Customized analyses were performed to select relevant interaction networks with an associated high confidence index since such networks are likely to mirror biological significance. One-step expansion (using the expand network
command) of the original set of entities with maximum score interaction were then analyzed by setting an advanced filter that included the categories of binding, expression, metabo-lism, promoter binding, protein modification and regulation. This procedure gives a final representation formed of a collection of nodes with different degrees of inter-relationship. Some gene products from the original lists were not significantly connected with other members or neigh-bors and, therefore, were removed from the final view. Finally, members of the network were matched with expression levels.
T
Trraan
nssffe
eccttiio
on
n o
off ssm
maallll iin
ntte
errffe
erriin
ngg R
RN
NA
Ass aaggaaiin
nsstt sse
elle
ecctte
ed
d gge
en
ne
ess
HT29 cells (30,000) were plated in 1 ml of -GHT medium and transfection was performed 18 hours later. For each well, Lipofectamine™ 2000 (Invitrogen, Carlsbad, CA, USA)in 100µl of serum free -GHT medium was mixed in
Eppendorf tubes with 100 nM of small interfering RNA
(siRNA) in 100µl of serum free -GHT medium. The mixture
was incubated at room temperature for 20 minutes before
addition to the cells. MTX (2 x 10⁻⁸M) was added 48 hours
after siRNA treatment and 3-(4,5-Dimethylthiazol-2-yl)-2,5-diphenyltetrazolium bromide (MTT) assays [12] were performed 3 days after MTX addition. Treatment of MDA-MB-468 and MIA PaCa-2 cells was performed following the same protocol but using Metafectene™ (Biontex, Martinsried, Germany). A non-related siRNA was used as negative control; it was transfected in parallel with the other siRNAs and used to normalize the results.
The siRNAs were designed using the software iRNAi v2.1. (The Netherlands Cancer Institute, Amsterdam, The Netherlands) Among the possible alternatives, sequences rich in A/T at the 3’ end of the target were chosen. Then, BLAST resources in NCBI were used to assess the degree of specificity of the sequence recognition for these siRNAs. Only the siRNAs that reported the target gene as the only mRNA hit, or some family members in the case of siUGT1A, were selected. The sequences for the sense strand of all siRNAs used are available in Table 1.
H
He
eaatt m
maap
p gge
en
ne
erraattiio
on
n
A global comparison of all cell lines was performed using GeneSpring GX v 7.3.1. The triplicate samples for each condition in each of the seven cell lines (42 samples) were imported into one single experiment. Normalization was performed in two steps: ‘per chip normalization’ (as described above) and ‘per gene normalization’, by which the samples were normalized against the median of all samples.
Lists of genes displaying a false discovery rate-corrected P
-value <0.05 were generated for each cell line. As a filter, these values had to appear in at least two out of the seven cell lines. A hierarchical clustering method in GeneSpring was used to group genes on the basis of similar expression patterns over all samples. The distance matrix used was Pearson correlation, and average linkage was used as clustering T
Taabbllee 11 S
Seennssee ssttrraanndd sseeqquueenncceess ooff tthhee ssiiRRNNAAss uusseedd
Target gene siRNA name siRNA sequence (5’- 3’)
DKK1 siDKK1 AGGTGCTGCACTGCCTATT
UGT1A family siUGT1A GTGCTGGGCAAGTTTACTT
EEF1A1 siEEF1A1 CGGTCTCAGAACTGTTTGT
DHFR siDHFR CCTCCACAAGGAGCTCATT
Luciferase NR-siRNA TAAGGCTATGAAGAGATAC
algorithm. The same clustering method was used to group the cell lines on the basis of similar patterns of gene expression.
R
Re
eaall--ttiim
me
e R
RT
T--P
PC
CR
R
Gene mRNA levels were determined by real-time RT-PCR. Total RNA was extracted from cells using Ultraspec™ RNA reagent (Biotecx, Houston, TX, USA) following the recom-mendations of the manufacturer. For determining gene-node mRNA levels upon siRNA treatment, cells were treated as described above and total RNA was prepared 48 hours after transfection using the same reagent. In either case, complementary DNA was synthesized in a total volume of
20µl by mixing 500 ng of total RNA and 125 ng of random
hexamers (Roche, Mannheim, Germany) in the presence of
75 mM KCl, 3 mM MgCl2, 10 mM dithiothreitol, 20 units of
RNasin (Promega, Madison, WI, USA), 0.5 mM dNTPs (AppliChem, Darmstadt, Germany), 200 units of M-MLV reverse transcriptase (Invitrogen) and 50 mM Tris-HCl buffer, pH 8.3. The reaction mixture was incubated at 37ºC for 60 minutes. The cDNA product was used for subsequent real-time PCR amplification using an ABI Prism 7000 Sequence Detection System (Applied Biosystems, Foster City, CA, USA) with 25 ng of the cDNA mixture, the assays-on-demand from Applied Biosystems Hs00758822_s1 for DHFR and Hs00356991_m1 for Adenine
Phosphoribosyl-transferase (APRT) or the following primers: DKK1,
5’-AGT-ACTGCGCTAGTCCCACC-3’ and
5’-CTGGAATACCCATCC-AAGGTGC-3’; UGT1A, 5’-TAAGTGGCTACCCCAAAACG-3’
and 5’-CTCCAGCTCCCTTAGTCTCC-3’; EEF1A1,
5’-CGT-CATTGGACACGTAGATTCGGG-3’ and 5’-GGAGCCCTT-TCCCATCTCAGC-3’.
G
Ge
en
ne
e cco
op
pyy n
nu
um
mb
be
err d
de
ette
errm
miin
naattiio
on
n
Genomic DNA from either sensitive or resistant cells was obtained with the Wizard™ Genomic DNA Purification Kit (Promega) following the manufacturer’s recommendations. One hundred nanograms of DNA and the assays-on-demand Hs00758822_s1 for DHFR and Hs99999901_s1 for 18S were used for real-time PCR amplification.
P
Prre
ep
paarraattiio
on
n o
off tto
ottaall e
ex
xttrraaccttss ffo
orr w
we
esstte
errn
n b
bllo
ottttiin
ngg
Total extracts from cells, either sensitive or MTX-resistant, were used to assay DHFR protein levels. Cells were washed twice with ice-cold phosphate-buffered saline and scraped in 200 ml lysis buffer (50 mM Hepes, 500 mM NaCl, 1.5 M
MgCl2, 1 mM EGTA, 10% glycerol (v/v), 1% Triton X-100 and
protease inhibitor cocktail). Cells were incubated in ice for 1 hour with vortexing every 15 minutes and then centrifuged at 14,000 rpm at 4°C for 10 minutes. Five microliters of the extract were used to determine protein concentration by the Bradford assay (Bio-Rad, Munich, Germany). The extracts
were frozen in liquid N2 and stored at -80°C. Fifty
micro-grams of both sensitive and resistant cell total extracts were resolved by 15% SDS-PAGE. Transference to PVDF mem-branes (Immobilon P, Millipore, Bedford, MA, USA) using a semidry electroblotter was followed by incubation with an
antibody against DHFR (Davids Biotechnologie, Regensburg, Germany), and detection was accomplished using secondary horseradish peroxidase-conjugated antibody and enhanced chemiluminescence, as recommended by the manufacturer (Amersham/GE Healthcare, Buckinghamshire, UK). To normalize the results, blots were re-probed with an antibody against actin (Sigma, St. Louis, MO, USA).
F Fiigguurree 11
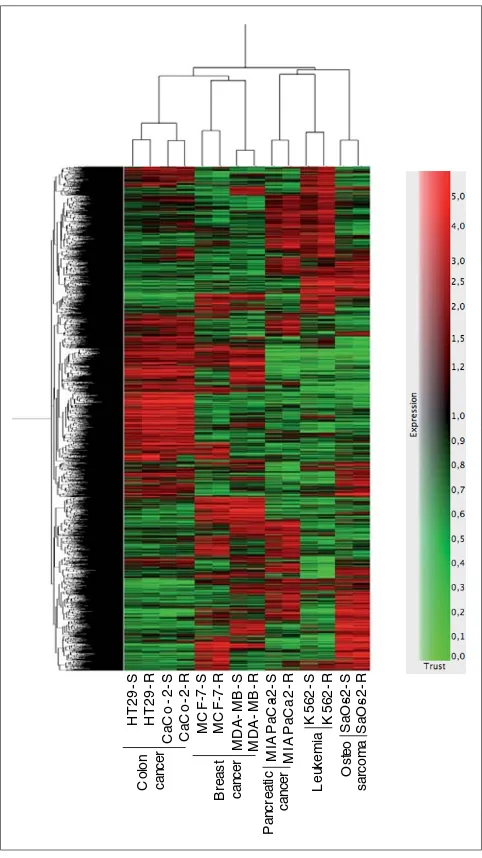
Heat map of differentially expressed genes. Lists of differentially expressed genes with a t-test P-value <0.05 including multiple testing correction were generated for each cell line. A hierarchical clustering method in GeneSpring GX v 7.3.1 was used to construct both the gene tree and the sample tree, as described in Methods. Data are shown in a matrix format: each row represents a single gene, and each column represents a cell line. Red indicates overexpressed genes (expression levels over the median) and green indicates underexpressed genes (expression levels under the median; see legend). The pattern and length of the branches in the dendrograms reflect the relatedness of the samples or the genes.
-S HT 2 9 R Ca Co -2 S Ca Co -R MC F -7 -S MC F --R MD A -MB -S MD A -MB -R MIA P a C a--S MIA P a C a -R K5 6 2 -S K5 6 2 R Sa O s-2 -S Sa O s-2 -R Co lo n ca nc e r Br e a s t ca nc e r Os te o sa rc o m a Le uk e m ia Pa nc re a ti c ca nc e r HT 2
-T
Trraan
nssffe
eccttiio
on
nss,, cco
o--ttrraan
nssffe
eccttiio
on
nss aan
nd
d llu
ucciiffe
erraasse
e aassssaayyss
HT29 cells, either sensitive or MTX-resistant, were seeded into six-well plates the day before transfection at a density of
2 x 10⁵cells/well in Ham’s F12 medium containing 7% fetal
bovine serum. Transfection was performed using FUGENE™
HD (Roche). For each well, 6 µl of FUGENE™ HD in 100 µl
of serum-free medium was incubated at room temperature
for 5 minutes. The mixture was added to 1 µg of TOPFLASH
(Millipore) and incubated at room temperature for 20 minutes before addition to the cells. In co-transfections,
1µg of TOPFLASH was mixed together with 2µg of
pBATEM2-CDH before the addition of FUGENE™ HD in serum-free medium. The total amount of DNA was kept
constant at 3µg, adding empty vector when necessary.
Luciferase activity was assayed 30 hours after transfection.
In all cases, cell extracts were prepared by lysing the cells
with 200µl of freshly diluted 1x Reporter Lysis Buffer
(Promega). The lysate was centrifugated at 13,000 g for 2 minutes to pellet the cell debris and the supernatants were
transferred to a fresh tube. A 15-µl aliquot of the extract was
added to 15 µl of the luciferase assay substrate (Promega)
and the luminiscence of the samples was read immediately on a Gloomax 20/20 luminometer (Promega); light produc-tion (relative light units) was measured for 10 s. Each trans-fection was performed in triplicate. Protein concentration was determined by the Bradford assay and used to normalize the results.
S
Sttaattiissttiiccaall aan
naallyysse
ess
Data are presented as mean ± standard error (SE). Statistical
analyses were performed using the unpaired t-test option in
GraphPad InStat version 3.1a for Macintosh (GraphPad
Software). P-values <0.05 were considered to be statistically
significant.
R
Re
essu
ullttss
G
Ge
en
ne
ess d
de
erre
eggu
ullaatte
ed
d iin
n m
me
etth
ho
ottrre
ex
xaatte
e--rre
essiissttaan
ntt ccaan
ncce
err cce
ellll lliin
ne
ess
In a previous study, we analyzed the differential gene expres-sion between sensitive and MTX-resistant cells derived from the human colon cancer cell line HT29 [13]. In the present work we extend the study of gene expression profiles associated with MTX resistance by including another six MTX-resistant cell lines. Together, the studied cell lines represent colon cancer (CaCo2 and HT29), breast cancer (MCF-7 and MDA-MB-468), pancreatic cancer (MIA PaCa-2), erythroblastic leukemia (K562) and osteosarcoma (SaOs-2). Total RNA was extracted for the seven pairs of sensitive and MTX-resistant cell lines, and the expression profile of the 54,700 transcripts and variants included in the HG U133 PLUS 2.0 microarray from Affymetrix was compared between each pair using GeneSpring GX software v7.3.1. Upon normalization and statistical filtering of the data, lists of genes differentially expressed by at least twofold were built as described in Methods. These lists are presented as Additional data files 1 to 7. The data discussed in this report have been deposited in the Gene Expression Omnibus (GEO) [14] and are accessible through GEO series accession number [GSE16648].H
Hiie
erraarrcch
hiiccaall ccllu
usstte
erriin
ngg o
off gge
en
ne
ess aan
nd
d cce
ellll lliin
ne
ess
We compared the gene expression patterns of all the studied cell lines together. Lists of genes displaying a false discovery
rate-corrected P-value <0.05 were generated for each cell
line. Then, hierarchical clustering in GeneSpring GX was used to construct a heat map displaying both a gene tree and a sample tree (Figure 1), as described in Methods. Two facts could be extracted from this representation. First, there is a high correlation between cell lines sharing the same tissue origin. The two colon cancer cell lines studied (HT29 and Caco-2) are more highly correlated in gene expression with each other than with all the other cell lines. The breast cancer cell lines studied (MCF-7 and MDA-MB-468) also showed similar gene expression, although the degree of correlation is slightly lower than that for the colon cancer cell lines. The other three cell lines studied (MIA PaCa-2, K562 and Saos-2) displayed different gene expression from the colon or the breast cancer cell lines, and thus cluster apart from them. Second, gene expression of the resistant cells is more closely correlated with that of their sensitive cell counterparts than with any other sample or cell line. T
Taabbllee 22 V
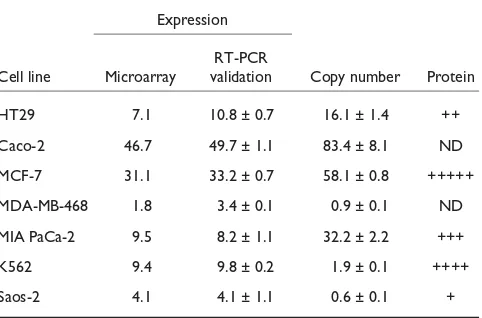
Vaalliiddaattiioonn ooff ddhhffrr oovveerreexxpprreessssiioonn aanndd ccooppyy nnuummbbeerr ddeetteerrmmiinnaattiioonn iinn tthhee d
diiffffeerreenntt cceellll lliinneess
Expression RT-PCR
Cell line Microarray validation Copy number Protein
HT29 7.1 10.8 ± 0.7 16.1 ± 1.4 ++
Caco-2 46.7 49.7 ± 1.1 83.4 ± 8.1 ND
MCF-7 31.1 33.2 ± 0.7 58.1 ± 0.8 +++++
MDA-MB-468 1.8 3.4 ± 0.1 0.9 ± 0.1 ND
MIA PaCa-2 9.5 8.2 ± 1.1 32.2 ± 2.2 +++
K562 9.4 9.8 ± 0.2 1.9 ± 0.1 ++++
Saos-2 4.1 4.1 ± 1.1 0.6 ± 0.1 +
T Taabbllee 33 G
Geenneess ddiiffffeerreennttiiaallllyy eexxpprreesssseedd iinn ccoommmmoonn aammoonngg ccoolloonn ccaanncceerr cceellll lliinneess rreessiissttaanntt ttoo MMTTXX
GenBank ID Gene name Description Ratio HT29 Ratio Caco-2
AI144299 DHFR Dihydrofolate reductase 7.25 46.35
BC005238 FXYD3 FXYD domain containing ion transport regulator 3 7.24 2.20
BC003584 DHFR Dihydrofolate reductase 6.96 50.23
BC000192 DHFR Dihydrofolate reductase 6.89 38.31
NM_002380 MATN2 Matrilin 2 6.62 4.70
BU078629 ZFYVE16 Zinc finger, FYVE domain containing 16 6.06 22.73
NM_001975 ENO2 Enolase 2 (gamma, neuronal) 5.98 2.04
NM_017954 CADPS2 Ca2+-dependent activator protein for secretion 2 5.60 2.27
AI991103 AXIIR Similar to annexin II receptor 5.14 2.03
NM_000791 DHFR Dihydrofolate reductase 4.71 21.17
U05598 AKR1C2 Aldo-keto reductase family 1, member C2 4.63 10.15
M33376 AKR1C2 Aldo-keto reductase family 1, member C2 4.41 8.89
NM_012242 DKK1 Dickkopf homolog 1 4.25 2.56
NM_014867 KBTBD11 Kelch repeat and BTB (POZ) domain containing 11 4.22 2.14
AB037848 KIAA1427 Synaptotagmin XIII 4.13 9.56
NM_014733 ZFYVE16 Zinc finger, FYVE domain containing 16 4.11 15.6
NM_001353 AKR1C1 Aldo-keto reductase family 1, member C1 3.94 8.87
NM_002439 MSH3 MutS homolog 3 3.87 4.00
S68290 AKR1C1 Aldo-keto reductase family 1, member C1 3.66 9.45
J04810 MSH3 MutS homolog 3 3.27 8.23
NM_000691 ALDH3A1 Aldehyde dehydrogenase 3 family, member A1 2.86 3.81
AI718385 SLC26A2 Solute carrier family 26 member 2 2.76 2.02
NM_003069 SMARCA1 SWI/SNF related, regulator of chromatin a1 2.60 2.49
AB029026 TACC1 Transforming, acidic coiled-coil containing protein 1 2.35 3.89
NM_006283 TACC1 Transforming, acidic coiled-coil containing protein 1 2.31 3.26
AF188298 DAB2 Disabled homolog 2 2.29 2.11
NM_020299 AKR1B10 Aldo-keto reductase family 1, member B10 2.26 22.95
BC006471 MLLT11 Myeloid/lymphoid or mixed-lineage leukemia 2.18 2.60
W93554 SH3PXD2A SH3 and PX domains 2A 2.14 3.45
NM_014778 NUPL1 Nucleoporin like 1 0.46 0.43
NM_006033 LIPG Lipase, endothelial 0.40 0.42
NM_012338 TM4SF12 Transmembrane 4 superfamily member 12 0.39 0.38
NM_007150 ZNF185 Zinc finger protein 185 (LIM domain) 0.38 0.42
AB014605 MAGI2 Membrane associated guanylate kinase 0.38 0.30
AB033831 SCDGF Platelet derived growth factor C 0.35 0.35
NM_021021 SNTB1 Syntrophin, beta 1 0.35 0.23
NM_021822 APOBEC3G Apolipoprotein B, catalytic polypeptide-like 3G 0.30 0.08
AB039791 ARP11 Actin-related protein Arp11 0.29 0.46
NM_013352 SART2 Squamous cell carcinoma antigen 0.22 0.31
D
Diih
hyyd
drro
offo
ollaatte
e rre
ed
du
uccttaasse
e ssttaattu
uss iin
n aallll cce
ellll lliin
ne
ess ssttu
ud
diie
ed
d
As DHFR is the target for MTX, and was upregulated in MTX-resistant cells, we validated its overexpression in all cell lines studied. Real-time RT-PCR was used to quantify the mRNA levels, and DHFR protein levels were determined by western blotting in both sensitive and MTX-resistant cell
lines (Table 2). Copy number determination revealed dhfr
amplification only in HT29, Caco-2, MCF-7 and MIA PACA-2 resistant cells (Table 2).
IId
de
en
nttiiffiiccaattiio
on
n o
off gge
en
ne
ess d
diiffffe
erre
en
nttiiaallllyy e
ex
xp
prre
esssse
ed
d iin
n cco
om
mm
mo
on
n
aam
mo
on
ngg d
diiffffe
erre
en
ntt cce
ellll lliin
ne
ess rre
essiissttaan
ntt tto
o M
MT
TX
X
Lists of genes differentially expressed by at least twofold between sensitive and resistant cell lines were generated for each cell line. Each list was split in two, one group including the overexpressed genes and the other including the underexpressed genes. Then, Venn diagrams were used to compare the lists of overexpressed and underexpressed genes between HT29 and Caco-2 cell lines, between MCF-7 and MDA-MB-468 cell lines, and among MIA PaCa-2, K562 and Saos-2 cell lines (Tables 3, 4 and 5, respectively). This approach allowed us to identify differentially expressed genes with a common trend in expression among the cell lines compared.
D
De
ette
eccttiio
on
n o
off n
no
od
de
ess u
up
po
on
n gge
en
ne
erraattiio
on
n o
off b
biio
ollo
oggiiccaall aasssso
occiiaattiio
on
n
n
ne
ettw
wo
orrk
kss
BANs were constructed using the Pathway Architect soft-ware as described in Methods starting with the lists of genes differentially expressed in common between both colon
cancer cell lines, both breast cancer cell lines and among the pancreas cancer, leukemia and osteosarcoma cell lines
(Figure 2a,b,c, respectively). In the BANs generated, DKK1is
a highly interconnected node in the colon cancer cell lines,
UGT1A family members formed a network of genes
differentially expressed in breast cancer, and EEF1A1 was
commonly overexpressed in pancreatic cancer, leukemia and osteosarcoma. A BAN including all the genes of the three lists of differentially expressed genes was constructed
(Figure 3). DKK1, UGT1A and EEF1A1 all seemed to be
important nodes of this newly constructed network, and thus were selected for further study.
E
Effffe
ecctt o
on
n M
MT
TX
X sse
en
nssiittiivviittyy o
off ssiiR
RN
NA
Ass d
de
essiiggn
ne
ed
d aaggaaiin
nsstt tth
he
e
m
mR
RN
NA
Ass o
off n
no
od
de
e gge
en
ne
ess
Given that the node genes DKK1, UGT1As and EEF1A1were
overexpressed in cells resistant to MTX (Table 6), we investi-gated the effect of decreasing their mRNA levels by means of siRNAs on the sensitivity to this chemotherapeutic agent. We also performed treatments with siDHFR in order to assess the role of DHFR in MTX resistance. HT29 and MDA-MB-468 cell lines were used as models of colon and breast cancer, respectively, and MIA PaCa-2 cells were selected as the model for the other three cell lines. Previously, it was confirmed that the mRNA levels of the three genes were decreased 48 hours after siRNA treatment (Figure 4a-c). Cells were pre-incubated with individual siRNAs for 48 hours before the addition of methotrexate. The presence of 100 nM of either siDKK1 or siDHFR caused increases in MTX cyto-toxicity in HT29 cells of 50% and 65%, respectively, com-T
Taabbllee 33 C Coonnttiinnuueedd
GenBank ID Gene name Description Ratio HT29 Ratio Caco-2
NM_004362 CLGN Calmegin 0.21 0.19
AI912583 GLIPR1 GLI pathogenesis-related 1 (glioma) 0.21 0.45
Z19574 KRT17 Keratin 17 0.19 0.46
NM_003186 TAGLN1 Transgelin 0.19 0.14
NM_014059 RGC32 Response gene to complement 32 0.17 0.44
BE872674 CLEC3A C-type lectin domain family 3, member A 0.15 0.24
NM_003212 TDGF1/3 Teratocarcinoma-derived growth factor 1/3 0.13 0.47
BC000069 RARRES2 Retinoic acid receptor responder 2 0.07 0.33
AF110400 FGF19 Fibroblast growth factor 19 0.06 0.26
NM_006851 GLIPR1 GLI pathogenesis-related 1 0.05 0.28
NM_006169 NNMT Nicotinamide N-methyltransferase 0.04 0.24
AF208043 IFI16 Interferon, gamma-inducible protein 16 0.03 0.38
BG256677 IFI16 Interferon, gamma-inducible protein 16 0.02 0.40
NM_006169 NNMT Nicotinamide N-methyltransferase 0.02 0.24
pared to MTX alone (Figure 4d). Incubation with 100 nM of either siUGT1A or siDHFR in MDA-MB-468 cells caused increases in cytotoxicity of 36% and 50%, respectively, com-pared to MTX alone (Figure 4e). Treatment of MIA PaCa-2 cells with 30 nM of either siEEF1A1 or siDHFR resulted in increased cytotoxicity of 35% and 65%, respectively, com-pared to MTX alone (Figure 4f). The same approach was conducted in the resistant counterparts of the HT29, MDA-MB-468 and MIA PaCa-2 cell lines, but no significant changes
in cytotoxicity were observed (P> 0.05; data not shown).
Given that the UGT1A family is involved in the metabolism of other drugs, we also performed combination treatments with siUGT1A and SN38, the active metabolite of the anticancer drug irinotecan. Transfection of the siRNA was performed as described above, and 1 nM SN38 was added 48 hours after siRNA treatment. These incubations led to a
significant (P< 0.01) increase of 46% in SN38 sensitivity.
A non-related siRNA against the luciferase gene was used as a negative control in all experiments. Transfection of this
siRNA was performed in parallel with the other siRNAs, and was used to normalize the results.
D
DK
KK
K1
1 iiss o
ovve
erre
ex
xp
prre
esssse
ed
d iin
n H
HT
T2
29
9 M
MT
TX
X--rre
essiissttaan
ntt cce
ellllss d
du
ue
e tto
o
h
hiiggh
he
err aaccttiivvaattiio
on
n o
off tth
he
e W
Wn
ntt p
paatth
hw
waayy
As DKK1is known to be transcriptionally regulated by the
Wnt pathway, we investigated the degree of activation of this signaling pathway in MTX-resistant HT29 cells compared with their sensitive counterpart. Cells were transiently transfected with the reporter plasmid TOPFLASH, bearing three T-cell factor (TCF) binding sites. A transcriptional activation of 26-fold resulted from the transfection of TOPFLASH in the resistant cells, while no significant activation was observed upon transfection in the sensitive cells (Figure 5). Additionally, co-transfections of TOPFLASH with an expression plasmid for E-cadherin (pBATEM2-CDH) were performed in both cell lines. As shown in Figure 5, overexpression of E-cadherin in the resistant cells led to a marked decrease in TOPFLASH activity, down to basal activity. No significant changes in transcriptional activity were observed when these co-transfections were performed in the sensitive cells.
T Taabbllee 44 G
Geenneess ddiiffffeerreennttiiaallllyy eexxpprreesssseedd iinn ccoommmmoonn aammoonngg bbrreeaasstt ccaanncceerr cceellll lliinneess rreessiissttaanntt ttoo MMTTXX
Ratio Ratio
GenBank Gene name Description MCF7
MDA-MB-468
NM_019093 UGT1A1/3/4/5/6/7/8/9/10 UDP glucuronosyltransferase 1, polypeptides A1/3/4/5/6/7/8/9/10 24.36 27.93
NM_000463 UGT1A1/4/6/8/9/10 UDP glucuronosyltransferase 1, polypeptides A1/4/6/8/9/10 15.31 17.66
NM_021027 UGT1A1/4/6/8/9/10 UDP glucuronosyltransferase 1, polypeptides A1/4/6/8/9/10 13.55 17.05
NM_001072 UGT1A1/3/4/5/6/7/8/9/10 UDP glucuronosyltransferase 1, polypeptides A1/3/4/5/6/7/8/9/10 13.21 16.88 AV691323 UGT1A1/3/4/5/6/7/8/9/10 UDP glucuronosyltransferase 1, polypeptides A1/3/4/5/6/7/8/9/10 13.05 16.82 Genes differentially expressed by at least twofold with a P-value <0.05 including multiple testing correction were compared between MCF7 and MDA-MB-468 cells as described in Table 3.
T Taabbllee 55 G
Geenneess ddiiffffeerreennttiiaallllyy eexxpprreesssseedd iinn ccoommmmoonn aammoonngg ccoolloonn ccaanncceerr cceellll lliinneess rreessiissttaanntt ttoo MMTTXX
GenBank Gene name Description Ratio MIA PaCa-2 Ratio K562 Ratio Saos-2
BC003584 DHFR Dihydrofolate reductase 16.97 17.78 4.06
BC000192 DHFR Dihydrofolate reductase 12.56 13.57 5.28
AI144299 DHFR Dihydrofolate reductase 12.1 9.45 8.94
NM_000791 DHFR Dihydrofolate reductase 9.66 6.76 5.57
BE622627 PIK3R3 Phosphoinositide-3-kinase, regulatory subunit 3 5.23 2.09 4.44
AW469790 EEF1A1 Eukaryotic translation elongation factor 1 alpha 1 2.29 2.75 2.05
NM_012446 SSBP2 Single-stranded DNA binding protein 2 2.2 5.04 2.03
AF318326 APG10L ATG10 autophagy related 10 homolog 2.08 7.39 2.19
F Fiigguurree 22
BANs of differentially expressed genes in common between cell lines. The lists of common genes between both colon cancer cell lines, between both breast cancer cell lines, and among the other three cell lines studied (representative of pancreatic cancer, leukemia and osteosarcoma) were used to construct BANs with the Pathway Architect software. Expanded networks were constructed for each list - ((aa)) colon cancer, ((bb)) breast cancer and ((cc)) the other three cell lines - by setting an advanced filter that included the categories of binding, expression, metabolism, promoter binding, protein
modification and regulation (see legend). Only proteins are represented. Overlapping of the expression levels was also performed (red for overexpressed genes and green for underexpressed genes; translucent shading represents genes that were not in the list and were added by the program from the interactions database). The BANs show some node genes that were studied further (those with arrows pointing to them).
(a)
F Fiigguurree 33
BAN of all common genes. A BAN was constructed as previously described with all the genes included in any of the three lists of common genes (encircled in blue). Genes added by the program from the interaction database are not outlined. Node genes are those with arrows pointing to them.
D
Diissccu
ussssiio
on
n
The main objective of this work was to explore whether node genes could be identified from BANs constructed starting from genes differentially expressed in MTX-resistant cells from different human cancer cell lines, representative of five tissues. Those putative node genes may then be used as targets to increase the sensitivity toward MTX.
We started by determining and comparing the patterns of differential gene expression associated with MTX resistance in seven cell lines. The only differentially expressed gene in
common among all the cell lines studied was dhfr. Its
over-expression, at both the mRNA and protein levels, was confirmed in the MTX-resistant cells studied. The mRNA upregulation can be explained either by gene amplification
of the dhfr locus, a well recognized mechanism for MTX
resistance [15-17], or by an increase of dhfr transcription
rate. In accordance with this, HT29, CaCo-2, MCF-7 and
MIA PACA-2 resistant cells display an increased dhfrcopy
number. Indeed, amplification of the 5q14 locus, including
dhfrand flanking genes, has been described in HT29
MTX-resistant cells [13]. On the other hand, the other cell lines
studied bear no changes in dhfrcopy number. Thus, drug
resistance in MDA-MB-468, K562 and Saos-2 cells may be caused by any of the other known mechanisms for MTX resistance [18-22]. Additionally, one has to take into account that MTX causes the differential expression of many genes that may be direct or indirect regulators of cell proliferation, survival or apoptosis, and that this expression pattern can contribute to modulation of the resistance phenotype. As
described in this work, the overexpression of DKK1, UGT1As
or EEF1A1could represent a mechanism, parallel to DHFR
overexpression, that plays a role in MTX resistance; the possible contribution of the overexpression of each of these
genes is addressed below. Other work has determined genes that correlate with the capability of parental cells to resist treatment using concentrations assessed to be clinically achievable in tumor tissue [23]. Although this approach is different to the goal of our work, to identify genes differen-tially expressed in cells with acquired resistance to high concentrations of MTX, we compared the results obtained by
Gyorffy et al. [23] with ours and found only six genes in
common, namely CD99, CKMT1, DHRS2, IGFBP7, MAP7
and MYO1E.
Hierarchical clustering of all samples indicated that the MTX-resistant cells and their sensitive counterparts were highly correlated with regards to gene expression with each other. This is in accordance with reports showing that two breast tumor samples from the same patient before and after treatment with doxorubicin pair together in a hierarchical clustering [24]. Moreover, the same authors proposed that the molecular program of a primary tumor could generally be retained in its metastases. Similar results were obtained with leukemic cells from patients [25].
Interestingly, as shown in Figure 1, the gene expression patterns for the cell lines from the same tissue origin were very similar. Sets of coordinately expressed genes provide gene expression signatures that can indicate where to find targets suitable for gene therapy. Thus, we generated a list of genes differentially expressed in common between the two colon cancer cell lines. This list included, among others, genes encoding DHFR, the target for MTX, three members of the AKR family and ENO2, which we have previously studied as modulators of MTX resistance [8,13], and DKK1.
BAN construction using the genes differentially expressed in common between both colon cancer cell lines identified
DKK1as a highly interconnected node of the network, which
could as such be a candidate druggable gene. DKK1 is a secreted protein involved in embryonic development [26] and is classically considered to function as an inhibitor of the canonical Wnt signaling pathway [27] (see [28] for a review).
However, it does not take an active part in the Wnt/β
-catenin pathway in colon cancer cells, as mutation of adeno-matous polyposis coli (one of the components of Wnt path-way) occurs in most human colon cancers [29,30], thus disconnecting the effector part of the signaling cascade from the Wnt receptors, where DKK1 exerts its inhibitory effect [31,32]. This situation led us to hypothesize that DKK1 could have other cellular functions aside from its role in the Wnt pathway. Indeed, a role for DKK1 overexpression in cancer [26], including hepatobastomas [33] and breast cancer bone metastasis [34], aggressive tumors, epithelial-mesenchymal transition [35] and proliferation [36], has been previously suggested, although its precise mechanism of action has not yet been elucidated. In the case of HT29 MTX-resistant cells, the role of DKK1 is unclear, although it seems to be related to the resistant phenotype, since treatment with the siRNA T
Taabbllee 66 V
Vaalliiddaattiioonn ooff DDKKKK11,, UUGGTT11AA aanndd EEEEFF11AA11 oovveerreexxpprreessssiioonn iinn tthhee rreessiissttaanntt cceellllss
Expression
Gene Cell line Microarray RT-PCR validation
DKK1 HT29 4.25 5.66 ± 0.23
Caco-2 2.56 1.96 ± 0.03
UGT1A MCF-7 15.90 23.41 ± 0.94
MDA-MB-468 19.27 16.28 ± 0.19
EEF1A1 MIA PaCa-2 2.29 3.89 ± 0.16
K562 2.75 2.38 ± 0.47
Saos-2 2.05 1.85 ± 0.15
against DKK1 mRNA showed a chemosensitization toward MTX. In keeping with this, Katula and collaborators [37] showed that folate deficiency led to the downregulation of
DKK1, and that MTX inhibited DKK1transcription. Thus,
DKK1 overexpression in HT29 MTX-resistant cells could
constitute a mechanism to overcome the transcriptional repression exerted by MTX.
It is worth noting that we had previously proposed the activation of the Wnt/ß-catenin pathway to be an important step in MTX resistance in HT29 colon cancer cells [13]. In this cell line, E-cadherin is chromosomically lost and
underexpressed, thus allowing β-catenin to play its function
in gene transcription. In order to shed some light on the
possible role of the Wnt pathway in the overexpression of
DKK1in HT29 resistant cells, we performed transient
trans-fection experiments with a luciferase reporter of β
-catenin-mediated transcriptional activation. These experiments showed that the Wnt pathway was more active in the HT29 resistant cells than in HT29 sensitive cells, and that re-expression of E-cadherin in the resistant cells resulted in
lower β-catenin-mediated transcriptional activation, probably
due to recruitment of β-catenin to the adherent junctions.
Interestingly, DKK1is transcriptionally regulated by Wnt/β
-catenin signaling. Thus, constitutive activation of this
signal-ing pathway through β-catenin, downstream of
adenoma-tous polyposis coli, could represent a mechanism for DKK1
overexpression in HT29 MTX-resistant cells. F
Fiigguurree 44
Effects on MTX sensitivity of treatment with siRNAs against DKK1, UGT1As or EEF1A1. ((aa--ff)) Treatment with siDKK1 was performed in HT29 cells (a,d), siUGT1A was transfected in MDA-MB-468 cells (b,e) and the effects of siEEF1A1 were determined in MIA PaCa-2 cells (c,f). Treatments were performed as described in Methods, and MTX was added after 48 h. Cell viability was determined 3 days after MTX treatment (d-f). (d-f) A siRNA against dhfr was transfected in each of the three cell lines, and its effects on cell viability are presented. For determination of mRNA levels, real-time RT-PCR was performed with 500 ng of total RNA extracted 48 h after siRNA transfection (a-c). All results are expressed as percentages relative to the non-related negative control siRNA (NR-siRNA). Values are the mean of three independent experiments ± SE. *P < 0.05, **P < 0.01 and ***P < 0.001.
(a)
* *
H T 29 cells
0 20 40 60 80 100 DKK1 m R N A le v e ls
NR-siR NA siDK K 1
(b)
0 20 40 60 80 100 U G T 1 A m R N A le v e lsNR-siR NA siUG T 1A
* *
M DA-M B-468 cells
NR-siR NA siE E F1A1
(c)
0 20 40 60 80 100 EEF 1 A 1 m R N A le v e ls* * *
M I A PaC a2 cells
siDK K 1
M T X siDH FR
(d)
-+ +-* -* -*
H T 29 cells
0 20 40 60 80 100 % v ia b ili ty +
-* -*
+ -+ -+ - - +M I A PaC a2 cells
0 20 40 60 80 100 % v ia b ili ty -+ + -siE E F1A1
M T X siDH FR + -+ -+ -+ - - +
* *
* * *
siUG T 1A
M T X siDH FR
(e)
*
M DA-M B-468 cells
UGT1As were the only genes differentially expressed in common between both breast cancer cell lines analyzed. UGTs comprise a family of membrane glycoproteins that come from one single gene located on chromosome 2q37, rendering nine functional UGT1A proteins by alternative splicing of 13 different first exons with the common exons 2 to 5 [38]. UGTs are involved in phase II metabolism of a wide range of metabolites, both endogenous and exogenous [39]. Glucuronidation is an important metabolic process, as it carries out the biotransformation of lipophilic substrates into hydrophilic glucuronides, which can be more easily removed from the body. Among the different products that can undergo glucuronidation, we find analgesics, sex hormones, flavonoids, rifampicin, bilirubin and tobacco-specific carcinogens [40,41]. Some anticancer drugs, such as topotecan, irinotecan, SN-38 (the active metabolite of irinotecan), doxorubicin and 4-hydroxytamoxifen, have also been described to be substrates of UGT1A activity [42-47]. Metabolism by UGT1A family members has been described to induce resistance toward daunorubicin (in both cell lines and rat hyperplastic liver nodules) [48,49], mycophenolic acid [50,51], mitoxantrone [52], SN-38 [53,54], camptothecin [55] and other drugs [56,57]. Indeed, drug inactivation by metabolism within tumor cells is recognized as an important mechanism of drug
resistance, and, specifically, glucuronidation by UGT enzymes has been proposed to contribute to multidrug resistance of several chemotherapeutic drugs [56]. From our results using a
siRNA against UGT1AmRNA we can point out a role for this
family of genes in MTX resistance in MDA-MB-468 breast
cancer cells. In fact, Hanioka et al. [58] reported that β
-naphthoflavone induced UGT1AmRNA levels. This could be a
feasible explanation for the UGT1A overexpression we
observed in the breast cancer MTX-resistant cells used in our study.
EEF1A1was overexpressed in common among MIA PaCa-2, K562 and Saos-2 resistant cell lines. EEF1A1 is a ubiquitously expressed protein elongation factor that recruits amino-acetylated tRNAs to the A site of the ribosome (see [59] for a review). Although it has been traditionally described as a cellular housekeeper enzyme, overexpression of EEF1A1 is found in melanomas and tumors of the pancreas, breast, lung, prostate and colon [59,60]. It has been demonstrated that EEF1A expression is related to increased cell proliferation [61,62], oncogenic transformation [63], delayed cell senescence [64] and metastasis [65]. Moreover, increased EEF1A1 expression has been related to cisplatin [66], doxorubicin [67] and MTX resistance [68], maybe due to its ability to inhibit apoptosis [69]. It has been proposed that EEF1A overexpression promotes cell growth and replication by contributing to an overall increase in protein translation.
Antisense-mediated abrogation of EEF1A1expression inhibits
tumorigenesis and anchorage-independent cell replication in prostate tumor cells [70]. Our functional analyses using siRNA
technology against EEF1A1are in keeping with these results,
and show a chemosensitization of MIA PaCa-2 cells, thus stating a role for EEF1A1 in MTX resistance in this cell line.
In summary, our results provide evidence that node genes can be identified by constructing BANs with lists of genes differentially expressed in common between cell lines resistant to MTX. RNA interference technology has enabled us to demonstrate a role for DKK1, UGT1As and EEF1A1 in MTX resistance.
C
Co
on
nccllu
ussiio
on
nss
BANs were constructed using genes differentially expressed in common between cells resistant to MTX from seven human cancer cell lines representative of five tissues. We have been able to identify important node genes in the BANs, namely
DKK1in colon cancer cells, UGT1As in breast cancer cells and
EEF1A1 in pancreatic cancer, leukemia and osteosarcoma cells. These three genes were functionally validated using siRNAs against their respective mRNAs, which resulted in increased sensitivity to MTX.
F Fiigguurree 55
Transcriptional activation of the Wnt pathway in MTX-resistant cells leads to DKK1 overexpression. HT29 cells, either sensitive or resistant, were transiently transfected with 1mg of a luciferase reporter of b-catenin-mediated transcriptional activation (TOPFLASH) using Fugene™ HD in the presence or absence of 2 mg of E-cadherin expression vector (pBATEM2-CDH). Thirty hours after transfection, luciferase activity (relative light units (RLU)) was assayed. The protein content was used to normalize the luciferase activity for each sample and is expressed relative to that of pGL3 basic vector (mean ± standard error of the mean for triplicate wells). *P < 0.05.
0 5 10 15 20 25 30
Transcriptional activation
RLU/protein
Sensitive Resistant
* *
T O PFL ASH (µg) 1
2
-1
pB A T E M 2- C DH (µg)
-A
Ab
bb
brre
evviiaattiio
on
nss
APRT = Adenine Phosphoribosyltransferase; BAN = biological association network; DHFR = dihydrofolate reductase; DKK1 = Dikkopf homolog 1; EEF1A1 = eukaryotic translation elongation factor 1 alpha 1; MTT = 3-(4,5-Dimethylthiazol-2-yl)-2,5-diphenyltetrazolium bromide; MTX = methotrexate; NLP = Natural Language Processing; SE = standard error; siRNA = small interfering RNA; TCF = T-cell factor; UGT = UDP glucuronosyl transferase.
C
Co
om
mp
pe
ettiin
ngg iin
ntte
erre
essttss
The authors declare that they have no competing interests.
A
Au
utth
ho
orrss’’ cco
on
nttrriib
bu
uttiio
on
nss
ES participated in microarray data analyses, BAN generation and cell treatment with siRNAs. CO carried out the
determi-nation of DHFR mRNA levels, dhfr copy number and
protein levels. SR performed the luciferase experiments. CA generated MDA-MB-468 cells resistant to MTX. VN helped with data interpretation and drafting the manuscript, critically revising it. CJC conceived the study, participated in microarray data analyses and in BAN generation. All authors read and approved the final manuscript.
A
Ad
dd
diittiio
on
naall d
daattaa ffiille
ess
The following additional data are available with the online version of this paper: a table listing of genes differentially expressed at least twofold in HT29 MTX-resistant cells (Additional data file 1); a table listing genes differentially expressed at least twofold in Caco-2 MTX-resistant cells (Additional data file 2); a table listing genes differentially expressed at least twofold in MCF-7 MTX-resistant cells (Additional data file 3); a table listing genes differentially expressed at least twofold in MDA-MD-468 MTX-resistant cells (Additional data file 4); a table listing genes differentially expressed at least twofold in MIA PaCa-2 MTX-resistant cells (Additional data file 5); a table listing genes differentially expressed at least twofold in K562 MTX-resistant cells (Additional data file 6); a table listing genes differentially expressed at least twofold in Saos-2 MTX-resistant cells (Additional data file 7).
A
Acck
kn
no
ow
wlle
ed
dgge
em
me
en
nttss
This work was supported by grants SAF05-247 and SAF08-00043 from ‘Plan Nacional de I+D+I’, and ISCIII-RETIC RD06/0020. Our research group holds the ‘quality distinction’ from the ‘Generalitat de Catalunya’ SGR09-118. ES was a recipient of a fellowship from the ‘Ministerio de Ciencia y Tecnología’ (MCYT), CA is a recipient of a fellowship from the ‘Generalitat de Catalunya’, and CO is a recipient of a fellowship from ‘Federación Española del Café’. pBATEM2-CDH was a kind gift of Dr Duñach, Universitat Autonoma de Barcelona, Spain.
R
Re
effe
erre
en
ncce
ess
1. Huttenhower C, Flamholz AI, Landis JN, Sahi S, Myers CL, Olszewski KL, Hibbs MA, Siemers NO, Troyanskaya OG, Coller HA: NNeeaarreesstt N
Neeiigghhbboorr NNeettwwoorrkkss:: cclluusstteerriinngg eexxpprreessssiioonn ddaattaa bbaasseedd oonn ggeennee nneeiiggh h--b
boorrhhooooddss.. BMC Bioinformatics 2007, 88::250.
2. Yu JX, Sieuwerts AM, Zhang Y, Martens JW, Smid M, Klijn JG, Wang Y, Foekens JA: PPaatthhwwaayy aannaallyyssiiss ooff ggeennee ssiiggnnaattuurreess pprreeddiiccttiinngg mme ettaass--ttaassiiss ooff nnooddee--nneeggaattiivvee pprriimmaarryy bbrreeaasstt ccaanncceerr.. BMC Cancer 2007, 7
7::182.
3. KKyyoottoo EEnnccyyccllooppeeddiiaa ooff GGeenneess aanndd GGeennoommeess [http://www. genome.jp/kegg/]
4. Dohr S, Klingenhoff A, Maier H, Hrabe de Angelis M, Werner T, Schneider R: LLiinnkkiinngg ddiisseeaassee--aassssoocciiaatteedd ggeenneess ttoo rreegguullaattoorryy nne ett--w
woorrkkss vviiaa pprroommootteerr oorrggaanniizzaattiioonn.. Nucleic Acids Res 2005, 333 3::864-872.
5. Brazhnik P, de la Fuente A, Mendes P: GGeennee nneettwwoorrkkss:: hhooww ttoo ppuutt tthhee ffuunnccttiioonn iinn ggeennoommiiccss.. Trends Biotechnol 2002, 2200::467-472. 6. Natarajan J, Berrar D, Dubitzky W, Hack C, Zhang Y, DeSesa C, Van
Brocklyn JR, Bremer EG: TTeexxtt mmiinniinngg ooff ffuullll--tteexxtt jjoouurrnnaall aarrttiicclleess ccoommbbiinneedd wwiitthh ggeennee eexxpprreessssiioonn aannaallyyssiiss rreevveeaallss aa rreellaattiioonnsshhiipp b
beettwweeeenn sspphhiinnggoossiinnee--11--pphhoosspphhaattee aanndd iinnvvaassiivveenneessss ooff aa gglliioobbllaassttoommaa cceellll lliinnee.. BMC Bioinformatics 2006, 77::373.
7. Melera PW: AAccqquuiirreedd vveerrssuuss iinnttrriinnssiicc rreessiissttaannccee ttoo mmeetthhoottrreexxaattee:: d
diivveerrssiittyy ooff tthhee ddrruugg--rreessiissttaanntt pphheennoottyyppee iinn mmaammmmaalliiaann cceellllss.. Semin Cancer Biol 1991, 22::245-255.
8. Selga E, Noe V, Ciudad CJ: TTrraannssccrriippttiioonnaall rreegguullaattiioonn ooff aallddoo--kkeettoo rreedduuccttaassee 11CC11 iinn HHTT2299 hhuummaann ccoolloonn ccaanncceerr cceellllss rreessiissttaanntt ttoo m
meetthhoottrreexxaattee:: rroollee iinn tthhee cceellll ccyyccllee aanndd aappooppttoossiiss.. Biochem Pharma-col 2008, 7755::414-426.
9. Rocke DM, Durbin B: AA mmooddeell ffoorr mmeeaassuurreemmeenntt eerrrroorr ffoorr ggeennee e
exxpprreessssiioonn aarrrraayyss.. J Comput Biol 2001, 88::557-569.
10. Bader GD, Donaldson I, Wolting C, Ouellette BF, Pawson T, Hogue CW: BBIINNDD -- TThhee BBiioommoolleeccuullaarr IInntteerraaccttiioonn NNeettwwoorrkk DDaattaabbaassee.. Nucleic Acids Res 2001, 2299::242-245.
11. Zanzoni A, Montecchi-Palazzi L, Quondam M, Ausiello G, Helmer-Citterich M, Cesareni G: MMIINNTT:: aa MMoolleeccuullaarr IINNTTeerraaccttiioonn ddaattaabbaassee.. FEBS Lett 2002, 551133::135-140.
12. Mosmann T: RRaappiidd ccoolloorriimmeettrriicc aassssaayy ffoorr cceelllluullaarr ggrroowwtthh aanndd ssu urr--vviivvaall:: aapppplliiccaattiioonn ttoo pprroolliiffeerraattiioonn aanndd ccyyttoottooxxiicciittyy aassssaayyss.. J Immunol Methods 1983, 6655::55-63.
13. Selga E, Morales C, Noe V, Peinado MA, Ciudad CJ: RRoollee ooff CCaavveeoolliinn 1
1,, EE--CCaaddhheerriinn,, EEnnoollaassee 22 aanndd PPKKCCaallpphhaa oonn rreessiissttaannccee ttoo mmeetthhoottrreex x--aattee iinn hhuummaann HHTT2299 ccoolloonn ccaanncceerr cceellllss.. BMC Med Genomics 2008, 1
1::35.
14. GGeennee EExxpprreessssiioonn OOmmnniibbuuss [http://www.ncbi.nlm.nih.gov/geo/] 15. Carman MD, Schornagel JH, Rivest RS, Srimatkandada S, Portlock
CS, Duffy T, Bertino JR: RReessiissttaannccee ttoo mmeetthhoottrreexxaattee dduuee ttoo ggeennee aammpplliiffiiccaattiioonn iinn aa ppaattiieenntt wwiitthh aaccuuttee lleeuukkeemmiiaa.. J Clin Oncol 1984, 2
2::16-20.
16. Curt GA, Cowan KH, Chabner BA: GGeennee aammpplliiffiiccaattiioonn iinn ddrruugg rre essiiss--ttaannccee:: ooff mmiiccee aanndd mmeenn.. J Clin Oncol 1984, 22::62-64.
17. Alt FW, Kellems RE, Schimke RT: SSyynntthheessiiss aanndd ddeeggrraaddaattiioonn ooff ffoollaattee rreedduuccttaassee iinn sseennssiittiivvee aanndd mmeetthhoottrreexxaattee--rreessiissttaanntt lliinneess ooff SS--118800 cceellllss.. J Biol Chem 1976, 225511::3063-3074.
18. Yu M, Melera PW: AAlllleelliicc vvaarriiaattiioonn iinn tthhee ddiihhyyddrrooffoollaattee rreedduuccttaassee ggeennee aatt aammiinnoo aacciidd ppoossiittiioonn 9955 ccoonnttrriibbuutteess ttoo aannttiiffoollaattee rreessiissttaannccee iinn C
Chhiinneessee hhaammsstteerr cceellllss.. Cancer Res 1993, 5533::6031-6035.
19. Srimatkandada S, Schweitzer BI, Moroson BA, Dube S, Bertino JR: A
Ammpplliiffiiccaattiioonn ooff aa ppoollyymmoorrpphhiicc ddiihhyyddrrooffoollaattee rreedduuccttaassee ggeennee e
exxpprreessssiinngg aann eennzzyymmee wwiitthh ddeeccrreeaasseedd bbiinnddiinngg ttoo mmeetthhoottrreexxaattee iinn aa h
huummaann ccoolloonn ccaarrcciinnoommaa cceellll lliinnee,, HHCCTT--88RR44,, rreessiissttaanntt ttoo tthhiiss ddrruugg.. J Biol Chem 1989, 226644::3524-3528.
20. Jansen G, Mauritz R, Drori S, Sprecher H, Kathmann I, Bunni M, Priest DG, Noordhuis P, Schornagel JH, Pinedo HM, Peters GJ, Assaraf YG: AA ssttrruuccttuurraallllyy aalltteerreedd hhuummaann rreedduucceedd ffoollaattee ccaarrrriieerr wwiitthh iinnccrreeaasseedd ffoolliicc aacciidd ttrraannssppoorrtt mmeeddiiaatteess aa nnoovveell mmeecchhaanniissmm ooff aannttiiffo o--llaattee rreessiissttaannccee.. J Biol Chem 1998, 227733::30189-30198.
21. Roy K, Tolner B, Chiao JH, Sirotnak FM: AA ssiinnggllee aammiinnoo aacciidd ddiiffffe err--e
ennccee wwiitthhiinn tthhee ffoollaattee ttrraannssppoorrtteerr eennccooddeedd bbyy tthhee mmuurriinnee RRFFCC--11 ggeennee sseelleeccttiivveellyy aalltteerrss iittss iinntteerraaccttiioonn wwiitthh ffoollaattee aannaalloogguueess.. IImmp plliiccaa--ttiioonnss ffoorr iinnttrriinnssiicc aannttiiffoollaattee rreessiissttaannccee aanndd ddiirreeccttiioonnaall oorriieennttaattiioonn ooff tthhee ttrraannssppoorrtteerr wwiitthhiinn tthhee ppllaassmmaa mmeemmbbrraannee ooff ttuummoorr cceellllss.. J Biol Chem 1998, 227733::2526-2531.
22. Zhao R, Sharina IG, Goldman ID: PPaatttteerrnn ooff mmuuttaattiioonnss tthhaatt rreessuullttss iinn lloossss ooff rreedduucceedd ffoollaattee ccaarrrriieerr ffuunnccttiioonn uunnddeerr aannttiiffoollaattee sseelleeccttiivvee p
prreessssuurree aauuggmmeenntteedd bbyy cchheemmiiccaall mmuuttaaggeenneessiiss.. Mol Pharmacol 1999, 5
23. Gyorffy B, Surowiak P, Kiesslich O, Denkert C, Schafer R, Dietel M, Lage H: GGeennee eexxpprreessssiioonn pprrooffiilliinngg ooff 3300 ccaanncceerr cceellll lliinneess pprreeddiiccttss rreessiissttaannccee ttoowwaarrddss 1111 aannttiiccaanncceerr ddrruuggss aatt cclliinniiccaallllyy aacchhiieevveedd ccoonncceen n--ttrraattiioonnss.. Int J Cancer 2006, 111188::1699-1712.
24. Perou CM, Sorlie T, Eisen MB, van de Rijn M, Jeffrey SS, Rees CA, Pollack JR, Ross DT, Johnsen H, Akslen LA, Fluge O, Pergamen-schikov A, Williams C, Zhu SX, Lonning PE, Borresen-Dale AL, Brown PO, Botstein D: MMoolleeccuullaarr ppoorrttrraaiittss ooff hhuummaann bbrreeaasstt ttuummoouurrss.. Nature 2000, 440066::747-752.
25. Alizadeh AA, Eisen MB, Davis RE, Ma C, Lossos IS, Rosenwald A, Boldrick JC, Sabet H, Tran T, Yu X, Powell JI, Yang L, Marti GE, Moore T, Hudson J Jr, Lu L, Lewis DB, Tibshirani R, Sherlock G, Chan WC, Greiner TC, Weisenburger DD, Armitage JO, Warnke R, Levy R, Wilson W, Grever MR, Byrd JC, Botstein D, Brown PO, et al.: DDiissttiinncctt ttyyppeess ooff ddiiffffuussee llaarrggee BB--cceellll llyymmpphhoommaa iiddeennttiiffiieedd bbyy ggeennee e
exxpprreessssiioonn pprrooffiilliinngg.. Nature 2000, 440033::503-511.
26. Forget MA, Turcotte S, Beauseigle D, Godin-Ethier J, Pelletier S, Martin J, Tanguay S, Lapointe R: TThhee WWnntt ppaatthhwwaayy rreegguullaattoorr DDKKKK11 iiss pprreeffeerreennttiiaallllyy eexxpprreesssseedd iinn hhoorrmmoonnee--rreessiissttaanntt bbrreeaasstt ttuummoouurrss aanndd iinn ssoommee ccoommmmoonn ccaanncceerr ttyyppeess.. Br J Cancer 2007, 9966::646-653. 27. Rothbacher U, Lemaire P: CCrreemmee ddee llaa KKrreemmeenn ooff WWnntt ssiiggnnaalllliinngg
iinnhhiibbiittiioonn.. Nat Cell Biol 2002, 44::E172-173.
28. Nelson WJ, Nusse R: CCoonnvveerrggeennccee ooff WWnntt,, bbeettaa--ccaatteenniinn,, aanndd ccaad d--h
heerriinn ppaatthhwwaayyss.. Science 2004, 330033::1483-1487.
29. Polakis P: WWnntt ssiiggnnaalliinngg aanndd ccaanncceerr.. Genes Dev 2000, 1144::1837-1851. 30. Gonzalez-Sancho JM, Aguilera O, Garcia JM, Pendas-Franco N, Pena
C, Cal S, Garcia de Herreros A, Bonilla F, Munoz A: TThhee WWnntt aan nttaagg--o
onniisstt DDIICCKKKKOOPPFF--11 ggeennee iiss aa ddoowwnnssttrreeaamm ttaarrggeett ooff bbeettaa--ccaatteenniinn//TTCCFF aanndd iiss ddoowwnnrreegguullaatteedd iinn hhuummaann ccoolloonn ccaanncceerr.. Oncogene 2005, 2
244::1098-1103.
31. Semenov MV, Tamai K, Brott BK, Kuhl M, Sokol S, He X: HHeeaadd iinndduucceerr DDiicckkkkooppff--11 iiss aa lliiggaanndd ffoorr WWnntt ccoorreecceeppttoorr LLRRPP66.. Curr Biol 2001, 1111::951-961.
32. Mao B, Wu W, Davidson G, Marhold J, Li M, Mechler BM, Delius H, Hoppe D, Stannek P, Walter C, Glinka A, Niehrs C: KKrreemmeenn pprro o--tteeiinnss aarree DDiicckkkkooppff rreecceeppttoorrss tthhaatt rreegguullaattee WWnntt//bbeettaa--ccaatteenniinn ssiigg--n
naalllliinngg.. Nature 2002, 441177::664-667.
33. Koch A, Waha A, Hartmann W, Hrychyk A, Schuller U, Wharton KA Jr., Fuchs SY, von Schweinitz D, Pietsch T: EElleevvaatteedd eexxpprreessssiioonn ooff W
Wnntt aannttaaggoonniissttss iiss aa ccoommmmoonn eevveenntt iinn hheeppaattoobbllaassttoommaass.. Clin Cancer Res 2005, 1111::4295-4304.
34. Voorzanger-Rousselot N, Goehrig D, Journe F, Doriath V, Body JJ, Clezardin P, Garnero P: IInnccrreeaasseedd DDiicckkkkooppff--11 eexxpprreessssiioonn iinn bbrreeaasstt ccaanncceerr bboonnee mmeettaassttaasseess.. Br J Cancer 2007, 9977::964-970.
35. Monaghan AP, Kioschis P, Wu W, Zuniga A, Bock D, Poustka A, Delius H, Niehrs C: DDiicckkkkooppff ggeenneess aarree ccoo--oorrddiinnaatteellyy eexxpprreesssseedd iinn m
meessooddeerrmmaall lliinneeaaggeess.. Mech Dev 1999, 8877::45-56.
36. Gregory CA, Singh H, Perry AS, Prockop DJ: TThhee WWnntt ssiiggnnaalliinngg iinnhhiibbiittoorr ddiicckkkkooppff--11 iiss rreeqquuiirreedd ffoorr rreeeennttrryy iinnttoo tthhee cceellll ccyyccllee ooff h
huummaann aadduulltt sstteemm cceellllss ffrroomm bboonnee mmaarrrrooww.. J Biol Chem 2003, 2
27788::28067-28078.
37. Katula KS, Heinloth AN, Paules RS: FFoollaattee ddeeffiicciieennccyy iinn nnoorrmmaall h
huummaann ffiibbrroobbllaassttss lleeaaddss ttoo aalltteerreedd eexxpprreessssiioonn ooff ggeenneess pprriimmaarriillyy lliinnkkeedd ttoo cceellll ssiiggnnaalliinngg,, tthhee ccyyttoosskkeelleettoonn aanndd eexxttrraacceelllluullaarr mmaattrriixx.. J Nutr Biochem 2007, 1188::541-552.
38. Mackenzie PI, Owens IS, Burchell B, Bock KW, Bairoch A, Belanger A, Fournel-Gigleux S, Green M, Hum DW, Iyanagi T, Lancet D, Louisot P, Magdalou J, Chowdhury JR, Ritter JK, Schachter H, Tephly TR, Tipton KF, Nebert DW: TThhee UUDDPP ggllyyccoossyyllttrraannssffeerraassee ggeennee ssuuppeerrffaammiillyy:: rreeccoommmmeennddeedd nnoommeennccllaattuurree uuppddaattee bbaasseedd oonn eevvoollu u--ttiioonnaarryy ddiivveerrggeennccee.. Pharmacogenetics 1997, 77::255-269.
39. Guillemette C: PPhhaarrmmaaccooggeennoommiiccss ooff hhuummaann UUDDPP--gglluuccuurroonno o--ssyyllttrraannssffeerraassee eennzzyymmeess.. Pharmacogenomics J 2003, 33::136-158. 40. Strassburg CP, Manns MP, Tukey RH: EExxpprreessssiioonn ooff tthhee UUDDPP--ggllu
u--ccuurroonnoossyyllttrraannssffeerraassee 11AA llooccuuss iinn hhuummaann ccoolloonn.. IIddeennttiiffiiccaattiioonn aanndd cchhaarraacctteerriizzaattiioonn ooff tthhee nnoovveell eexxttrraahheeppaattiicc UUGGTT11AA88.. J Biol Chem 1998, 227733::8719-8726.
41. Kiang TK, Ensom MH, Chang TK: UUDDPP--gglluuccuurroonnoossyyllttrraannssffeerraasseess aanndd cclliinniiccaall ddrruugg--ddrruugg iinntteerraaccttiioonnss.. Pharmacol Ther 2005, 110066::97-132. 42. Nagar S, Remmel RP: UUrriiddiinnee ddiipphhoosspphhoogglluuccuurroonnoossyyllttrraannssffeerraassee
p
phhaarrmmaaccooggeenneettiiccss aanndd ccaanncceerr.. Oncogene 2006, 2255::1659-1672. 43. McCague R, Parr IB, Leclercq G, Leung OT, Jarman M: MMeettaabboolliissmm ooff
ttaammooxxiiffeenn bbyy iissoollaatteedd rraatt hheeppaattooccyytteess.. IIddeennttiiffiiccaattiioonn ooff tthhee ggllu u--ccuurroonniiddee ooff 44--hhyyddrrooxxyyttaammooxxiiffeenn.. Biochem Pharmacol 1990, 339 9::1459-1465.
44. Platzer P, Schaden S, Thalhammer T, Hamilton G, Rosenberg B, Sil-goner I, Jager W: BBiioottrraannssffoorrmmaattiioonn ooff ttooppootteeccaann iinn tthhee iissoollaatteedd ppe
err--ffuusseedd rraatt lliivveerr:: iiddeennttiiffiiccaattiioonn ooff tthhrreeee nnoovveell mmeettaabboolliitteess.. Anticancer Res 1998, 1188::2695-2700.
45. Rosing H, van Zomeren DM, Doyle E, Bult A, Beijnen JH: OO--ggllu u--ccuurroonniiddaattiioonn,, aa nneewwllyy iiddeennttiiffiieedd mmeettaabboolliicc ppaatthhwwaayy ffoorr ttooppootteeccaann aanndd NN--ddeessmmeetthhyyll ttooppootteeccaann.. Anticancer Drugs 1998, 99::587-592. 46. Andersen A, Holte H, Slordal L: PPhhaarrmmaaccookkiinneettiiccss aanndd mmeettaabboolliissmm ooff
d
dooxxoorruubbiicciinn aafftteerr sshhoorrtt--tteerrmm iinnffuussiioonnss iinn llyymmpphhoommaa ppaattiieennttss.. Cancer Chemother Pharmacol 1999, 4444::422-426.
47. Iyer L, King CD, Whitington PF, Green MD, Roy SK, Tephly TR, Coffman BL, Ratain MJ: GGeenneettiicc pprreeddiissppoossiittiioonn ttoo tthhee mmeettaabboolliissmm ooff iirriinnootteeccaann ((CCPPTT--1111)).. RRoollee ooff uurriiddiinnee ddiipphhoosspphhaattee gglluuccuurroonnoossyyllttrraan nss--ffeerraassee iissooffoorrmm 11AA11 iinn tthhee gglluuccuurroonniiddaattiioonn ooff iittss aaccttiivvee mmeettaabboolliittee ((SSNN--3388)) iinn hhuummaann lliivveerr mmiiccrroossoommeess.. J Clin Invest 1998, 110011::847-854. 48. Cowan KH, Batist G, Tulpule A, Sinha BK, Myers CE: SSiimmiillaarr bbiio
o--cchheemmiiccaall cchhaannggeess aassssoocciiaatteedd wwiitthh mmuullttiiddrruugg rreessiissttaannccee iinn hhuummaann b
brreeaasstt ccaanncceerr cceellllss aanndd ccaarrcciinnooggeenn--iinndduucceedd rreessiissttaannccee ttoo xxeennoobbiioottiiccss iinn rraattss.. Proc Natl Acad Sci U S A 1986, 8833::9328-9332.
49. Gessner T, Vaughan LA, Beehler BC, Bartels CJ, Baker RM: EElleevvaatteedd p
peennttoossee ccyyccllee aanndd gglluuccuurroonnyyllttrraannssffeerraassee iinn ddaauunnoorruubbiicciinn--rreessiissttaanntt P
P338888 cceellllss.. Cancer Res 1990, 5500::3921-3927.
50. Franklin TJ, Jacobs V, Jones G, Ple P, Bruneau P: GGlluuccuurroonniiddaattiioonn aassssoocciiaatteedd wwiitthh iinnttrriinnssiicc rreessiissttaannccee ttoo mmyyccoopphheennoolliicc aacciidd iinn hhuummaann ccoolloorreeccttaall ccaarrcciinnoommaa cceellllss.. Cancer Res 1996, 5566::984-987.
51. Franklin TJ, Jacobs VN, Jones G, Ple P: HHuummaann ccoolloorreeccttaall ccaarrcciinnoommaa cceellllss iinn vviittrroo aass aa mmeeaannss ttoo aasssseessss tthhee mmeettaabboolliissmm ooff aannaallooggss ooff m
myyccoopphheennoolliicc aacciidd.. Drug Metab Dispos 1997, 2255::367-370.
52. Rekha GK, Sladek NE: MMuullttiieennzzyymmee--mmeeddiiaatteedd ssttaabbllee aanndd ttrraannssiieenntt m
muullttiiddrruugg rreessiissttaannccee aanndd ccoollllaatteerraall sseennssiittiivviittyy iinndduucceedd bbyy xxeennoobbiioottiiccss.. Cancer Chemother Pharmacol 1997, 4400::215-224.
53. Takahashi T, Fujiwara Y, Yamakido M, Katoh O, Watanabe H, Mackenzie PI: TThhee rroollee ooff gglluuccuurroonniiddaattiioonn iinn 77--eetthhyyll--1100--hhyyddrroox xyy--ccaammppttootthheecciinn rreessiissttaannccee iinn vviittrroo.. Jpn J Cancer Res 1997, 888 8::1211-1217.
54. Cummings J, Ethell BT, Jardine L, Boyd G, Macpherson JS, Burchell B, Smyth JF, Jodrell DI: GGlluuccuurroonniiddaattiioonn aass aa mmeecchhaanniissmm ooff iinnttrriinnssiicc d
drruugg rreessiissttaannccee iinn hhuummaann ccoolloonn ccaanncceerr:: rreevveerrssaall ooff rreessiissttaannccee bbyy ffoooodd aaddddiittiivveess.. Cancer Res 2003, 6633::8443-8450.
55. Brangi M, Litman T, Ciotti M, Nishiyama K, Kohlhagen G, Takimoto C, Robey R, Pommier Y, Fojo T, Bates SE: CCaammppttootthheecciinn rreessiissttaannccee:: rroollee ooff tthhee AATTPP--bbiinnddiinngg ccaasssseettttee ((AABBCC)),, mmiittooxxaannttrroonnee--rreessiissttaannccee h
haallff--ttrraannssppoorrtteerr ((MMXXRR)),, aanndd ppootteennttiiaall ffoorr gglluuccuurroonniiddaattiioonn iinn MMXXR R--e
exxpprreessssiinngg cceellllss.. Cancer Res 1999, 5599::5938-5946.
56. Meijerman I, Beijnen JH, Schellens JH: CCoommbbiinneedd aaccttiioonn aanndd rreeggu ullaa--ttiioonn ooff pphhaassee IIII eennzzyymmeess aanndd mmuullttiiddrruugg rreessiissttaannccee pprrootteeiinnss iinn mmu ull--ttiiddrruugg rreessiissttaannccee iinn ccaanncceerr.. Cancer Treat Rev 2008, 3344::505-520. 57. Zembutsu H, Ohnishi Y, Tsunoda T, Furukawa Y, Katagiri T, Ueyama
Y, Tamaoki N, Nomura T, Kitahara O, Yanagawa R, Hirata K, Naka-mura Y: GGeennoommee--wwiiddee ccDDNNAA mmiiccrrooaarrrraayy ssccrreeeenniinngg ttoo ccoorrrreellaattee ggeennee eexxpprreessssiioonn pprrooffiilleess wwiitthh sseennssiittiivviittyy ooff 8855 hhuummaann ccaanncceerr x
xeennooggrraaffttss ttoo aannttiiccaanncceerr ddrruuggss.. Cancer Res 2002, 6622::518-527. 58. Hanioka N, Obika N, Nishimura M, Jinno H, Tanaka-Kagawa T, Saito
K, Kiryu K, Naito S, Narimatsu S: IInndduucciibbiilliittyy ooff UUDDPP--gglluuccuurroonno ossyyll--ttrraannssffeerraassee 11AAss bbyy bbeettaa--nnaapphhtthhooffllaavvoonnee iinn HHeeppGG22 cceellllss.. Food Chem Toxicol 2006, 4444::1251-1260.
59. Thornton S, Anand N, Purcell D, Lee J: NNoott jjuusstt ffoorr hhoouusseekkee