R E S E A R C H
Open Access
Using Apache Spark on genome
assembly for scalable overlap-graph
reduction
Alexander J. Paul
1, Dylan Lawrence
2, Myoungkyu Song
3, Seung-Hwan Lim
4, Chongle Pan
5and Tae-Hyuk Ahn
1,6*FromIEEE International Conference on Bioinformatics and Biomedicine 2018 Madrid, Spain. 3-6 December 2018
Abstract
Background: De novo genome assembly is a technique that builds the genome of a specimen using overlaps of genomic fragments without additional work with reference sequence. Sequence fragments (called reads) are assembled as contigs and scaffolds by the overlaps. The quality of the de novo assembly depends on the length and continuity of the assembly. To enable faster and more accurate assembly of species, existing sequencing techniques have been proposed, for example, high-throughput next-generation sequencing and long-reads-producing third-generation sequencing. However, these techniques require a large amounts of computer memory when very huge-size overlap graphs are resolved. Also, it is challenging for parallel computation.
Results: To address the limitations, we propose an innovative algorithmic approach, calledScalableOverlap-graph
ReductionAlgorithms (SORA). SORA is an algorithm package that performs string graph reduction algorithms by Apache Spark. The SORA’s implementations are designed to execute de novo genome assembly on either a single machine or a distributed computing platform. SORA efficiently compacts the number of edges on enormous graphing paths by adapting scalable features of graph processing libraries provided by Apache Spark, GraphX and GraphFrames.
Conclusions: We shared the algorithms and the experimental results at our project website,https://github.com/ BioHPC/SORA. We evaluated SORA with the human genome samples. First, it processed a nearly one billion edge graph on a distributed cloud cluster. Second, it processed mid-to-small size graphs on a single workstation within a short time frame. Overall, SORA achieved the linear-scaling simulations for the increased computing instances.
Keywords: Graph reduction, Apache spark, Genome assembly, Cloud computing, Overlap-layout-consensus
Background
Next-generation sequencing (NGS) refers high-throughput and in-parallel DNA sequencing technologies developed around 2007 after the Sanger DNA sequencing method first emerged in 1977 [1]. NGS technologies are different from the long dominated Sanger method in that NGS provides massive sequencing analysis with being
*Correspondence:[email protected]
1Bioinformatics and Computational Biology Program, Saint Louis University, St. Louis, MO, USA
6Department of Computer Science, Saint Louis University, St. Louis, MO, USA Full list of author information is available at the end of the article
extremely high-throughput from multiple samples at much reduced cost. Following the introduction of NGS techniques [2, 3], prodigious changes have occurred in the biological and biomedical sciences, specifically in genomics [3]. With reductions in sequencing cost and increased throughput, read length, and read accuracy NGS has drastically recast DNA sequencing; however, NGS requires a significant body of sequencing data for analysis. As reported by previous studies, NGS faces several limitations [4]. For example, in comparison to the sequence length generated by first-generation Sanger sequencing (500∼1000bp), fragmented DNA sequences
(i.e. reads) are generally shorter (50∼300bp). Recently developed third-generation sequencing techniques such as Pacific Bio-sciences (PacBio) and Oxford NanoPore provide much longer reads (up to 2 Mbp) to the consid-erable benefit of the assembly. However, NGS remains dominant due to its low cost and error rate.
Two different types are generally used for genome assembly: de novo assembly and reference-based assem-bly. De novo assembly is the process of finding overlaps and merging reads to complete genome sequence that is inherently challenging but essential to bioinformatics research [5]. Reference-based assembly can construct a new specimen genome with help of similar assembled genome. Third-generation sequencing can produce reads having nearly similar size of bacterial genomes that usu-ally are few Mbp long, but cannot generate full sequences of eukaryotic genomes up to several Gbp of length. For example, the haploid human genome size is over 3 Gbp and the Genome Reference Consortium Human Build 38 patch release 13 (GRCh38.p13) is the most recently released human genome assembly [6].
The elaboration of genome assembly stems from mul-tiple issues including heterozygosity and ploidy, affected mainly by the length and numbers of the reads. To assemble such large datasets, most de novo assembly programs are highly sensitive to the changes in time and space complexity. To account for both sensitivity and speed, most de novo genome assemblers commonly employed two assembly paradigms. One is overlap-layout-consensus (OLC) algorithm and the other is de Brui-jin graph (DBG) [7]. During the first-generation Sanger sequencing technique era, OLC approaches, i.e., Celera [8], reached accuracy adequate to accommodate the low sequencing depth and longer reads output. Newbler [9] that was designed for second-generation Roche / 454 Life Sciences sequences also adapted the OLC approach. The majority of OLC-based genome assemblies pro-duce the sequence assembly of whole, complex genomes using below steps. First, finding Overlaps between frag-ments or among all reads by using a graph model. Sec-ond, using the overlay-graph to construct a stretched Layout. Third, establishing the most probableConsensus sequence.
Various alternate approaches using DBG concept were proposed to assemble a genome with noticeably high-throughput and short reads from NGS technologies. Under NGS, DBG-based assemblers have been commonly employed to degrade reads into k-mers where a k-mer is a subsequence of a fixed-length, k. Various DBG-based assemblers including AbySS [10], Velvet [11] and SOAPdenovo [12] utilize memory-efficient DBG traver-sal to lessen the memory footprint of assembly includ-ing an efficient identification of redundant k-mers. As opposed to the less computationally efficient (e.g. costly
execution time and memory consumption per assembler) OLC-based approaches, most DBG-based assemblers reduce dependency on sequencing depth using a genome-sized graph at the cost of a larger memory overhead. The DBG-based approach achieves comparably fast overlap-ping computation for high-throughput short reads, while the OLC-based approach performs more advantageously for longer reads. Most of the DBG-based techniques adapt hashing algorithms that have a chance to acquire higher relative error rates but usually perform faster than the OLC-based approaches [13].
Lately, probabilistic algorithms utilizing the MinHash technique have been developed to efficiently identify multiple overlaps between long, noisy reads from third-generation sequencing data [14, 15]. Canu, as a succes-sor of the Celera assembler, was designed for long and noisy single-molecule sequences [15]. However, the com-putationally expensive overlap graphs produced by the assembly of raw or processed sequences must be simpli-fied or reduced. Several MPI-based scalable assemblies were proposed previously; including Abyss [10], Ray [16], and SWAP2-Assembler [17]. Apache Spark serves an a general purpose and open source and distribution com-puting engine for cluster based computation with pre-build libraries such as GraphX, MLlib (Machine Learning library), Spark Steaming, and so on [18, 19]. Utilizing data intensive cluster computation, Apache Spark pro-cesses large scale data quickly though efficient in-memory computation. Unlike the Apache Hadoop, a conventional cloud-based distributed processing framework, Spark can accelerate computational performance by up to 100 times compared to the Hadoop especially for interactive jobs and iterative analytics by cacheing datasets in memory. MPI is a popular framework for high performance parallel computing, but Spark provides an in-memory implemen-tation of MapReduce that is widely used in the big data industry.
three overlap-graph reduction algorithms:Transitive Edge Reduction,Dead-End Removal, andComposite Edge Con-traction. It presents a short turnaround time when pro-cessing a large-scale dataset consisting of a graph with nearly one billion edges on a distributed cloud comput-ing cluster or when processcomput-ing a smaller 8 million edge graph dataset on a local computing cluster. Spaler [20] is another GraphX and Apache Spark based de novo genome assembler utilizing DBG contraction and con-struction, but SORA is, to our knowledge, the first pro-posed Spark-based scalable assembler utilizing the OLC approach. Our previous studies [21, 22] were exten-sively extended in this paper. In detail, two primary goals are demonstrated in our benchmark results; (1) SORA actualizes a cloud scalable de novo genome assem-bler through leveraging Apache Spark graph processing libraries; (2) SORAdemonstrates the applicability of cloud computing infrastructure employing graphing algorithms to genome assembly and alternative biological applica-tions. The increasing popularity of Spark among compu-tational researchers has also influenced our decision to use Spark [23].
The remainder of the article is organized as follows. “Methods” section describes the OLC algorithm and Apache Spark, then presents SORA’s algorithms and the implementation in detail. “Results” section describes vari-ous experiments conducted to evaluate the scalability and usability of SORA using large and small scale datasets on cloud followed by Discussion and Conclusions.
Methods
Overlap-Layout-Consensus
The Overlap process, the initial step of OLC, focuses on finding overlaps of all reads using all-to-all pairwise alignments. To efficiently find overlaps between reads, the prefix/suffix technique is commonly used for overlap-based genome assembly [24]. This hash table approach allows a nearly constant time search when reads are small of all reads by their prefixes and suffixes. To efficiently search all overlapping reads with a readr, each proper sub-string of minimum overlap in readris found in the hash table, and every retrieved read is compared to the read r. Therefore, an overlap-graph that places reads as nodes and assigns edges between nodes whose corresponding reads overlap exceeds a specified cutoff is constructed by the Overlap step. As a result, the number of nodes will be proportionate to the number of unique reads, while the number of overlaps between reads will determine the number of edges.
During the Layout and Consensus steps, the manufac-tured overlap-graph is stretched and reduced into the most probable contiguous sequences, labeled, contigs. The Layout step acts as a Hamiltonian path problem where each read in the graph must be visited to generate
longer sequences. This is a computationally challenging problem caused by a large number of unnecessary edges that are mostly produced by repeats or sequencing errors. As the final step, Consensus considers the alignment of all original reads onto the draft contigs from the Layout step and employs a straightforward majority-based consensus to improve the draft sequences. To limit extraneous edges in the graph, SORA utilizes three overlaps-graph reduc-tion algorithms: Transitive Edge Reducreduc-tion (TER), Com-posite Edge Contraction (CEC), and Dead-End Removal (DER) [25].
Apache Spark
Apache Spark is a cluster-based engine that processes very large-scale datasets. As opposed to Hadoop’s on-disk data processing, Spark’s incorporated batching sys-tem handles input data streams in-memory, separates the data into batches for each node in a cluster, and pro-duces the final stream of results in batches. For fast and scalable distributed graph-parallel computation, Apache Spark provides GraphX library that contributes a set of fundamental operations and graph abstraction models in parallel. This permits SORA to manipulate and exe-cute queries on graphs represented as database entries. The implementation and design in SORA leverages an assortment of computational operations in GraphX for construction, graph reading, transformation, and com-putation. GraphX extends Spark’s Resilient Distributed Dataset (RDD) that embodies a read-only collection of objects that are partitioned over machines. If any par-tition of an RDD is lost, Spark rebuilds it by applying the filter on the corresponding block of the file in the file system. An RDD can be cached in memory across machines and reused in multiple MapReduce-like parallel operations.
To accommodate abstraction for manipulating struc-tured data (e.g., tables or two-dimensional arrays), SORA uses a graph processing library called GraphFrames that is built on Spark’s DataFrame implementation to process real-time exploration of large-volume datasets. SORA leverages GraphFrames to execute pattern matching and relational queries in tandem with GraphX to speed up the most common join in iterative graph processing tasks. SORA was implemented in Scala, but the portable design of the core components allows for adaptive use with other programming languages like Java or Python with lower development costs.
Overlap-Graph Reduction Algorithms
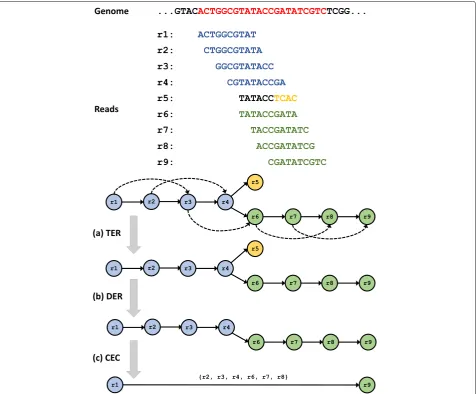
Fig. 1The overlap-graph reduction algorithms.aTransitive Edge Reduction (TER),bDead-End Removal (DER), andcComposite Edge Contraction (CEC)
Transitive Edge Reduction
Transitive edge reduction is a method of reducing com-plexity in graphs and helps provide clearer contigs by eliminating extraneous paths in the graph. After finding overlaps, the initial overlap graph contains many unnec-essary edges. For example, say readaoverlaps with readb, which overlaps with readcsubsequently, which results in a shorter overlap length between readaand readc. Then, the string graph edgea → cis unnecessary because one can use the edgesa → b → cwithouta → cto obtain the same sequence. The edge a → c is then identified as a transitive edge and is deleted. Removing all transitive edges significantly simplifies the overlap graph without losing information for genome assembly.
The general transitive edge reduction algorithm takes O(ED)time whereEis the number of edges andDis the maximum out degree for the read, but Myer proposed a
linearO(E)expected time transitive reduction algorithm shown in Algorithm 1 [25]. After the initial marking of every vertex and all related edges in the graph, each vertex is then investigated to find eliminable edges of the vertex using the marking strategies.
In Algorithm 2 we use the GraphX library operators to implement the transitive edge reduction algorithm based on the graph-parallel abstraction. The GraphX library supports the graph-parallel computation APIs aggregateMessages(), outerJoinVertices(), mapTriplets(), subgraph(), sendToSrc(), and sendToDst(). After constructing the ini-tial property graph from the edge properties, the
Algorithm 1Algorithm for Transitive Edge Reduction Input: Graph (V, E)
Output: Reduced Graph (V’, E’) 1: forv∈Vdo
2: mark[v] ← vacant // Initially mark a vertex vi as vacant.
3: forv→w∈Edo
4: reduce[v→ w]←false// Mark an edgewias not reduced.
5: end for 6: end for 7: forv∈Vdo
8: // Mark a vertexvireachable fromvjas inplay 9: forv→w∈Edo
10: mark[w]←inplay 11: end for
12: longest←maxwlen(v→w)
13: forv→w∈Ein order of lengthdo
14: // Traverse an edgewimarked inplay, indicating it is adjacent tov.
15: ifmark[w] = inplaythen
16: // Stop if an edge is too long to eliminate edges out of v.
17: forw→x∈Ein order of lengthand len(w→x)+len(v→w)≤longestdo 18: ifmark[x] = inplaythen
19: mark[x]←eliminated 20: end if
21: end for 22: end if 23: end for
24: // Conclude the processing of v by examining each adjacent vertex.
25: forv→w∈Edo
26: ifmark[w] = eliminatedthen
27: reduce[v → w]← true // Mark as needing reduction.
28: end if
29: mark[w]←vacant// Restore each vertex mark to vacant.
30: end for 31: end for
usingouterJoinVertices. After comparing overlap lengths of the edges for each vertex in parallel, the edges are marked asTRUE if the edges can be removed. The
subgraphoperator returns a new graph containing only the edges not marked for removal.
Dead-End Removal
Dead-End Removal (DER) eliminates short dead-ends or spurs from the graph, reduces erroneous reads, and decreases the graph complexity. The short dead-end paths
Algorithm 2Spark Algorithm for Transitive Edge Reduc-tion
Input: Let overlapG be an overlap graph G(V, E). Output: Let reducedG be a reduced graph G(V’, E’).
1: // Compute the set of neighbors for each vertex. 2: neighborVtx=aggregateMessages(overlapG(V, E)) { 3: forv∈Vdo
4: ort←getOrientation(v)
5: sendToSrc(getDstId(v), ort, getOverlapLen(v)) 6: sendToDst(getSrcId(v), ort, getOverlapLen(v)) 7: end for
8: }
9: // Join graph with neighbors.
10: joinedG =
outerJoinVer-tices(overlapG(V,E),neighborVtx)
11: // Traverse each edge and marktrueif the edge is remov-able.
12: markedG = mapTriplets(joinedG(V, E)) {
13: fore∈edges of adjacent vertices of a vertex in Vdo 14: if getOverlapLen(e) < getMaxOverlapLen(e)
then 15: e←true 16: end if 17: end for 18: }
19: // Remove the marked edge using subgraph. 20: reducedG = subgraph(markedG(V, E))
are mostly caused by sequencing errors and false-positive joins of overlapping of chimeric sequences. Most assem-blers identify the dead-ends by considering short length edges with low-depth coverage to be dead-ends. The DER algorithm iterates over all reads, then stamps the edges if the reads have only one incoming edge and the edges are short with low coverage.
Algorithm 3 describes the DER algorithm based on the GraphX operators. Algorithm 3 takes as input the reduced graph that Algorithm 2 has produced as the output and executes the aggregateMessages operator to com-pute the number of edges going in and out of each vertex depending on the orientation of the edge. This informa-tion can be joined with the input reduced graph by using
outerJoinVertices. In parallel, if the number of out-going edges from a node is zero and the edge can be removed mark the edge TRUE. The subgraph opera-tor returns a new graph with the edges marked TRUE
removed.
Composite Edge Contraction
Algorithm 3Spark Algorithm forDead End Removal Input: Let overlapG be an overlap graph G(V, E). Output: Let reducedG be a reduced graph G(V’, E’).
1: // Compute the in/out edge counts for each vertex. 2: inOutVtx=aggregateMessages(overlapG(V, E)) { 3: forv∈Vdo
4: ort←getOrientation(v)
5: ifort== ←→then
6: sendToSrc(1,0) 7: sendToDst(1,0) 8: end if
9: ifort==>−−< then 10: sendToSrc(0,1) 11: sendToDst(0,1) 12: end if
13: ifort==||ort== then 14: sendToSrc(0,1)
15: sendToDst(1,0) 16: end if
17: end for 18: }
19: // Join graph with neighbors.
20: joinedG = outerJoinVertices(overlapG(V, E), inOutVtx)
21: // Traverse each edge and marktrueif the edge is remov-able.
22: markedG = mapTriplets(joinedG(V, E)) {
23: fore∈edges of adjacent vertices of a vertex in Vdo 24: ife.out==0then
25: e←true
26: end if 27: end for 28: }
29: // Remove the marked edge using subgraph. 30: reducedG = subgraph(markedG(V, E))
case of Overlap-layout-consensus (OLC), a read is repre-sented for branching to two additional reads which deviate from each other at least one nucleotide, both of which then overlap back to the same read. In contrast to OLC, the CEC algorithm simplifies the path analysis by remov-ing redundancy and reducremov-ing complexity of the graph, considering only the contractible edges without loss of important information for the genome assembly. To sim-plify the overlap graph, a simple vertex,r, along with its in-arrow edge (u,r) and out-arrow edge (r,w), are replaced by a composite edge (u,w) in the overlap graph.
Algorithm 4 describes the composite edge contraction by using the operators of the graph-parallel computa-tions provided by GraphX and GraphFrames. After receiv-ing the reduced graph from Algorithm 3, the operator
aggregateMessages computes the number of edges
Algorithm 4Spark Algorithm for Composite Edge Con-traction
Input: Let overlapG be an overlap graph G(V, E). Output: Let contractedG be a contracted graph G(V’, E’).
1: // Compute the in/out edge counts for each vertex. 2: inOutVtx=aggregateMessages(overlapG(V, E)) { 3: forv∈Vdo
4: ort←getOrientation(v)
5: ifort== ←→then
6: sendToSrc(1,0) 7: sendToDst(1,0) 8: end if
9: ifort==>−−< then 10: sendToSrc(0,1) 11: sendToDst(0,1) 12: end if
13: ifort==orort== then 14: sendToSrc(0,1)
15: sendToDst(1,0) 16: end if
17: end for 18: }
19: // Join graph vertices with in/out edge counts.
20: joinedG = outerJoinVertices(overlapG(V, E), inOutVtx)
21: // Traverse each edge and marktrueif edge is contractable.
22: markedG=mapTriplets(joinedG(V, E)) {
23: fore∈edges of adjacent vertices of a vertex in Vdo 24: ife.out==1ande.in==1then
25: e←true
26: end if 27: end for
28: // Remove the edges marked true using subgraph. 29: contraG=subgraph(markedG(V, E))
30: // Calculate the connected components for each node. 31: conVtx=connectedComponents(contraG(V, E)) 32: // Combine connected vertices with graph.
33: dupVtx=vertices.innerjoin(markedG(V, E), conVtx) 34: contraVtx = vertices.aggregateUsingIndex(markedG
(V, E), dupVtx)
35: // Remove the edges marked false using subgraph. 36: remainedG=subgraph(markgedG(V, E))
37: contraEdges = outerJoinVertices(remainedG(V,E), conVtx)
38: // Generate a new graph using the modified edges and vertices.
39: contractedG=graph(contraVtx, contraEdges)
mapTriplets is parallelized to investigate the edges of each adjacent vertex to determine whether the vertex only includes a pair of incoming and outgoing edges. It then marks the edgeTRUEif they can be contracted. The
subgraph operator returns a new graph with only the contractable edges.
The operator connectedComponent identifies the connection relationship among contractible vertices and produces the vertex information with the ver-tex IDs for the connected contractible subgraphs. Given the contractible vertex information, the opera-tor innerJoin performs an inner join between each contractible and internal vertex to produce a set of the new vertex properties, which is used in the operator
aggregateUsingIndex to aggregate the contracted vertices ensuring consistency by joining the IDs among vertices. Then, the operator subgraph filters out the edges markedFALSE to remove the contractible edges from the original graph. Based on the refined vertex set, the operatorouterJoinVerticesgenerates the con-tracted edges, which parameterize the operatorgraphto construct a new reduced graph.
Results
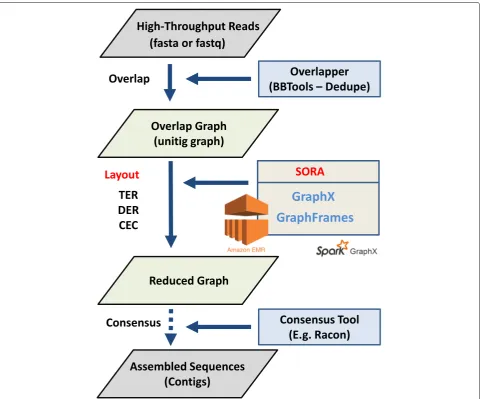
Figure 2 shows a practical pipeline of genome assem-bly using SORA. In our experiments, we applied three overlap-graph reduction algorithms (Transitive Edge Reduction, Dead-End Removal, and Composite Edge Contraction) in SORA to three different types of bench-mark datasets.
Three Data Sets
For the first experiment described in Section 6, we downloaded a metagenomics dataset from the Sequence Read Archive at the National Center for Biotechnol-ogy Information (NCBI) [24]. The accession number is SRX200676. The metagenomics dataset is consid-erably large containing mixed DNA from 64 diverse bacterial and archaeal microorganisms. The combined DNA was sequenced using Illumina HiSeq [26]. For the second experiment described in Section 6, we obtained a single genome dataset ofConyza canadensis (also known as horseweed) processed by the Illumina HiSeq sequencing system [27]. For the third experi-ment described in Section 6, we downloaded a human genome dataset provided by the 1000 Genome Project data portal (ISGR: The International Genome Sample Resource http://www.internationalgenome.org/). Sam-ple ID is NA12878 (http://www.internationalgenome. org/data-portal/sample/NA12878) and we down-loaded 3 files of whole genome sequencing (WGS) from the European Bioinformatics Institute (EBI) (ftp://ftp.sra.ebi.ac.uk/vol1/fastq/SRR622/SRR622461/ -SRR622461_1.fastq.gz, ftp://ftp.sra.ebi.ac.uk/vol1/fastq/
SRR622/SRR622461/-SRR622461_2.fastq.gz, ftp://ftp.sra. ebi.ac.uk/vol1/fastq/SRR622/SRR622461/SRR622461. fastq.gz).
Metagenomics Dataset Analysis
We evaluated the scalability of SORA by applying the overlap-graph reduction algorithms to the metagenomics dataset that is extremely large to check the performance capability of SORA. In the experiment, we observed that SORA significantly reduced the number of reads in the metagenomics datasets, which consequently allows bin-ning of the contigs to reconstruct genomic bins more quickly and efficiently. The benchmark has been per-formed on Amazon Web Service (AWS) Elastic Com-puting Cloud (EC2) with 15 virtual instances whether each instance (m4.xlarge) has 2.3 GHz Intel Xeon E5-2686 v4 (Broadwell) processors (4 vCPU) and 16 GB memory.
Overlap Graph Construction
The sequence dataset obtained from NCBI contains 109 million paired-end reads roughly and 0.4 million single-end reads with 100-bp read length. Sequence reads that are shorter than 60bp and containing mul-tiple N character were removed using Sickle (https:// github.com/najoshi/sickle). BBNorm (https://sourceforge. net/projects/bbmap) was used for error correction with the default settings. These are the same techniques used for the OMEGA analysis [24].
Transitive Edge Reduction
In the experiment with the metagenomics dataset, Transi-tive Edge Reduction (TER) algorithm performed a drastic reduction on the number of edges in the graph. In Table1, the reduction results of the TER algorithm were shown using three types of data size as quarter, half, and full data sets. Given the quarter dataset that contains over 217 million edges, the TER algorithm produced the reduced graph comprising 12.5 million edges with 94.24% reduc-tion; given the full size dataset that initially contains 868 million edges, the TER algorithm made the reduced graph comprising of 57.4 million edges with 93.39% reduction.
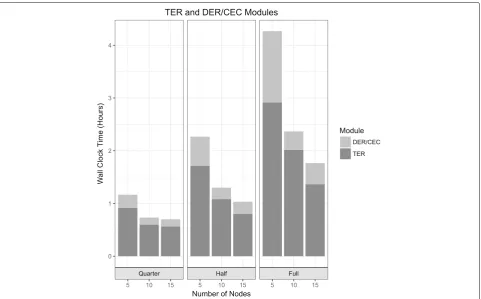
Figure3shows the powerful scalability of the TER algo-rithm where the computational time decreased as the number of cluster nodes increased. For example, the TER algorithm completed the reduction of the graph module in 2.92 h using 5 cluster nodes, while completed the same task in 1.37 h with 15 cluster nodes.
Fig. 2Overview of analysis pipeline using SORA. SORA pipeline for genome assembly the reduced graph with 0.5 million edges with 96%
reduc-tion. In addition, given the full dataset that contains 57.3 million edges, the combined DER-CEC modules resulted in the reduced graph comprising 2.3 million edges with 95.97% reduction.
Table 1The overlap-graph reduction results with the metagenomics dataset
Algorithm Size #EDGE (before) #EDGE (after) TIME
TER Quarter 217,002,504 12,482,946 0.57
Half 434,005,009 23,818,401 0.80
Full 868,010,019 57,363,515 1.37
DER-CEC Quarter 12,482,946 469,130 0.13
Half 23,818,401 763,474 0.23
Full 57,363,515 2,341,610 0.40
#EDGE denotes the number of edges of the graph and TIME the running time (hours) for the computation
Figure3represents the capable scalability of the com-bined DER-CEC algorithms by measuring each running time per different numbers of cluster nodes within the same sized dataset. In the full dataset experiment, we directly compared the running time between 5 and 15 cluster nodes. The DER-CEC algorithm completed the reduction of the graph using 5 virtual instances in 1.35 h, while fast and scalable completing in 0.4 h with 15 virtual instances.
Benchmark to Omega
Fig. 3Wall-clock time comparison. Wall-clock time for different number of nodes with the different size of metagenomics datasets
available for benchmarking. In Fig.4, it shows that SORA’s computation time is only 1.77 h running time compared to Omega with 7.5 h running time. In addition to effi-cient speedy performance, SORA uses less amount of system memory compared to Omega since it breaks down the graph computation tasks to process them in parallel, thereby allowing more of the graph to be in memory and speeding up the analysis.
Horseweed Dataset Analysis
To show the flexibility and usability of SORA, we applied SORA to a single genome dataset to generate a reduced graph. Total size of 72 FASTQ paired-end files is 108 GB. We used a local computational workstation that has 32 cores (Intel Xeon Processor E5-2640 V3 2.6GHz) and 128 GB of memory (DDR4 2133MHz ECC).
Overlap Graph Construction
To demonstrate the power of SORA for genome assembly with multiple raw reads dataset from a single genome, we implemented and incorporated multiple shell scripts into SORA to perform error correction on the genome dataset, find overlaps of the corrected reads, and generate a large overlap graph as a batch process, and thereafter executes SORA. The dataset that we tested was processed with nor-malization and graph construction containing 8.3 million
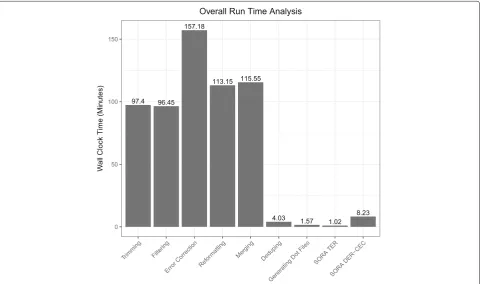
edges. Figure5represents that the pipeline script includ-ing SORA completed the assembly in 9.75 h where SORA core modules (TER, DER, and CEC) only took less than 10 min.
Transitive Edge Reduction
Table 2 shows the assessment results using the TER algorithm with the single genome dataset that contains 8.3 million edges. After the TER algorithm, SORA pro-duced the repro-duced graph that contains 5.4 million edges, which was lower reduction rate than the experiment using the metagenomic dataset since the single genome dataset is constructed less redundancies and receives fewer transitive edges potentially to be removed. Figure5 shows that the TER algorithm completed with the best speedy performance (1.02 min execution time) with effi-cient memory consumption that is not requiring above 22% of overall memory usage from 128 GB total system memory.
Fig. 4Benchmark to Omega. Shows how the analysis of the metagenomics dataset compares with Omega
the reduced graph with 4.2 million edges, whose out-put was fed into the CEC algorithms that completed the final graph leading to the reduced 1 million-edge graph. During this overlap-graph reduction, the DER-CEC algorithm completed the computation in 8.23 min with the maximum 37% consumption of the 128 GB total memory.
Human Genome Dataset Analysis
In this experiment, we applied SORA to a human genome dataset to generate a reduced graph. Total size of 3 FASTQ paired-end files for one sample is 40 GB. We used a local computational workstation that has 32 cores (Intel Xeon Processor E5-2640 V3 2.6GHz) and 128 GB of memory
(DDR4 2133MHz ECC) to show the ability of the SORA for a human genome sample.
Overlap Graph Construction
We also used a script in SORA to run BBtools trimming, filtering, error correction, merge, reformatting, merging, and finding overlaps. The duration time was approxi-mately 1 h using 32 cores of the machine. Table3shows the number of edges of the overlap graph from the human genome dataset.
TER, DER, and CEC
Table3also shows the results of overlap-graph reduction of the TER and combined DER-CEC algorithms with the
Table 2The SORA results with the horseweed dataset
#EDGE (before) #EDGE (after) TIME (mins)
TER 8,259,543 5,386,287 1.02
DER-CEC 5,386,287 1,027,959 8.23
#EDGE denotes the number of edges of the graph and TIME denotes the running (wall-clock) time of the computation
human genome dataset. The number of edges decreased to 24% of the original overlap graph. During this overlap-graph reduction, the TER, DER-CEC algorithms com-pleted the computation in 3 min with the maximum 50% consumption of the 128 GB total memory.
Discussion
The sequencing price continues to drop with increasing of emergence and fine tuning of novel sequencing tech-nologies that increase the amount of sequencing data exponentially. Conventional algorithms can utilize the large influx of raw reads, but most of those algorithms require a large and expensive computing system with a large amount of computer memory. That requirement only limit to the few big labs that can afford to pur-chase and maintain such a powerful computing machine. SORA helps bridge this gap to small-size research labs by providing an efficient method for generating reduced graphs using distributed computing in the cloud. SORA also provides the ability to analyze any size of input data to generate novel sequenced contigs in fast turn-around time using any size of system resources.
In reference free de novo assembly, overlap-layout-consensus approach is a well-used method in low-throughput long-reads Sanger sequencing era, but can raise a problem for massive amounts of short reads that can lead many false overlaps. Therefore, it can increase the computational time and memory usage requiring for storing and analyzing large-scale graphs spawned from the massive short reads. SORA has been designed to work efficiently with these problems by using the Apache Spark engine to manage the distributed computation in the cloud or local cluster. SORA with Apache Spark effi-ciently uses in memory storage across multiple instances to provide a better performance compared to traditional genome assemblers.
Table 3The SORA results with the with the human genome dataset
#EDGE (before) #EDGE (after) TIME (mins)
TER 18,942 10,017 1
DER-CEC 10,017 4648 2
#EDGE denotes the number of edges of the graph and TIME denotes the running (wall-clock) time of the computation
Conclusions
As seen in the experimental results the nearly linear scal-ability of SORA allows altering of the number of compu-tational nodes as the overlap graph data size changes. By using the intrinsic attributes of each node (alignment of reads) the redundant edges in the graph can be removed using the Transitive Edge Reduction algorithm. The long stretches of multiple single edges mapped head to tail can be reduced to a single edge using the Composite Edge Contraction. Overall these algorithms provide a reduced overlap graph which allows for better contigs to be gener-ated for de novo genome assembly.
Abbreviations
AWS: Amazon web service; CEC: Composite edge contraction; DBG: de Bruijin graph; DER: Dead-end removal; EBI: The European Bioinformatics Institute; EC2: Elastic computing cloud; MLlib: Machine learning library; NCBI: National center for biotechnology information; NGS: Next-generation sequencing; OLC: Overlap-layout-consensus; PacBio: Pacific bio-sciences; RDD: Resilient distributed dataset; TER: Transitive edge reduction; WGS: Whole genome sequencing
Acknowledgements Not applicable.
About this supplement
This article has been published as part ofHuman Genomics Volume 13 Supplement 1, 2019: Selected articles from the IEEE BIBM International Conference on Bioinformatics & Biomedicine (BIBM) 2018: human genomics. The full contents of the supplement are available online athttps://humgenomics.
biomedcentral.com/articles/supplements/volume-13-supplement-1.
Authors’ contributions
TA and CP jointly contributed to the design of the study. AJ jointly conceived the study with T.A, performed experiments and data analysis, and prepared the initial draft of the manuscript. D.L performed experiments and data analysis. MS, SL, CP assisted in the design of the SORA algorithm. TA supervised the project. All authors read and approved the final manuscript.
Funding
TA is supported by NSF-1566292, NSF-1564894, Saint Louis University (SLU) Startup, SLU President’s Research Fund 2018, and Amazon Web Service (AWS) Cloud Credits for Research. DL is supported by T32 HG000045 from the National Human Genome Research Institute. Publication were funded by TA’s SLU Startup fund.
Availability of data and materials
The datasets that support the findings of this study are available inhttps:// www.ncbi.nlm.nih.gov/sra/SRX200676,http://www.plantphysiol.org/content/ 166/3/1241, andftp://ftp.sra.ebi.ac.uk/vol1/fastq/SRR622/SRR622461/.
Ethics approval and consent to participate Not applicable.
Consent for publication Not applicable.
Competing interests
The authors declare that they have no competing interests.
Author details
5School of Computer Science, University of Oklahoma, Norman, OK, USA. 6Department of Computer Science, Saint Louis University, St. Louis, MO, USA.
References
1. Ansorge WJ. Next-generation dna sequencing techniques. New Biotechnol. 2009;25(4):195–203.
2. Hert DG, Fredlake CP, Barron AE. Advantages and limitations of next-generation sequencing technologies: a comparison of electrophoresis and non-electrophoresis methods. Electrophoresis. 2008;29(23):4618–26. 3. Metzker ML. Sequencing technologies - the next generation. Nat Rev
Genet. 11(1):31–46.
4. Wall PK, Leebens-Mack J, Chanderbali AS, Barakat A, Wolcott E, Liang H, Landherr L, Tomsho LP, Hu Y, Carlson JE, et al. Comparison of next generation sequencing technologies for transcriptome characterization. BMC Genom. 2009;10(1):347.
5. Flicek P, Birney E. Sense from sequence reads: methods for alignment and assembly. Nat Methods. 6(11 Suppl):6–12.
6. Schneider VA, Graves-Lindsay T, Howe K, Bouk N, Chen H-C, Kitts PA, Murphy TD, Pruitt KD, Thibaud-Nissen F, Albracht D, Fulton RS, Kremitzki M, Magrini V, Markovic C, McGrath S, Steinberg KM, Auger K, Chow W, Collins J, Harden G, Hubbard T, Pelan S, Simpson JT, Threadgold G, Torrance J, Wood JM, Clarke L, Koren S, Boitano M, Peluso P, Li H, Chin C-S, Phillippy AM, Durbin R, Wilson RK, Flicek P, Eichler EE, Church DM. Evaluation of grch38 and de novo haploid genome assemblies demonstrates the enduring quality of the reference assembly. 2017;27(5):849–64.https://doi.org/10.1101/gr.213611.116. 7. Miller JR, Koren S, Sutton G. Assembly algorithms for next-generation
sequencing data. Genomics. 95(6):315–27.
8. Myers EW, et al. A whole-genome assembly of drosophila. Science. 287(5461):2196–204.
9. Margulies M, et al. Genome sequencing in microfabricated high-density picolitre reactors. Nature. 437(7057):376–80.
10. Simpson JT, Wong K, Jackman SD, Schein JE, Jones SJ, Birol I. Abyss: a parallel assembler for short read sequence data. Genome Res. 19(6): 1117–23.
11. Zerbino DR, Birney E. Velvet: algorithms for de novo short read assembly using de bruijn graphs. Genome Res. 18(5):821–9.
12. Li R, Zhu H, Ruan J, Qian W, Fang X, Shi Z, Li Y, Li S, Shan G, Kristiansen K, Li S, Yang H, Wang J, Wang J. De novo assembly of human genomes with massively parallel short read sequencing. Genome Res. 20(2):265–72. 13. Pop M. Genome assembly reborn: recent computational challenges. Brief
Bioinform. 10(4):354–66.
14. Berlin K, Koren S, Chin CS, Drake JP, Landolin JM, Phillippy AM. Assembling large genomes with single-molecule sequencing and locality-sensitive hashing. Nat Biotechnol. 33(6):623–30.
15. Koren S, Walenz BP, Berlin K, Miller JR, Bergman NH, Phillippy AM. Canu: scalable and accurate long-read assembly via adaptive k-mer weighting and repeat separation. Genome Res. 27(5):722–36.
16. Boisvert S, Laviolette F, Corbeil J. Ray: Simultaneous assembly of reads from a mix of high-throughput sequencing technologies. J Comput Biol. 17(11):1519–33.
17. Meng J, Seo S, Balaji P, Wei Y, Wang B, Feng S. Swap-assembler 2: Optimization of de novo genome assembler at extreme scale, 2016 45th International Conference on Parallel Processing (ICPP), Philadelphia. 2016. p. 195–204.https://doi.org/10.1109/ICPP.2016.29.
18. Zaharia M, Chowdhury M, Franklin MJ, Shenker S, Stoica I. Spark: cluster computing with working sets. In: Proceedings of the 2nd USENIX conference on Hot topics in cloud computing (HotCloud’10). Berkeley: USENIX Association; 2010. p. 10–10.https://dl.acm.org/citation.cfm?id= 1863103.1863113.
19. Zaharia M, Chowdhury M, Das T, Dave A, Ma J, McCauley M, Franklin MJ, Shenker S, Stoica I. Resilient distributed datasets: a fault-tolerant abstraction for in-memory cluster computing. In: Proceedings of the 9th USENIX conference on Networked Systems Design and Implementation (NSDI’12). Berkeley: USENIX Association; 2012. p. 2–2.https://dl.acm.org/ citation.cfm?id=2228301.
20. Abu-Doleh A, Catalyurek UV. Spaler: Spark and graphx based de novo genome assembler, 2015 IEEE International Conference on Big Data (Big
Data), Santa Clara. 2015. p. 1013–8.https://doi.org/10.1109/BigData.2015. 7363853.
21. Paul AJ, Lawrence D, Ahn T-H. Overlap graph reduction for genome assembly using apache spark. In: Proceedings of the 8th ACM International Conference on Bioinformatics, Computational Biology,and Health Informatics, ACM-BCB ’17. New York: ACM; 2017. p. 613.https:// doi.org/10.1145/3107411.3108222.http://doi.acm.org/10.1145/3107411. 3108222.
22. Paul AJ, Lawrence D, Song M, Lim S, Pan C, Ahn T. Sora: Scalable overlap-graph reduction algorithms for genome assembly using apache spark in the cloud. In: 2018 IEEE International Conference on
Bioinformatics and Biomedicine (BIBM); 2018. p. 718–23.https://doi.org/ 10.1109/BIBM.2018.8621546.
23. Meng X, Bradley J, Yavuz B, Sparks E, Venkataraman S, Liu D, Freeman J, Tsai D, Amde M, Owen S, et al. Mllib: Machine learning in apache spark. J Mach Learn Res. 2016;17(1):1235–41.
24. Haider B, Ahn T-H, Bushnell B, Chai J, Copeland A, Pan C. Omega: an overlap-graph de novo assembler for metagenomics.
Bioinformatics. 30(19):2717–22.
25. Myers EW. The fragment assembly string graph. Bioinformatics. 2005;21(2):ii79–85.http://dx.doi.org/10.1093/bioinformatics/bti1114. 26. Shakya M, Quince C, Campbell JH, Yang ZK, Schadt CW, Podar M.
Comparative metagenomic and rrna microbial diversity characterization using archaeal and bacterial synthetic communities. Environ
Microbiol. 15(6):1882–99.
27. Peng Y, Lai Z, Lane T, Nageswara-Rao M, Okada M, Jasieniuk M, O’Geen H, Kim RW, Sammons RD, Rieseberg LH, Stewart CN. De novo genome assembly of the economically important weed horseweed using integrated data from multiple sequencing platforms. Plant Physiol. 2014;166(3):1241–54.https://dx.doi.org/10.1104%2Fpp.114.247668.
Publisher’s Note
Springer Nature remains neutral with regard to jurisdictional claims in published maps and institutional affiliations.