Ramp Type Demand under Permissible Delay in Payments
Sanjay Jain
Department of Mathematical Sciences Government College
Ajmer - 305001, India
Mukesh Kumar
Department of Mathematics Government College
Kishangarh - 305802, India
Priya Advani
Department of Mathematics
Government Mahila Engineering College Ajmer, India
drjainsanjay@gmail.com
Abstract
The aim of this paper is to develop an optimal replenishment policy for inventory models of deteriorating items with ramp type demand under permissible delay in payments. Deterioration of items begins on their arrival in stock. An example is also presented to illustrate the application of developed model.
Keywords: Replenishment policy, Deterioration, Ramp type demand, Permissible delay in payments.
1. Introduction
The economic order quantity model tacitly assumes capital investment in inventories on the receipt of the items by the inventory system. Such an assumption is not quite practical in the real world. Under most market behavior, it is observed that a vendor provides a credit period for buyers to stimulate demand. However, if the items deteriorate while in inventory then purchase of large quantity will be uneconomical.
function of the inventory model of deteriorating items under permissible delay in payments. Chung (2000) proposed the inventory replenishment policy for deteriorating items under permissible delay in payments. Chang et al (2001) developed an inventory model for deteriorating items with linear trend demand under permissible delay in payments. Oyang et al (2005) gave an optimal policy to minimize cost when the supplier offers not only a permissible delay but also a cash discount. Pal and Ghosh (2007) developed an inventory model for deteriorating items with stock-dependent demand under permissible delay in payments. Kumar et al (2009) developed an inventory model with power demand rate, incremental holding cost and permissible delay in payments.
Time varying demand patterns are commonly used to reflect sales in different phases of the product in the market. But in the real market demand of a product is always in dynamic state due to variability of time, price or even of the instantaneous level of inventory displayed in retail shop. This impressed researchers and marketing practitioners to think about ramp type demand which increases with time up to a certain limit and then ultimately stabilizes and becomes constant. Such a type of demand is observed in items such as newly launched mobile phones, fashion goods, garments and automobiles, cosmetics etc.
Mandal and Pal (1998) developed an order-level inventory model for deteriorating items with ramp type demand. Wu and Ouyang (2000) extended their model by incorporating the concept of shortages followed by inventory. Giri et al (2003) developed an economic order quantity model with Weibull deterioration distribution, shortages and ramp type demand. Jain and Kumar (2007) further generalized the Wu and Ouyang (2000) model by allowing Weibull distribution deteriorating. Panda et al (2008) gave an optimal replenishment policy for perishable seasonal product in a season with ramp type demand rate. Sharma et al (2009) developed an EOQ model for variable rate of deterioration having a ramp type demand rate.
In the present paper, an optimal replenishment policy (ORP) for inventory model of deteriorating items with ramp type demand under permissible delay in payments is studied. The inventory is assumed to deteriorate at a constant rate. The procedure of solving the proposed model is illustrated with numerical examples.
2. Assumptions and Notations
The proposed inventory model having following assumptions and notations:
2.1 Assumptions
1. The shortages are not allowed.
2. The lead-time is zero.
4. There is no repair or replacement of the deteriorated inventory during a given cycle.
5. Ramp-type demand ratef(t)is given by
t for
t for t
H where
D t
H t
t D t f
1 0 ) (
0 ,
) ( ) ( )
( 0 0
is well known Heaviside’s unit function.
6. During the fixed credit period μ, the unit cost of generated sales revenue is deposited in an interest bearing account. The difference between sales price and unit cost is retained by the system to meet the day-to-day expenses of the system. At the end of the credit period, the account is settled and interest charges are payable on the account in stock.
7. The constant fractionθof on hand inventory gets deteriorated per unit time.
2.2 Notations
C = unit purchase cost in $
C1= inventory holding cost per unit per time unit excluding interest charges in $
I = inventory holding charges per unit per year C3 = replenishment cost per cycle in $
Ie = interest that can be earned $ per unit time
Ic = interest charges payable per $ per time unit (Ic > Ie)
T =cycle time
μ = permissible delay period for settling accounts in time units θ =fraction of units that deteriorate per time unit
3. MODEL FORMULATION
For developing mathematical model, we consider two cases as follows:
Inventory Inventory
level level
μ T Time T μ Time
Case I: When μ < T
Let Q(t) denote the on hand inventory of the system at any time t, (0 < t < T). Depletion due to demand and deterioration will occur simultaneously. The differential equation that describes the instantaneous state of Q(t)is given by
) 2 ( ; ) ( ) 1 ( 0 ; ) ( 0 0 T t D t Q dt dQ t t D t Q dt dQ
with the initial and boundary conditions Q(0) = Q0andQ(T) = 0 (3)
where Q0 is the inventory order quantity. The solutions of equations (1) and (2)
subject to the conditions (3) are respectively
) 5 ( ; 1 ) 4 ( 0 ; 1 ) ( ) ( 0 2 0 0 0 T t e D t e D t D e Q t Q t T t t
Substitutingt= μ in equations (4) and (5) and then equating, we get
1
(6)2 0 0
0
e D e D Q t
The total cost will consist of the following components.
i) Total interest earned during cycle time
2 2 0 0 0 e e I D C dt t D C I
(7)ii) Total interest paid during cycle time
( ) 0 1 1
Tc T
c T e
I D C dt t Q C I (8)
iii) Total inventory holding cost
T T dt t Q C dt t Q C dt t Q C ) ( ) ( ) ( 1 0 1 0 1
1 0 1 2
2
iv) Number of unitsD(T)that deteriorate during the cycle is given by
T D e D e D dt D dt t D Q t D T T 2 1 ) ( 0 2 0 0 0 0 0 0
The cost due to deterioration during the cycle =C D(T)
CD e T CD e CD T
2
1 0
2 0
0
(10)
v) Replenishment cost per cycle =C3 (11)
The total costξ1(T)per unit time is given as
ξ1(T)= [{Inventory holding cost + cost of deterioration + interest paid +
replenishment cost – interest earned}/T] (12)
Using (7) to (11) in (12), we get
(13)2 1 ) ( 2 1 2 0 3 ) ( 2 0 2 1 0 1 T I D C T C T e T D CI T e e C C T D t e T c T
For minimization of cost, we set 1
0 T T
( 1) 1
2
0 (14)2 ) 1 ( 2 ) 1 ( 2 3 3 2 0 ) ( 0 1 0
C I CD T e D CI e T e C C D e T c TCase II: When T< μ
The differential equation that describes the instantaneous state of Q(t)is given by
) 15 ( 0 ; ) ( ) (
0t t T
D t Q dt t dQ
with the initial and boundary conditions Q(0) = Q0andQ(T) = 0 (16)
where Q0 is the inventory order quantity. The solutions of equations (15) subject
to conditionsQ(0) = Q0is
t
t e D t D e Q t
Q
1
)
( 0 20
usingQ(T) = 0 in (17), we get
0 1 1
0 T T e e T D
Q
(18)
In this case, the customer earns interest on sales revenue up to the permissible period and pays no interest for the items kept in stock.
The total cost will consists of the following components.
i) Total interest earned during the cycle =
interest earned up to T + interest earned during (μ-T)
) 2 ( ) ( 0 0 0 0 T T D I C T T D I C dt t D
CIe T e e
(19)ii) Total inventory holding cost =
1 2 20 1 0 1 T T e e T D C dt Q C T T T
(20)iii) Number of units that deteriorate
2 1 ) ( 2 0 2 0 0 0 0 0 T D e D e T D dt t D Q t D T T T
Cost of deterioration =
2 1 ) ( 2 0 2 0 0 T CD e CD e T CD t
CD T T
(21)
iv) Replenishment cost =C3 (22)
The total costξ2(T)per unit time is given as
ξ2(T)= [{Inventory holding cost + cost of deterioration + replenishment cost –
interest earned}/T] (23)
using (19) to (22) in (23), we get
2 2 1 )( 3 0
2 0 1 2 T D CI T C T T e e D C C T e T T
(24)For minimization of cost, we set
0 2 T T
1
2 ( 1)
2(1 )
2 3 0 2
3 00
T I CD C e T T e T C C
4. Algorithm
In order to obtain optimum total cost and optimum cycle time interval between two consecutive orders, we proceed as follows:
Step 1: Compute T1from equation (14). If T1> μ, then T1is the optimum value of
Tand obtain total optimum cost from equation (13).
Step 2: If T1 < μ, then compute T2from equation (25). Again if T2 < μ then T2is
the optimum value of T and optimum total cost can be computed from equation (24).
5. Numerical Example
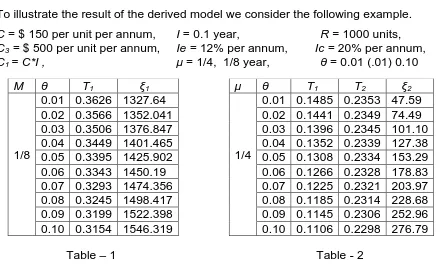
To illustrate the result of the derived model we consider the following example.
C= $ 150 per unit per annum, I= 0.1 year, R= 1000 units,
C3=$ 500 per unit per annum, Ie =12% per annum, Ic = 20% per annum,
C1= C*I , μ= 1/4, 1/8 year, θ= 0.01 (.01) 0.10
Table – 1 Table - 2
6. Conclusion
Here an optimal replenishment policy is developed for inventory model of deteriorating items with ramp type demand under permissible delay in payments.
Table-1 reveals that as rate of deterioration increases, the cycle time decreases while total cost per time unit of inventory increases.
When permissible delay period is greater than optimum cycle time it follows from table-2 that total cost per time unit increases as rate of deterioration increases.
References
1. Aggarwal, S. P. and Jaggi, C. K. (1995). “Ordering policies for deteriorating items under permissible delay in payments”, Journal of the Operational Research Society, 46, 658-662.
Μ θ T1 ξ1
1/8
0.01 0.3626 1327.64 0.02 0.3566 1352.041 0.03 0.3506 1376.847 0.04 0.3449 1401.465 0.05 0.3395 1425.902 0.06 0.3343 1450.19 0.07 0.3293 1474.356 0.08 0.3245 1498.417 0.09 0.3199 1522.398 0.10 0.3154 1546.319
μ θ T1 T2 ξ2
1/4
2. Chang, H.J., Hung, C. H. and Dye, C. Y. (2001). “An inventory model for deteriorating items with linear trend demand under the condition of permissible delay in payments”, Production Planning & Control, 12, 274-282.
3. Chu, P., Chung, K. J. and Lan, S. P. (1998). “Economic order quantity of deteriorating items under permissible delay in payments”, Computers Ops Res., 25, 817-824.
4. Chung, K. J. (2000). “The inventory replenishment policy for deteriorating items under permissible delay in payments”, Opsearch, 37(4), 269-280. 5. Giri, B. C., Jalan, A. K. and Chaudhuri, K. S. (2003). “Economic order
quantity model with Weibull deterioration distribution, shortages and ramp type demand”, Journal of System Sciences, 34, 237-243.
6. Goyal, S. K. (1985). “Economic order quantity under conditions of permissible delay in payments”, Journal of the Operational Research Society, 36, 335-338.
7. Jain, S. and Kumar, M. (2007). “An EOQ inventory model with ramp type demand, Weibull distribution deterioration and starting with shortage”, Opsearch, 44, 240-249.
8. Jamal, A. M, Sarker, B. R. and Wang, S. (1997). “An ordering policy for deteriorating item with allowable shortage and permissible delay in payments”, Journal of the Operational Research Society, 48, 826-833. 9. Kumar, M., Singh, S. R. and Pandey, R. K. (2009). “An inventory model
with power demand rate, incremental holding cost and permissible delay in payments”, International Transactions in Applied Sciences, 1, 55-71. 10. Mandal, B. and Pal, A. K. (1998). “Order level inventory system with ramp
type demand rate for deteriorating items”, Journal of Interdisciplinary Mathematics, 1, 49-66.
11. Mandal, B. N. and Phaujdar, S. (1989). “Some EOQ models under permissible delay in payments”, International Journal of Management and Systems, 5, 99-108.
12. Ouyang, L. Y., Chang, C.T. and Teng, J. T. (2005). “An EOQ for deteriorating items under trade credits”, Journal of the Operational Research Society, 56, 719-726.
13. Pal, M. and Ghosh, S. K. (2007). “An inventory model with stock-dependent demand and general rate of deterioration under conditions of permissible delay in payments”, Opsearch, 44, 227-239.
14. Panda, S., Senapati, S. and Basu, M. (2008). “Optimal replenishment policy for perishable seasonal products in a season with ramp-type dependent demand”. Computers & Industrial Engineering, 54, 301-314. 15. Shah, N. H. (1993). “A lot-size model for exponentially decaying inventory
when delay in payments is permissible”, Cahiers du CERO, 35, 115-123. 16. Sharma, M. M., Goel, V. C. and Yadav, R. K. (2009). “An order-level
inventory model for decaying items with ramp type demand, and partial backlogging”, International Transactions in Mathematical Sciences and Computer, 2, 157-166.