R E S E A R C H
Open Access
A quantitative method for estimating the
adaptedness in a physiological study
Vladimir N. Melnikov
Abstract
Background:Existed mathematical models of individual adaptation are mostly reductionist by nature. Researchers usually a priori consider the subject adapted basing only on the fact of continued or prolonged influence of the harmful factor. This paper describes a method that allows assessing the physiological adaptedness to experimental challenges on the basis of holistic approach and quantitative criteria.
Methods: The suggested method comprises simple equations and incorporates into the model an indicator that differentiates functions in regard to their significance for determining physiological adaptedness considered as an outcome of the adaptive process.
Results: The proposed empirical model affords the possibility of comparing subjects in respect to their resistance to several loads. Physiological parameters were differentiated with regard to their significance for assessing adaptedness. Two examples of animal adaptation to exercise after physical training and plant adaptogen administration are considered.
Conclusion: The calculated index of adaptedness is useful in that it replaces wordy descriptions of large tables that reveal alterations in numerous parameters of many subjects under study.
Keywords: Physiological adaptation, Mathematical model, Homeostasis, Plant adaptogens
Background
Adaptation as an active process of responding to challenges and adaptedness as a result of this process mean achieving a positive outcome, i.e. survival and reproduction, in the face of adversity. In a wider sense, it includes behavioral, physiological, structural, and genetic changes upon environmental impacts that are beyond the biologically adequate ranges. Apart
from traditional key environmental components
(warmth, food, salt, water, microelements), the
modern living organisms and especially human beings experience growing need to adjust their millieu to
arising amount and variability of new materials, drugs, and chemicals. It is just the physiological adaptation that involves ‘active resistance’ and provides achieving that positive outcome, living without diseases, if and when the preceding behavioral adaptation occurs ineffective or insufficient.
Adaptability as a fundamental property of living matter is widely studied by experimental biology and medicine. Every specialist in the field encounters difficulties in selecting criteria of adaptedness and analysing the results of multifactor experiments, wherein the state of the subject is assessed by a set
© The Author(s). 2019Open AccessThis article is distributed under the terms of the Creative Commons Attribution 4.0 International License (http://creativecommons.org/licenses/by/4.0/), which permits unrestricted use, distribution, and reproduction in any medium, provided you give appropriate credit to the original author(s) and the source, provide a link to the Creative Commons license, and indicate if changes were made. The Creative Commons Public Domain Dedication waiver (http://creativecommons.org/publicdomain/zero/1.0/) applies to the data made available in this article, unless otherwise stated.
Correspondence:[email protected]
of numerous parameters. Many researches a priori consider the investigated subject adapted to the given factor only on the basis of its prolonged influence.
There have been some previous attempts to
quan-tify adaptedness [1]. Most of them deal with
Darwin-ian adaptation considered as the biological fitness in the context of reproductive success; some relate with pharmacological tolerance as a result of adaptive
process [2, 3]. Researches consider adaptation in
terms of tolerance, stability, constancy, resistance,
coping, in view of stress conception [4]. An analysis
of the existed literature reveals that authors stretch the meaning of the term and interpret it loosely
from genes and millisecond time scale [5] to such
long-lasting weather-related health outcome as
cardiovascular mortality [6]. Most studies focus on
distinct systems or functions: neural networks [7],
visual perception [8], blood circulation [9], carbon dioxide transport [10], physical performance [11, 12].
Pries and co-authors [13] have proposed a
mathe-matical model to explain how a complex interaction of various stimuli can lead to vascular adaptation.
Gorban et al. [14] have designed an algorithm based
on the number and extent of correlations between parameters characterising the state of the population under study.
The existed models are mostly reductionistic by nature. The empirical model proposed here is built on an organism level and based upon the holistic ap-proach introducing quantitative criteria of individual adaptation. This study is the first to incorporate into the model an indicator that differentiates functions with regards to their significance for determining physiological adaptedness considered as an outcome of the adaptive process.
Description of the method
In order to estimate the degree of adaptedness to given harmful factor, probably the most direct way is to subject the organism to the action of said factor, applying functional “resolving” or “provoking” loads which force the physiological system to reveal its adaptive possibilities, for example, attained in the course of training or pharmacological pre-treatment. The proposed method, involving simple mathemat-ical operations, makes it possible to obtain an index of adaptedness of bio systems to various environ-mental or experienviron-mental conditions.
CASE I: two organisms, repeated-measure design
Let us assume that we have two organisms B and C
chosen at random from a homogenous population.
Suppose that the individual B was subjected to P, a
disturbing effect of environment or internal stressor. Let us then try to answer the question how the
ef-fect of P influenced the resistance of B to the
short-term action of another factor, say Q, to which both
B and C are equally subjected for the comparison in
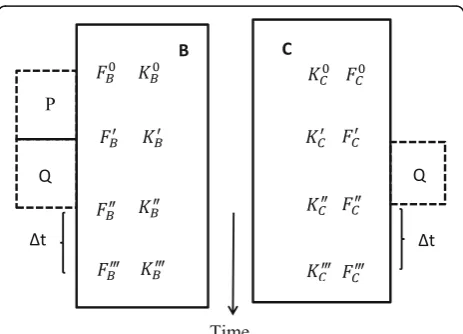
an experiment with parallel design (Fig. 1). As a
rule, P precedes the action of Q (not necessarily,
however) and is accompanied by a change in the
re-sistance of the organism to Q. Qualitatively, both
ef-fects may be of the same nature. Thus, for instance, this is observed in effect of prolonged moderate physical training on the tolerance of animals to mus-cular load or the effect of preventive introduction of poison on the resistance of organisms to subsequent acute poisoning. Yet, the above two effects may be different in nature, this being the case in the study of the effects of pharmacological preparations, pre-treatment or preconditioning (P) on adaptation to hypoxia, hypothermia, and so on (Q).
Out of a multitude of possible situations, let us take the following four states of the subjects studied: (1) baseline intact state prior to the action of P (F0);
(2) state subsequent to P and prior to Q (F′); (3)
state followed immediately after Q (F″); and (4) state
following the lapse of time Δt after the termination
of action of Q (F‴). It is clear that the first and
second states for subject C coincide: F0C = F0C (P is absent). F0B = F0C is also justifiable.
The entire set of physiological parameters reflect-ing the state of the bio system durreflect-ing the action of a given threatening factor may be tentatively divided
into at least three categories [15]. The first one
includes parameters, mainly homeostatic [16], which
Fig. 1Scheme of the physiological experiment appropriate for the
primarily and directly change as a result of the action of an entropic agent: body temperature at cooling or overheating, blood oxygen saturation during hypo- or hyperoxia, concentration of lactic acid and content of energetic resources (hepatic and muscle glycogen, glucose, FFA, ATP levels) during physical exercise, etc. The second category includes parameters which reflect changes in adaptive, or
allostatic [16], functions and mechanisms, whose
work is directed to normalize the initially changed characters, to counter the adverse effects of entropic factor, and to level off shifts in homeostatic variables [17–19]. As in the cases of hypoxia [20] and physical
load [12], such parameters would be heart and
res-piration rates, cardiac output, secretion of adaptive
hormones corticosteroids and catecholamines [21],
etc. Variables of the third category do not change at all under the above-said action. In other words, they characterize functions indifferent to the influencing factor.
The boundary between the first and second groups is sometimes tentative. It is clear that the values of some functions may sometimes alter with environmental changes in the manner depending on the severity and timing of stress: from initially reacting mechanisms they may become pronouncedly allostatic and vice versa. Nevertheless, it is usually possible to establish such a boundary in each concrete situation from the physio-logical view.
Changes in the parameters of the homeostatic and adaptive categories under the effect of a given factor should be accounted for with opposing signs in asses-sing the adaptedness of an organism to the said fac-tor. Despite the continuing action of the perturbation agent, the initially changed physiological characters become normalized or less pronounced in the state of adaptation. Contrariwise, the adaptive mechanisms work with greater intensity.
The latter premise has been suggested as a result of an analysis of experiments performed in different studies. Thus, for instance, it is known that trained
athletes in response to intensive physical loads (F″)
show higher cortisol secretion [22] mainly due to the
decrease in post-training value (F′) of basal secretion
[23, 24]. Untrained people, however, did not display
such increased secretion, or even showed a decline thereof. Cases of normalization of a given adaptive function in the process of adaptation, observed by
many investigators, indicates a “redistribution of
roles” among functions, when a less powerful
mech-anism had exhausted its possibilities and has been replaced by another more powerful and stable one, a
mechanism that rarely “actuates” (in states remote
from exhaustion).
Let us assess the state of tested organisms by the set of parameters K1, K2,…, Kj, …, Km, which, in our view, are the most important in estimating
adapted-ness to Q. Theoretically, a situation may arise
wherein out of the entire set, we will choose for investigation such parameters that do not change
under the action of Q; then F′=F″. In practice,
however, this is almost improbable, since the investi-gator usually has sufficient information as to what
characteristics should change under Q. The
differ-ence K″ – K′ characterizes a change in K under the
action of Q. Since the responding variables can
change in either positive or negative direction from the baseline, their reactions should be considered as a modulus. In order to have a possibility to compare such differences irrespective of the sign and absolute value of the parameter, we will further on use the relative magnitude ∣K″–K′∣/K′.
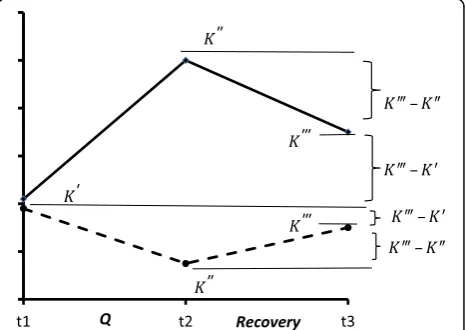
To assess recovery process during the rest of the char-acteristic that had changed as a result of the action ofQ, let us consider the fraction ∣K‴–K′ ∣/∣K‴–K″∣. The numerator shows how close the changed parameter had “returned” to its initial value prior to the action of Q. In view of the present model, a lesser difference cates better tolerance. The physiological practice indi-cates that the fraction is not sensitive to K′, so the possible effect of the difference between K’BandK’Cfor a given variable may be ignored in such an approximate
algorithm. The difference K‴ – K″ characterizes the
rate of parameter change during a given period of time Δt. It is suggested that the higher the rate of recovery and the greater the differenceK‴ –K″, the more adap-tive is the organism. Precisely for that reason, the rate index is shown in the denominator in order to minimize the fraction
jK‴K0j=jK‴K″j→min; ð1Þ
or for many parameters
Xm j¼1
K″j K0j K0j →min; Xd
h¼1
K″hK0h K0h
→max; Xm
j¼1
jK‴j K
0
jj
jK‴j K″j jþ Xd
h¼1
jK‴h K
0
hj
jK‴h K″hj→min; 8
> > > > > > > > > < > > > > > > > > > :
ð2Þ
on approaching the state of physiological adaptation toQ. Here j is the index of directly and primarily changing parameter (j= 1, 2,…,m); andhthe index of the variable representing the work of adaptive allostatic functions (h= 1, 2,…, d). Naturally, all the differences should be within the limits of physiological adequateness of reactions.
The index of the adaptedness of subject B to the
action ofQis:
aB¼
Xm
j¼1
j K″BjK0Bjj
K0Bj
j K‴BjK0Bjj
j K‴BjK″Bjj !
þXdh¼1 j K″BhK
0
Bhj
K0Bh
j K‴BhK0Bhj
j K‴BhK″Bhj
: ð3Þ
The formula foracis the same. It should be noted that
the equalities mв = mc, dв = dc must be maintained.
Otherwise, the difference betweenaвand acwill depend
upon the differing numbers of the parameters tested since theaindex is calculated as a sum.
In caseaв >ac, there are grounds, on the basis of the
above criteria, to say that Bis more adaptive toQ, than C. In case of a contrary inequality, the conclusion should
be made that Phad an unfavorable effect on B, this
be-ing revealed in a lower resistance ofBtoQ.
The magnitude of (1) essentially depends onΔt. WhenΔt is small, K‴is close to K″, and the difference K‴ –K′may be large. In this case,∣K‴–K′ ∣/∣K‴–K″∣> > 1. Such situations should be avoided as they are difficult to analyse by means of the method suggested, since the above fraction would essentially affect the index of adaptedness. It
should be noted that in formula (2) the terms of
∣K″–K′∣/K′ are usually close to unity or
com-prise its fractions.
To avoid the above-said difficulty, one can assume two solutions. First, to divide the fraction by a constant
number, performing this operation for the given para-meter Kifor all the subjects compared. One may be to a
certain extent subjective in selecting the constant number,
and this would put Kiin an unequivalent position
com-pared with that of the other parameters. Hence, it would be desirable to select such a duration of rest period that would render K‴significantly different from K″and close to K′, while the fraction of (1) would be less than unity.
At the same time, the interval Δt = t3 – t2 (Fig. 2) should not be too great (usually from several dozen mi-nutes to several hours), since, during a prolonged rest period, one may become “involved” in a phase of super-compensation of the investigated parameter, when its value would, for a second time, differ from the baseline level. This primarily concerns indices that characterize certain reserves or resources of the organism, which
become exhausted under the effect ofQ.
It would be desirable that tв = tc. Only in that case
there would be no need to introduce Δt into formulae
(1) and (2). Moreover, this would exclude the influence of a possible nonlinearity in time of the process of re-covery, the said nonlinearity being dependent onP.
Special consideration should be given to cases when the sign, representing an alteration in a parameter under test load Q (K″–K′), changes to the opposite, depend-ing on whether or notPaffected the organism. Thus, for
instance, in the subject C the above variable increases
under the functional load (K″C >K0C,K″ –K′> 0), while
Fig. 2Two different variants of recovery dynamics for more adapted
(dotted line) and less adapted (solid line) organisms
jK″K0j
K0 →min;for the primarily changing homeostatic variable; jK″K0j
K0 →max;for the variable representing the adaptive function=process; jK‴K0j
jK‴K″j →min;for the recovery process;
under the same load the organism B responds by a decreased parameter (K″B <K0B,K″ –K′< 0). Such situa-tions are rare, but they are interesting from the theore-tical point of view and afford much information on the mechanisms of adaptive reactions.
Let us now assume that, as a result of action of P, the
mechanism responsible for maintaining Ki within its
norms has “exhausted” its possibilities, and the value of the index is either on its possible upper (lower) boundary or has returned to its initial level, but has not correspond-ingly increased (decreased) to the action ofQ. At the same
time, an organism unaffected by P possesses a large
re-serve for changing the above index up to one its boundar-ies on the background of unchanged reserves. In this case, Phas probably had an adverse effect on the system, violat-ing the natural course of the response to the action ofQ. In all cases, “paradoxical” alterations with the p value > 0.05, i.e. statistically negligible, should ostensibly be considered insignificant and taken for zero.
In this connection, the greater the number of parame-ters considered, the lesser the possibility of an erroneous conclusion, because, in a vast amount of data, an individual, possibly a chance anomalous alteration, of a given parameter, is leveled off to a greater degree.
Let us introduce into (2) a coefficient that characterizes the importance of each parameter for assessing adaptedness. As a criterion of importance, let us takeS, the stability index calculated by subtracting the variability coefficient from unity: Sx = 1 – jSDj=K0x. Here SD is the standard deviation, and Kox the arithmetical mean of the variational series, comprising the values of the given parameterKxfor a group of intact animals, whose state corresponds toFo:
Ko x¼
1
l
Xl
y¼1K
o xy;
wherexis the index of the parameter (established fixed),
x= 1, 2,…, (m + d), and y – the index of individual, (y= 1, 2, …, l).
The real minimum value of coefficient S is practically estimated at 0.5, i.e. the statistical distribution of the random magnitude K0x in a population of intact
individ-uals should approach to normal. Cases when S→0 or
SD≈ Mean, characteristic of the Poisson and
asymmet-rical distributions, are not considered by this model. To estimateS more accurately, it should be calculated for a sufficiently numerous sampling population of intact
indi-viduals. The coefficientSdepends on SDand shows the
degree of variability of a given parameter in a group of subjects. It is obvious that constant parameters of the internal medium (pH, osmotic blood pressure, body temperature in homeotherms, etc.) have low standard deviation values andSvalues close to unity.
Let us now consider how to take account of the degree of stability of an initially changing parameter when assessing its importance for estimating adaptedness. Considerable alterations in ultrastable parameters under the action of Q indicates a low resistance of the
organ-ism to Q. Contrariwise, an organism adapted to Q
responds to the latter by changes in characters of low stability, while no or insignificant changes take place in stable and ultrastable constants. Hence, ultrastable char-acteristics are more important for assessing adaptedness than labile ones. To cite an example, let us assume that
in a given organism, subjected to the action of Q, the
parameter with low stability (S= 0.7) changed by 5 units, and the ultrastable one (S= 0.9) by 10 units. Contrari-wise, in another organism the low stability and
ultra-stability characters changed by 10 and 5 units,
respectively. Then, a1= 5 + 10 = 15, a2= 10 + 5 = 15, and
a1= a2. Introduction into the formula of a corresponding
stability coefficient before each of the parameters would change the equations as follows: a1= 0.7 × 5 + 0.9 × 10 =
12.5; a2= 0.7 × 10 + 0.9 × 5 = 11.5, and a2< a1. This, in
turn, would allow to make a correct conclusion that the first organism is more adapted to Q.
Argumentation concerning adaptive function should bear a different nature. The labile functions, which are characterized by initially intensive work, but are energet-ically disadvantageous and possess low “adaptation cap-ability”, are later gradually replaced by deep, highly stable functions, which afford the organism substantial gains in the process of adaptation. Thus, people adapted to hypoxia have respiration and heart rates almost close to normal; at the same time, the changes taking place in their tissues and cells remain to be substantial [25]. Hence, it would be considered preferable to maintain that adaptation takes place on account of ultrastable and deep adaptive mechanisms. In the process of adaptation, there is a possibility of “normalization” of a “
low-pow-ered”adaptive mechanism with replacement of its
func-tions by another more stable phylogenetically older and ontogenetically earlier mechanism. Taking this into con-sideration, all experiments should be planned in such a way as to have the possibility to measure the indices of at least three adaptive functions, which differ consider-ably with regard to their stability coefficients.
aB¼Xmj¼1Sj j K″BjK
0 Bjj
K0Bj
j K‴BjK 0 Bjj j K‴BjK″Bjj
!
þXdh¼1Sh
j K″BhK 0 Bhj K0Bh
j K‴BhK 0 Bhj j K‴BhK″Bhj
: ð4Þ
CASE II: two groups of organisms, repeated measure parallel experimental design
Let us now consider the case when two groups of
sub-jects numbering nв and nсand selected at random from
a qualitatively homogenous population are subjected
to the effects of P and Q. Let us assume that, as in
the first case with two organisms, concrete experi-mental techniques allow us to record the necessary parameters for each subject in four (or three for
group C) of the above said states (Fo
, F′, F″, F ‴), the technique of measuring the characteristics not affecting the state of the subject.
Then, having composed and classically treated vari-ational series based on calculated individual magnitudes aiandar, one can obtain the mean values
AB¼aB¼
1 nB
XnB
i¼1ai¼
¼ 1
nB
XnB
i¼1
" Xm
j¼1Sj
Kij000−Kij0
Kij000−Kij00
Kij
00
−Kij0
Kij0 !
þXd
h¼1Sh
K000ih−K 0 ih
K000ih−K 00 ih
þ K
00 ih−K
0 ih
K0ih
! #
AC¼ac¼ 1
nc
Xnc
r¼1ar
8 > > > > > > > > > > > > > > < > > > > > > > > > > > > > > :
ð5Þ
and standard deviations, make up confidence intervals, and estimate the authenticity of the difference between
AB and AC with any pre-estimated probability of error.
In formulae (5),i is the index of the individual in group
B,rthe index of an organism in groupC, jthe index of
a directly changing homeostatic parameter, and h the parameter index of allostatic functions. Multipliers 1/nB
and 1/nCmay be omitted in formulae ifnB=nC.
CASE III: parallel design
The next design is widely distributed in experimental biology and physiology, where the imperfection of inves-tigation techniques or their specific properties often lead to the necessity of killing the animal in order to obtain certain characteristics of its internal medium. This is justified for almost all morphological and biochemical investigation methods with the exception of cases in-volving biological fluids. In this case, several animals are killed in eachFstate, and, on the basis of their individual properties, the mean value for each parameter (in case of need, its SD also) is estimated:
K0t ¼1 g
Xg
f¼1K 0
tf; ð6Þ
wherefis the index of individual,gthe index of individ-uals used for obtaining parametertin stateF′,tthe par-ameter index, t = 1, 2,…, (m + d). Accounting for this important circumstance, each parameter in (4) should be replaced by its mean value (6).
In case III, it is more difficult to calculate the standard deviation for the index of adaptedness than in Case II, even though there are mean error for each parameter in each of the states. The problem is to calculate the stand-ard variation of the sum of (4) with corresponding
replacement of K byK in accord with (6).
Example 1
Materials and methods
Let us consider, for example, the calculation of the index of adaptedness for several groups of animals. This case
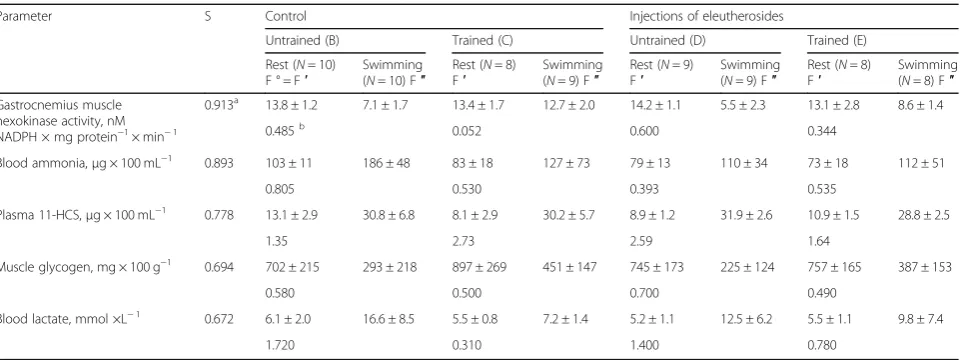
Table 1Biochemical parameters in rats subjected to physical training, eleutherosides administration, and acute exercise
Parameter S Control Injections of eleutherosides
Untrained (B) Trained (C) Untrained (D) Trained (E)
Rest (N= 10)
F ° = F′ Swimming(N= 10) F″ FRest (′ N= 8) Swimming(N= 9) F″ FRest (′ N= 9) Swimming(N= 9) F″ Rest (F′ N= 8) Swimming(N= 8) F″
Gastrocnemius muscle hexokinase activity, nM NADPH × mg protein−1× min−1
0.913a 13.8 ± 1.2 7.1 ± 1.7 13.4 ± 1.7 12.7 ± 2.0 14.2 ± 1.1 5.5 ± 2.3 13.1 ± 2.8 8.6 ± 1.4
0.485b
0.052 0.600 0.344
Blood ammonia,μg × 100 mL−1
0.893 103 ± 11 186 ± 48 83 ± 18 127 ± 73 79 ± 13 110 ± 34 73 ± 18 112 ± 51
0.805 0.530 0.393 0.535
Plasma 11-HCS,μg × 100 mL−1
0.778 13.1 ± 2.9 30.8 ± 6.8 8.1 ± 2.9 30.2 ± 5.7 8.9 ± 1.2 31.9 ± 2.6 10.9 ± 1.5 28.8 ± 2.5
1.35 2.73 2.59 1.64
Muscle glycogen, mg × 100 g−1
0.694 702 ± 215 293 ± 218 897 ± 269 451 ± 147 745 ± 173 225 ± 124 757 ± 165 387 ± 153
0.580 0.500 0.700 0.490
Blood lactate, mmol ×L−1
0.672 6.1 ± 2.0 16.6 ± 8.5 5.5 ± 0.8 7.2 ± 1.4 5.2 ± 1.1 12.5 ± 6.2 5.5 ± 1.1 9.8 ± 7.4
1.720 0.310 1.400 0.780
may be assigned to the last and, apparently, the most complex of the algorithm described. The experiment was performed by the author in collaboration with Drs. A.V. Shulga, E. Khasina, and G. Bezdetko. The numerical
application of the method is presented in Tables 1
and 2.
Sexually mature male Wistar rats from groups Dand
E (Table 1) were subcutaneously injected with 0.5%
aqueous solution of a sum of eleutherosides (active sub-stances from the roots of the Far Eastern plant Eleuther-ococcus senticosus). This remedy like ginseng belongs to adaptogenic herbs [26,27] that are known to hold a cap-acity to increase stress resistance, physical and mental performance without increasing oxygen consumption [28]. The injections were made in dose of 5 mg/kg twice
a day for fourteen days. Animals from groups C and E
were trained daily for a fortnight by swimming with a 6% load on the tail. The initial session was 12 min, plus 2 min every subsequent day. Animals from group C were injected with an isotonic solution of sodium chloride. The animals were killed 46 h. after completing the last swimming session. Immediately before that, they were
subjected to a functional load involving 15-min
swimming with 6% load in water, temperature 29–31 °C.
Some of the rats were decapitated prior to swimming (state of rest).
Results
The results of the experiment and their treatment for obtaining the index of adaptedness are presented
in Tables 1 and 2. The concentration of
11-hydroxycorticisteroids, the major of which is cortico-sterone in rats, is considered an adaptive parameter and in accordance with the criteria (2) was used with positive sign while calculating the index. Plus and minus for each physiological or biochemical variable in Tables2and4do not mean the direction of changes but play technical (assistant) role and indicate the sign which should be assigned to the given parameter while calculating the sum. In analyzing the bottom line in Table2, one may con-clude that trained animals (groupC) are the most resist-ant to short-time intensive muscular load. Untrained
and trained animals from the groups D and E, which
were administered with eleutherosides, “rank” second
and third, respectively. Intact rats from the group B
proved to be least resistant to the above load. The most noteworthy fact is that the injection of eleutherosides simulates training and exerts a protective effect. This
conclusion is evident from the comparison of A values
for groupsBandD.
Example 2
Materials and methods
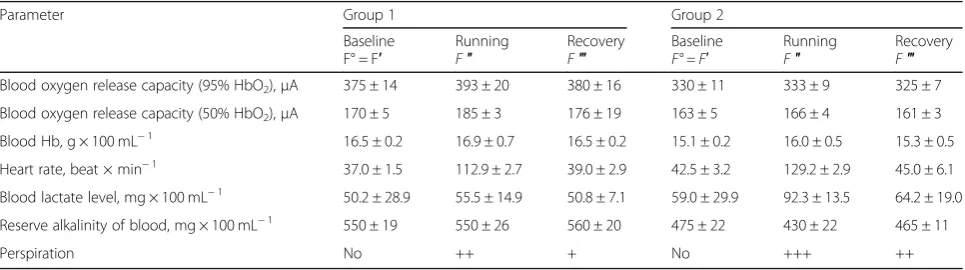
Let us now consider one more example when the index of adaptedness was calculated for two groups of race horses differing in the functional status of the individuals
[29]. The load intensity corresponded to about 80% of
the maximum. This case takes into account recovery of variables 1 h after the test running (Tables3and4). The perspiration, assessed visually and semi quantitatively, was not taken into analysis. The stability coefficients of other indices were found as the mean values of two Table 2Calculation of the index of rat adaptedness to
short-term intensive muscular work
Parameter Control Introduction of eleutherosides
Untrained, B Trained, C Untrained, D Trained, E
11-HCS + 1.060 + 2.120 + 2.010 + 1.273
Hexokinase −0.445 −0.048 −0.500 −0.315
Lactate −1.163 −0.209 −0.946 −0.527
Ammonia −0.715 −0.473 −0.350 −0.473
Glycogen −0.402 −0.347 −0.486 −0.340
A¼PSjK″K0j
K0 −1.665 + 1.043 −0.272 −0.382
Adaptive rank 4 1 2 3
The index was computed per formula (4) with corresponding substitution of (6). Terms characterizing normalisation of parameters during recovery are absent
Table 3Biochemical and physiological variables in horses before and after racing
Parameter Group 1 Group 2
Baseline F° = F′
Running
F″ RecoveryF‴ BaselineF° = F′ RunningF″ RecoveryF‴
Blood oxygen release capacity (95% HbO2),μA 375 ± 14 393 ± 20 380 ± 16 330 ± 11 333 ± 9 325 ± 7
Blood oxygen release capacity (50% HbO2),μA 170 ± 5 185 ± 3 176 ± 19 163 ± 5 166 ± 4 161 ± 3
Blood Hb, g × 100 mL−1 16.5 ± 0.2 16.9 ± 0.7 16.5 ± 0.2 15.1 ± 0.2 16.0 ± 0.5 15.3 ± 0.5
Heart rate, beat × min−1 37.0 ± 1.5 112.9 ± 2.7 39.0 ± 2.9 42.5 ± 3.2 129.2 ± 2.9 45.0 ± 6.1
Blood lactate level, mg × 100 mL−1 50.2 ± 28.9 55.5 ± 14.9 50.8 ± 7.1 59.0 ± 29.9 92.3 ± 13.5 64.2 ± 19.0
Reserve alkalinity of blood, mg × 100 mL−1 550 ± 19 550 ± 26 560 ± 20 475 ± 22 430 ± 22 465 ± 11
Perspiration No ++ + No +++ ++
magnitudes calculated separately for F01and F02.
Increased pulse rate up to the definite limit, when in-dices of heart efficiency begin to decline, is undoubtedly an adaptive trait. Adaptive responses also include increased rate of oxygen release by the blood and increased concentration of hemoglobin.
Results
In analyzing the changes in the variables studied, as well as the energetic efficiency of animals, Epstein and Rudoy [29] have characterized the horses from groups 1 and 2 as robust and weak, respectively. Thus, by means of precise quantitative calculations, the proposed method confirmed the conclusion of the above authors regarding the functional state if the animals from the groups compared.
General discussion
In discussion, the following important notes should be
made. The index of adaptedness A has no independent
value whatsoever if not compared with the index of another group (or other groups) of organisms studied in parallel. According to the differentiation offered by Prosser and Brown [30], only regulating organisms, but not conformers, can be analyzed by this method. It is implied that the proposed algorithm can not be applicable to species of “poikilo-organisms”, or non-homeostatic animals, that are unable to maintain constant parameters ofmilieu interieur.
The calculation of SD for evaluating interindividual vari-ability and hence functional stvari-ability makes sense for nor-mally or at least symmetrically distributed variables. Therefore, non-Gaussian distributed parameters cannot be introduced in the proposed model. Further, it cannot oper-ate parameters of nonlinear responses, particularly demon-strating the exponential dynamics during recovery process.
When referring to the topic, such terms as resistance, stability, tolerance, fitness, acclimation, coping, and
adaptation are often equalized. This, however, is hardly justified, and, being a theoretical question, remains to be substantiated and should be the subject of a special study.
To be sure, the calculation of the suggested index of adaptedness cannot replace a detailed analysis of all the changes observed, since such an analysis is essential for elucidating specific mechanisms of adaptation.
Conclusion
The model may be applied for assessing the functional state and resistance of athletes under different kinds of loads. It may also be used to study cross adaptation to two or several constraints, and in all experiments whose
scheme may be represented by Fig.1. A probable
appli-cation of the method is the screening of pharmacological substances that one way or another affect the process of adaptation. Thus, the index of adaptedness makes it pos-sible to quantify the integral response of bio systems to the action of disturbing factors. The said index is useful in that it replaces wordy descriptions of large tables that reveal alterations in numerous parameters of many of the subjects studied. The use of the model for analyzing experimental results would unavoidably force the inves-tigator to take a more careful approach in designing experiment and in selecting the respective test groups, states and parameters. This, in turn, would lead to a more thorough methodological substantiation of the investigations in question.
Abbreviations
11-HCS:11-hydroxycorticosteroids; ATP: Adenosine triphosphate; FFA: Free fatty acids; P50: Blood oxygen release capacity at 50% HbO2; P95: Blood oxygen release capacity at 95% HbO2; SD: Standard deviation
Acknowledgements Not applicable.
Author’s contribution
The author read and approved the final manuscript.
Table 4Calculation of the index of adaptedness of race horses to physical loads
Parameter Group 1 Group 2
S jK″K0j
K0
jK‴K0j
jK‴K″j S jK
″K0j
K0
jK‴K0j
jK‴K″j
P95 0.963 + 0.048 −0.385 0.967 + 0.009 −0.625
P50 0.971 + 0.088 −0.667 0.970 + 0.018 −0.400
Hemoglobin 0.988 + 0.024 −0 0.987 + 0.059 −0.286
Heart rate 0.960 + 2.059 −0.027 0.925 + 2.040 −0.030
Lactate 0.424 −0.106 −0.128 0.493 −0.565 −0.185
Blood reserve alkalinity 0.965 −0 −1.000 0.954 −0.095 −0.286
A¼PSððÞjK″K0K0jjK 000K0j
jK000K″jÞ −0.094 −0.346
Funding
No funding bodies were utilized in the design, analysis, and writing of the manuscript.
Availability of data and materials
The program for calculating the index of adaptedness, designed in EXCEL computer package, for any experimental data and other materials are freely available from the author upon request.
Ethics approval
The animals were cared for in accordance with the Institutional Guide for the Care and Use of Laboratory Animals. The experimental protocol was approved by the Institute Ethical Committee.
Consent for publication Not applicable.
Competing interests
The author declares that he has no competing interests.
Received: 12 March 2019 Accepted: 22 July 2019
References
1. Peck JR, Waxman D. What is adaptation and how it should be measured? J Theor Biol. 2018;447:190–8.
2. Peper A. A theory of drug tolerance and dependence I: a conceptual analysis. J Theor Biol. 2004;229:477–90.
3. Peper A. A theory of drug tolerance and dependence II: the mathematical model. J Theor Biol. 2004;229:491–500.
4. Tonhajzerova I, Mestanik M. New perspectives in the model of stress response. Physiol Res. 2017;66:S173–85.
5. Shi W, et al. Adaptation with transcriptional regulation. Sci Rep. 2017;7: 42648.
6. Masselot P, et al. A new look at weather-related health impacts through functional regression. Sci Rep. 2018;8:15241.
7. Yadav S, Sood A. Adaptation in networks: a review. Int J Eng Comput Sci. 2013;2:3278–81.
8. De Palo G, et al. Common dynamical features of sensory adaptation in photoreceptors and olfactory sensory neurons. Sci Rep. 2013;3:1251. 9. Dawson EA, et al. Do acute effects of exercise on vascular function predict
adaptation to training? Eur J Appl Physiol. 2018;118:523–30.
10. O'Neill DP, Robbins PA. A mechanistic physiochemical model of carbon dioxide transport in blood. J Appl Physiol. 2017;122:283–95.
11. Busso T, et al. Modeling of adaptations to physical training by using a recursive least squares algorithm. J Appl Physiol. 1997;82:1685–93. 12. Wood RE, et al. Applying a mathematical model to training adaptation in a
distant runner. Eur J Appl Physiol. 2005;94:310–6.
13. Pries AR, Secomb TW, Gaehtgens P. Structural adaptation and stability of microvascular networks: theory and simulations. Am J Physiology. 1998;275: H349–60.
14. Gorban AN, et al. Law of the minimum paradoxes. Bull Math Biol. 2011;73: 2013–44.
15. Baffy G, Loscalzo J. Complexity and network dynamics in physiological adaptation: an integrated view. Physiol Behav. 2014;131:49–56.
16. Arminjon M. Birth of the allostatic model: from Cannon's biocracy to critical physiology. J History Biol. 2016;49:397–423.
17. Selye H. The stress of life. London: Longmans Green; 1956.
18. Romero LM, Dickens MJ, Cyr NE. The reactive scope model–a new model integrating homeostasis, allostasis, and stress. Horm Behav. 2009;55:375–89. 19. McEwen BS. Stress: homeostasis, rheostasis, reactive scope, allostasis and
allostatic load. In: Reference module in neuroscience and biobehavioral psychology: Elsevier; 2017.https://doi.org/10.1016/B978-0-12-809324-5.02867-4. 20. Richalet J-P. A proposed classification of environmental adaptation: the
example of high altitude. Rev Environ Sci Biotechnol. 2007;6:223–9. 21. Cannon W. The wisdom of the body. New York: W.W. Norton & Co.; 1932. 22. Paccotti P, et al. Effects of high-intensity isokinetic exercise on salivary
cortisol in athletes with different training schedules: relationships to serum cortisol and lactate. Int J Sports Med. 2005;26:747–55.
23. Roberts CK, et al. Resistance training increases SHBG in overweight/obese young men. Metabolism. 2013;62:725–33.
24. Grandys M, et al. The importance of the training-induced decrease in basal cortisol concentration in the improvement in muscular performance in humans. Physiol Res. 2016;65:109–20.
25. Bailey DM, Davis B. Physiological implications of altitude training for endurance performance: a review. Br J Sport Med. 1997;31:183–90. 26. Brekhman II, Dardymov IV. New substances of plant origin which increase
nonspecific resistance. Annu Rev Pharmacol. 1969;9:419–30. 27. Panossian A. Understanding adaptogenic activity: specificity of the
pharmacological action of adaptogens and other phytochemicals. Ann N Y Acad Sci. 2017;140:49–64.
28. Oliynyk S, Oh S. Actoprotective effect of ginseng: improving mental and physical performance. J Ginseng Res. 2013;37:144–66.
29. Epstein IM, Rudoy VB. On the dependence of blood oxygen release upon physical load and functional state of the organism of sport horses. In: Korobkov AV, editor. Problems in Sport Physiol. Moscow: Inst. Fiz. Cult; 1972. p. 120–3. Rus.
30. Prosser CL, Brown FA. Comparative animal physiology. Philadelphia: Saunders; 1961.
Publisher’s Note