R E S E A R C H A R T I C L E
Open Access
User satisfaction with public oral health
services in the Brazilian Unified Health
System
Leonardo de Paula Amorim
1, Maria Inês Barreiros Senna
2*, Gizelton Pereira Alencar
3, Lorrany Gabriela Rodrigues
4,
Janice Simpson de Paula
5and Raquel Conceição Ferreira
5Abstract
Background:User satisfaction represents a patient-centered measure that should be used to assess the quality of oral health services. This study investigated the differences in user satisfaction with public oral health services according to the sociodemographic user profile and the quality of oral health services in primary health care in Brazil.
Methods:Secondary data from a national program obtained through interviews with users were analyzed. Satisfaction was based on the Swan’model relating to perceptions regarding the service performance, assessment of overall satisfaction and the intention to avoid the service in the future. The exploratory variables were
demographic characteristics of the users and the quality of the primary service from the user’s viewpoint, considering the dimensions: access; receptivity of spontaneous demand; integral health care; bonding, accountability, and coordination of care.
Results:A total of 37,262 users participated, and 65.51% reported satisfaction with the oral health service, that was higher among those > 20 years old and beneficiaries of the Family Grant Program and lower among users with a higher level of schooling and those who reported being employed. Users who rated oral health service positively were more satisfied.
Conclusions:Socioeconomically disadvantaged user was more satisfied with oral health services and the
satisfaction increased with age. The improvement in the quality of oral health services in primary care can result in greater satisfaction.
Keywords:Patient satisfaction, Oral health, Primary health care, Health services research, Family health, Health evaluation, Dental health services
Background
Public oral health services in Brazil are mainly provided by oral health teams whose members are the dentist and an oral health assistant and/or an oral health technician. They are part of the healthcare teams of the Family Health Strategy at primary health care units. Since the launch of the National Oral Health Policy [1] in 2004, the number of oral health increased from 20.5% in 2003
[2] to 52.1% in 2018 [3] indicating the large expansion of the public oral health services in Brazil .
The National Oral Health Policy proposed a regular protocol to evaluate the quality of the services and care practices [1]. The implementation of the evaluation process in primary health care in Brazil was consolidated with the National Program for Improving Access to and the Quality of Primary Care (PMAQ-AB) [4], which is nationally stan-dardized by the policies of the National Primary Care Policy [5] and the National Oral Health Policy [1].
The evaluation of services in PMAQ-AB was based on the model proposed by Donabedian, as a conceptual ref-erence that considers the components of structure,
© The Author(s). 2019Open AccessThis article is distributed under the terms of the Creative Commons Attribution 4.0 International License (http://creativecommons.org/licenses/by/4.0/), which permits unrestricted use, distribution, and reproduction in any medium, provided you give appropriate credit to the original author(s) and the source, provide a link to the Creative Commons license, and indicate if changes were made. The Creative Commons Public Domain Dedication waiver (http://creativecommons.org/publicdomain/zero/1.0/) applies to the data made available in this article, unless otherwise stated.
* Correspondence:mibsenna@hotmail.com
2Department of Dental Clinic, Pathology and Surgery, School of Dentistry,
process and result. Developed in the 1960s, the model is widely used and is a key reference in the analysis of health services and care practices [6]. The program adopts a set of strategies for the qualification, monitoring and evalu-ation of health teams linked to a financial incentive to mu-nicipalities that meet the access and quality standards and involves several rounds of self- and external assessment. The accreditation process includes the assessment of per-formance indicators, interviews with health professionals and users as well as facilities assessments in the health units. The quality of oral health services from the perspec-tive of users is rated based on the following dimensions: access; receptivity of spontaneous demand; integral health care; bonding, accountability, coordination of care; and satisfaction with services. The PMAQ-AB was organized in cycles and to date, two cycles have taken place in 2011/ 2012, 2013/2014. The second cycle of the PMAQ-AB is the most current with consolidated results, and there was a considerable increase in the membership of teams and cities, in addition to the improvement in the reliability of the evaluation instrument. It is therefore important to give continuity to such investigations, including data from the third cycle of PMAQ-AB, which is currently underway [4]. The users’ responses are recognized as indicators of the quality of health services [7, 8]. Indeed, satisfaction is considered a healthcare outcome measure [9,10]. The evaluation of user satisfaction with health services strengthens the participation of community members by recognizing their civil rights and involving them in the responsibility for the co-production of the health care, which can help guide planning and decision-making pro-cesses concerning health management [11].
Recognizing the importance of users in the context of a national program of evaluation of public service qual-ity, this study investigated the differences in user satis-faction with oral health services according to the sociodemographic user profile and the quality of oral health services in primary health care in Brazil.
Methods
Study design, population, and sample
An analytical study was conducted using public secondary data from the external evaluation of the second cycle of the PMAQ-AB, which occurred in 2013 and 2014 with the participation of 5072 Brazilian municipalities and 19, 946 oral health teams [12]. This study was approved by the Research and Ethics Committee from the Federal Uni-versity of Minas Gerais (CAEE no. 76981917.4.0000.5149). The public database does not have the participant’s identi-fication to guaranteeing confidentiality.
The questionnaire for the evaluation was constructed and validated by specialists, including technicians and external consultants from the Ministry of Health of Brazil, representatives of states and municipalities, as
well as instances of social control. This process was part of project denominated Evaluation for the Improvement of Quality of the Family Health Strategy implemented in 2005. The items of the questionnaire were based on quality standards established according to the norms, protocols, principles, and guidelines to actions and prac-tices organization in primary care [12]. Data were ob-tained through interviews with four health service users at each primary care unit who did not have a medical, dental or nursing appointment on the day of the inter-view. This study included data from participants who used oral health services at primary care units. A team of evaluators without a link to the service which had previously undergone training at education and research institutions conducted the interviews.
The methodology used by the PMAQ-AB for the evaluation of the oral health teams, including voluntary adherence to the program, may have resulted in selec-tion bias since the teams that joined might be those with a better structure and work process. Selection bias is also a possibility about the users interviewed, as individ-uals with no access to health services were not included, which could have led to an underestimation of negative ratings. Thus, satisfaction and the quality of oral health services may be overestimated.
Assessment of the satisfaction with oral health service
User satisfaction with the oral health service was ana-lyzed based on the four-stage model proposed by Swan, which is defined by the constructs: perception of service performance; confirmation of expectations regarding performance and perception of fair treatment; overall satisfaction; and the intention to revisit or avoid the ser-vice in the future [13]. The satisfaction variable was composed of four aspects: i) evaluation of the care re-ceived from oral health teams (very good, good, fair, poor or very poor); ii) user satisfaction with the service offered by the dentist (scale of 0 to 10); iii) user satisfac-tion with the service offered by the oral health assistant/ oral health technician (scale of 0 to 10) and iv) the user’s desire to change the dentist or primary care unit if given the option (yes, no). Users who had assessed the re-ceived oral health care positively (good or very good), who assigned nine or ten points for satisfaction with the care received from the dentist and oral health assistant/ oral health technician and those reported that they would not change the dentist or primary care unit were considered satisfied. Users with any other combination of answers were considered unsatisfied.
Exploratory variables Sociodemographic user profile
years of schooling, currently formally or informally employed (yes; no) and beneficiary of the Brazilian Family Grant Program (yes; no). Age group in years was catego-rized based on the lifecycle: adolescent (16 to 19 years), young adult (20 to 39 years), adult (40 to 59 years) and elder (60 years and over). Self-reported skin color/race was evaluated as white, black, yellow and brown or indigenous, according to the classification of the Brazilian Institute of Geography and Statistics [14]. Considering the stages of basic education in Brazil, schooling was categorized as illiterate or functionally illiterate (including the original non-literate categories and the ability to read and write), one to eight years of study, nine to 11 years of study and 12 or more years of study.
Evaluation of quality of oral health services regarding primary care attributes from the perspective of users
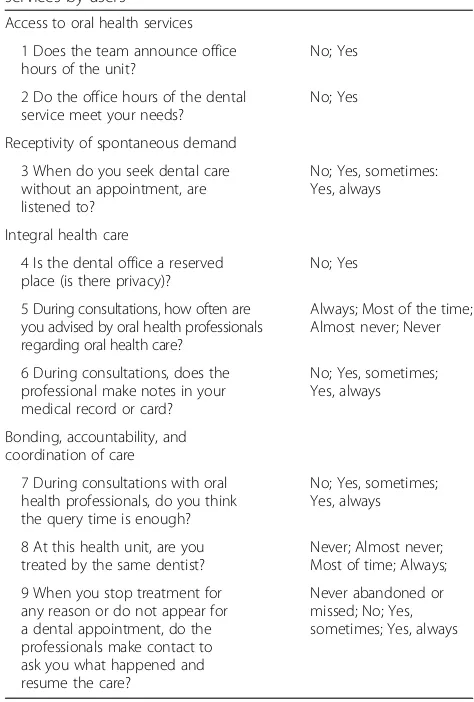
The users rated the quality of the health services address-ing primary care attributes accordaddress-ing to the proposal of the PMAQ-AB: access, receptivity of spontaneous demand for care, integral health care, ties, accountability, and co-ordination of care. The selected variables were described in Table1.
Statistical analysis
The data were submitted to descriptive analysis. Associa-tions between user satisfaction and variables related to the sociodemographic user profile and the quality of oral health services (access; receptivity of spontaneous de-mand; integral health care; bonding, accountability, and coordination of care) were investigated through multiple logistic regression analyses performed with the software Stata 14.0. For the evaluation of the goodness-of-fit of the model, residuals analysis based on the standardized Pearson residue and deviance was performed according to Hosmer, Lemeshow, and Sturdivant (2013) [15]. Three users were identified as having very high deviance residual and were excluded from the final model. After the residual analysis, Hosmer Lemeshow’s modified goodness-of-fit test for large samples (number of groups = number of individuals/2) was used [16].
Results
A total of 114,615 users, among whom 37,262 (32.51%) used oral health services, were included in the present analysis. Most users were covered by family health unit with an oral health team (95.34%). More than 70% of users gave positive responses to questions on satisfaction (Table 2). Considering the set of selected items, 65.51% (n= 24,412) of the users were satisfied.
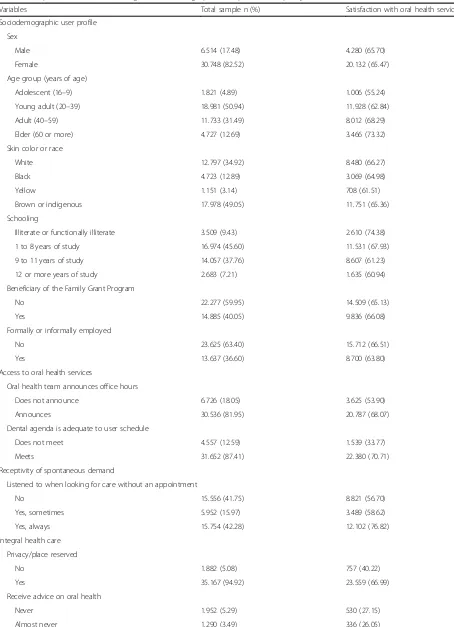
Table 3shows the distribution of the satisfaction with oral health services according to the exploratory vari-ables. A low satisfaction was found among users who re-ported that the dental agenda is inadequate to user
Table 1Variables to the evaluation of the quality of oral health services by users
Access to oral health services
1 Does the team announce office hours of the unit?
No; Yes
2 Do the office hours of the dental service meet your needs?
No; Yes
Receptivity of spontaneous demand
3 When do you seek dental care without an appointment, are listened to?
No; Yes, sometimes: Yes, always
Integral health care
4 Is the dental office a reserved place (is there privacy)?
No; Yes
5 During consultations, how often are you advised by oral health professionals regarding oral health care?
Always; Most of the time; Almost never; Never
6 During consultations, does the professional make notes in your medical record or card?
No; Yes, sometimes; Yes, always
Bonding, accountability, and coordination of care
7 During consultations with oral health professionals, do you think the query time is enough?
No; Yes, sometimes; Yes, always
8 At this health unit, are you treated by the same dentist?
Never; Almost never; Most of time; Always;
9 When you stop treatment for any reason or do not appear for a dental appointment, do the professionals make contact to ask you what happened and resume the care?
Never abandoned or missed; No; Yes, sometimes; Yes, always
Source: External evaluation questionnaire of the second cycle of the PMAQ-AB, module III, 2013
Table 2Distribution of users concerning satisfaction with oral health services
Variables n %
Satisfaction with care and with professionals on the oral health team
Evaluation of the care received by the oral health team
Very poor, poor or fair 4.352 11.74
Good or very good 32.738 88.27
User satisfaction with the service offered by the dentist
0 to 8 8.721 23.41
9 or 10 28.541 76.59
User satisfaction with the service offered by the oral health assistance/technician
0 to 8 10.445 28.03
9 or 10 26.817 71.97
User’s desire to change the dentist or primary care unit if given the option
No 5.410 14.52
Table 3Proportion of users according to sociodemographic user profile and quality of oral health care
Variables Total sample n (%) Satisfaction with oral health services n (%)
Sociodemographic user profile
Sex
Male 6.514 (17.48) 4.280 (65.70)
Female 30.748 (82.52) 20.132 (65.47)
Age group (years of age)
Adolescent (16–9) 1.821 (4.89) 1.006 (55.24)
Young adult (20–39) 18.981 (50.94) 11.928 (62.84)
Adult (40–59) 11.733 (31.49) 8.012 (68.29)
Elder (60 or more) 4.727 (12.69) 3.466 (73.32)
Skin color or race
White 12.797 (34.92) 8.480 (66.27)
Black 4.723 (12.89) 3.069 (64.98)
Yellow 1.151 (3.14) 708 (61.51)
Brown or indigenous 17.978 (49.05) 11.751 (65.36)
Schooling
Illiterate or functionally illiterate 3.509 (9.43) 2.610 (74.38)
1 to 8 years of study 16.974 (45.60) 11.531 (67.93)
9 to 11 years of study 14.057 (37.76) 8.607 (61.23)
12 or more years of study 2.683 (7.21) 1.635 (60.94)
Beneficiary of the Family Grant Program
No 22.277 (59.95) 14.509 (65.13)
Yes 14.885 (40.05) 9.836 (66.08)
Formally or informally employed
No 23.625 (63.40) 15.712 (66.51)
Yes 13.637 (36.60) 8.700 (63.80)
Access to oral health services
Oral health team announces office hours
Does not announce 6.726 (18.05) 3.625 (53.90)
Announces 30.536 (81.95) 20.787 (68.07)
Dental agenda is adequate to user schedule
Does not meet 4.557 (12.59) 1.539 (33.77)
Meets 31.652 (87.41) 22.380 (70.71)
Receptivity of spontaneous demand
Listened to when looking for care without an appointment
No 15.556 (41.75) 8.821 (56.70)
Yes, sometimes 5.952 (15.97) 3.489 (58.62)
Yes, always 15.754 (42.28) 12.102 (76.82)
Integral health care
Privacy/place reserved
No 1.882 (5.08) 757 (40.22)
Yes 35.167 (94.92) 23.559 (66.99)
Receive advice on oral health
Never 1.952 (5.29) 530 (27.15)
schedule, those who reported never or nearly never re-ceiving oral health advice, those who reported that the dentist did not record the oral findings in the medical records, those who reported that the time allotted for the dental appointment was insufficient and those who reported never being seen by the same dentist.
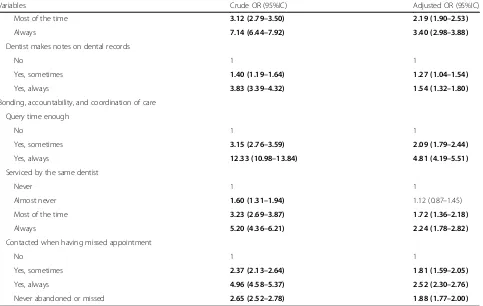
The final regression model shows that the chance of sat-isfaction with oral health services was higher among users over 20 years of age and beneficiaries of the Family Allow-ance Program, whereas satisfaction was lower among users with a higher level of schooling and who reported being employed. Users who perceived better quality re-garding oral health services considering the attributes of primary care reported greater satisfaction (Table4).
Discussion
Most users reported satisfaction with oral health services and the satisfaction was higher among those who evalu-ated the oral health services about the attributes of pri-mary care positively. Age and socioeconomic status were associated with satisfaction with oral health services.
The satisfaction with oral health services was higher among beneficiaries of the Family Grant Program. It is a national cash transfer program that stipulates conditions for beneficiaries regarding the use of health services and education. Families receiving this benefit must keep their
school-age children enrolled as well as adopt basic health measures, including immunization and prenatal monitoring [17]. The program integrates a political agenda of social protection and reduction of inequities in health and favored access to health services of a population historically socially excluded, with positive ef-fects in reducing child mortality [18], health conditions and well-being [19]. This association between unfavor-able social conditions and a higher frequency of satisfac-tion was also identified among those with a lower level of education and unemployed. These findings indicate that the social inclusion of these groups, through access to health services, in addition to promoting equity, prompt satisfaction with the oral health service.
The satisfaction increased with aging. This finding is in agreement with data reported in a previous study con-ducted in Brazil, in which the youngest participants re-ported the least satisfaction with oral health services [20]. Similar findings were reported in studies conducted in the primary care setting in Saudi Arabia [21] as well as at hos-pital services in Sweden [22] and the United States [23]. A dose-response gradient was also found concerning school-ing, as a lower level of schooling favored greater levels of satisfaction. As pointed out in a study evaluating user sat-isfaction with primary care in a small Brazilian city, a low level of education can exert an influence on the perception Table 3Proportion of users according to sociodemographic user profile and quality of oral health care(Continued)
Variables Total sample n (%) Satisfaction with oral health services n (%)
Most of the time 5.436 (14.73) 2.917 (53.66)
Always 28.238 (76.49) 20.495 (72.58)
Dentist makes notes on dental records
No 1.183 (3.33) 427 (36.09)
Yes, sometimes 1.419 (4.00) 624 (43.97)
Yes, always 32.912 (92.67) 22.467 (68.26)
Bonding, accountability, and coordination of care
Query time enough
No 2.118 (5.73) 366 (17.28)
Yes, sometimes 3.415 (9.25) 1.348 (39.47)
Yes, always 31.403 (85.02) 22.567 (71.86)
Serviced by the same dentist
Never 586 (1.60) 183 (31.23)
Almost never 2.023 (5.54) 848 (41.92)
Most of the time 6.580 (18.01) 3.904 (59.33)
Always 27.340 (74.84) 19.176 (70.14)
Contacted when having missed an appointment
No 9.246 (25.19) 4.337 (46.91)
Yes, sometimes 1.767 (4.81) 1.196 (67.69)
Yes, always 5.397 (14.71) 4.393 (81.40)
Table 4Factors associated with satisfaction with oral health services in multivariate logistics analysis
Variables Crude OR (95%IC) Adjusted OR (95%IC)
Sociodemographic user profile
Sex
Male 1
Female 0.99 (0.94–1.05)
Age group (years)
Adolescent (16–9) 1 1
Young adult (20–39) 1.37 (1.24–1.51) 1.24 (1.10–1.40)
Adult (40–59) 1.74 (1.58–1.93) 1.37 (1.21–1.55)
Elder (60 or more) 2.23 (1.99–2.49) 1.57 (1.36–1.81)
Skin color/race
White 1 1
Black 0.94 (0.88–1,01) 0.98 (0.90–1.06)
Yellow 0.81 (0.72–0,92) 0.92 (0.80–1.07)
Brown/mestizo or indigenous 0.96 (0.92–1,01) 1.06 (1.00–1.12)
Schooling
Illiterate or functionally illiterate 1 1
1 to 8 years of study 0.73 (0.67–0.79) 0.75 (0.68–0.83)
9 to 11 years of study 0.54 (0.50–0.59) 0.61 (0.54–0.68)
12 or more years of study 0.54 (0.48–0.60) 0.58 (0.50–0.67)
Formally or informally employed
No 1 1
Yes 0.89 (0.85–0.93) 0.91 (0.86–0.96)
Beneficiary of the Family Grant Program
No 1 1
Yes 1.04 (1.00–1.09) 1.13 (1.07–1.20)
Access to oral health services
Oral health team announces office hours
Does not announce 1 1
Announces 1.83 (1.73–1.93) 1.18 (1.10-.,27)
Dental agenda is adequate to user schedule
Does not meet 1 1
Meets 4.74 (4.44–5.07) 2.22 (2.05–2.41)
Receptivity of spontaneous demand
Listened to when looking for care without an appointment
No 1 1
Yes, sometimes 1.08 (1.02–1.15) 1,05 (0,97-1,13)
Yes, always 2.53 (2.41–2.66) 1.62 (1.52–1.71)
Integral health care
Privacy/place reserved
No 1 1
Yes 3.02 (2.75–3.32) 1.79 (1.59–2.02)
Receive advice on oral health
Never 1 1
of health problems and lead to a less critical value judg-ment regarding the care received [24].
Users who gave better ratings of the oral health teams about the quality attributes of primary care reported greater satisfaction with oral health services. Concerning the access dimension, a higher satisfaction was found among those who reported that the dental agenda is ad-equate to user schedule and that the oral health team an-nounces office hours. A study evaluating the perception of users regarding the organization of Brazilian public dental services pointed out that convenience concerning dental office hours favored satisfaction [25]. In the present inves-tigation, users reported that most of the oral health teams worked in two shifts: morning and afternoon (77.89%) (data not shown). It is possible that those who were unsat-isfied and reported that dental agenda is inadequate to user schedule have daily activities that hinder the use of the service. The organization of the agenda including di-versified shifts and a night shift could expand access and enhance satisfaction. Indeed, offering evening appoint-ments are considered a relevant indicator in assessing the quality of oral health care [26].
Higher satisfaction was observed among users who were listened when looking for services without an appoint-ment than those that were not. Although receptivity is a
guiding aspect of the National Policy on Humanization [27], a narrative review highlighted a shortcoming in the training of dentists and managers regarding the challenges of receptivity in the practice of oral health care [28]. One study pointed out that the humanization of care, as well as listening and guidance processes, were associated with the quality of receptivity at oral health services [29]. Thus, the improvement of the quality of oral health care should not be restricted to the technical training of the team, but also to attempt to develop the listening skill aiming to meet the needs and expectations of users.
Users who reported that dental care was offered in pri-vate room, who always or often received guidance on oral health and that the dentist recorded information in the medical reports reported greater satisfaction. The absence of privacy due to sharing the same dental office environ-ment can be a source of embarrassenviron-ment and feelings of dissatisfaction due to the breach of confidentiality, shame in showing one’s mouth to others or insecurity. This as-pect of quality is in line with the recommendation of the National Policy on Humanization in Brazil, which encour-ages the creation of healthy spaces that respect privacy and encourage the work process [27]. In this sense, there is a need for improvements in the structure of the primary care units and dental facilities. The guidance given to Table 4Factors associated with satisfaction with oral health services in multivariate logistics analysis(Continued)
Variables Crude OR (95%IC) Adjusted OR (95%IC)
Most of the time 3.12 (2.79–3.50) 2.19 (1.90–2.53)
Always 7.14 (6.44–7.92) 3.40 (2.98–3.88)
Dentist makes notes on dental records
No 1 1
Yes, sometimes 1.40 (1.19–1.64) 1.27 (1.04–1.54)
Yes, always 3.83 (3.39–4.32) 1.54 (1.32–1.80)
Bonding, accountability, and coordination of care
Query time enough
No 1 1
Yes, sometimes 3.15 (2.76–3.59) 2.09 (1.79–2.44)
Yes, always 12.33 (10.98–13.84) 4.81 (4.19–5.51)
Serviced by the same dentist
Never 1 1
Almost never 1.60 (1.31–1.94) 1.12 (0.87–1.45)
Most of the time 3.23 (2.69–3.87) 1.72 (1.36–2.18)
Always 5.20 (4.36–6.21) 2.24 (1.78–2.82)
Contacted when having missed appointment
No 1 1
Yes, sometimes 2.37 (2.13–2.64) 1.81 (1.59–2.05)
Yes, always 4.96 (4.58–5.37) 2.52 (2.30–2.76)
Never abandoned or missed 2.65 (2.52–2.78) 1.88 (1.77–2.00)
The bolded refect statistically significant findings
users represents a form of care and attention. The qualifi-cation of dialogue has the potential to strengthen ties as well as enhance the role of the user in the health professional-patient relationship. Access to information is a right and fosters empowerment and literacy in health [30], the importance of which is evidenced, as it encour-ages user involvement in the decision-making process [31, 32] and increases levels of satisfaction with oral health ser-vices [33]. A German study showed that better explana-tions regarding oral health care were associated with more satisfied users [9].
Similarly, users were more unsatisfied when they did not receive information on how to prevent oral prob-lems in a Brazilian study conducted in a medium-sized town [33]. The perception that the dentist records infor-mation from the session in the dental-medical records was associated with greater satisfaction. Health records encourage the coordination of care in a multidisciplinary perspective based on the patient-centered model [34] and are an indicator of the quality of care [35].
Regarding the bonding, accountability, and coordin-ation of care domains, positive assessments were asso-ciated with greater satisfaction with oral health service. A dose-response gradient was found for these three variables, with a greater chance of user satisfaction when the time allotted for the appointment was con-sidered “always sufficient”, when the patient was “ al-ways” treated by the same dentist and contact with the patient was“always” made when he/she missed a den-tal appointment. A Canadian study showed that a close professional-patient relationship based on the sharing of power favors a patient-centered rather than disease-centered approach and proposed an user-disease-centered dental care model. Meeting care expectations increases the satisfaction of both the patient and professional and reduces tension resulting from patient frustration. The proposed model enables a contextualization of the problem, the consolidation of ties and continual care [36]. In a study evaluating primary care at a govern-ment agency (Veterans Health Administration), higher levels of patient satisfaction were found when primary care attributes, such as the coordination of care and shared decision-making, were considered adequate [37].
The present national study in the field of health evalu-ation has strong points and limitevalu-ations. While a sample with a large number of participants ensures representative-ness, associations between variables tend to be significant. However, the residual analysis and the goodness-of-fit test revealed a suitable model. Although the questionnaires used for data collection in the PMAQ were validated by ex-perts, the evaluation of reliability was not performed. On the other hand, the organization of the program in cycles allows continuous improvement of the issues.
Conclusions
In this national study, user satisfaction with public oral health services was high and the attributes of the pri-mary care that received positive evaluations by users fa-vored satisfaction with the oral health service. The socioeconomically disadvantaged user was more satisfied with oral health services and the satisfaction increased with age. These results suggest that the unfavorable so-cial conditions can be associated with different user ex-pectations about oral health services which in turn could affect the satisfaction level and the evaluation of the quality of services.
Abbreviations
OR:Odds ratio; PMAQ-AB: National Program for Improving Access to and the
Quality of Primary Care
Acknowledgements
We are grateful for the support of the Universidade Federal de Minas Gerais.
Authors’contributions
Conceptualization, LPA, MIBS and RCF; Methodology, LPA, GPA, JSP and RCF;
Supervision, RCF; Writing–original draft, LPA; Writing–review & editing,
LPA, MIBS, GPA, LGR, JSP and RCF; All authors read and approved the final manuscript.
Funding
Raquel Conceição Ferreira received financial support from FAPEMIG, Brazil (Fundação de Amparo à Pesquisa do Estado de Minas Gerais - Programa
Pesquisador Mineiro - PPM-00686-16; Programa de Pesquisa para o SUS–
PPSUS - APQ-04112-17). This study is part of PhD thesis developed in Univer-sidade Federal de Minas Gerais (School of Dentistry). The authors would like
to thank“Pró-reitoria de Pesquisa da Universidade Federal de Minas Gerais”
for financially supporting the article-processing charge. This study was fi-nanced in part by the Coordenação de Aperfeiçoamento de Pessoal de Nível
Superior–Brasil (CAPES)–Finance Code 001.
Availability of data and materials
The datasets analyzed during the current study are available in the Portal of
the Department of Primary Care repository,http://dab.saude.gov.br/
portaldab/ape_pmaq.php?conteudo=2_ciclo[12].
Ethics approval and consent to participate
This study is based on a public database that does not have individual identification. It was approved by the local Research and Ethics Committee from the Federal University of Minas Gerais (CAEE no. 76981917.4.0000.5149).
Consent for publication
Not applicable.
Competing interests
The authors declare that they have no competing interests.
Author details
1School of Dentistry, Federal University of Minas Gerais, Belo Horizonte, Brazil. 2Department of Dental Clinic, Pathology and Surgery, School of Dentistry,
Universidade Federal de Minas Gerais, Belo Horizonte, Brazil.3Department of Epidemiology, Faculty of Public Health, University of São Paulo, São Paulo, Brazil.4School of Dentistry, Federal University of Minas Gerais, Belo Horizonte,
Brazil.5Department of Community and Preventive Dentistry, School of
Dentistry, Federal University of Minas Gerais, Belo Horizonte, Brazil.
Received: 1 February 2019 Accepted: 31 May 2019
References
1. Ministério da Saúde, Secretaria de Atenção à Saúde, Departamento de
189.28.128.100/dab/docs/publicacoes/geral/diretrizes_da_politica_nacional_ de_saude_bucal.pdf. Accessed 18 Jan 2019.
2. Junqueira SR, Pannuti CM, Rode SM. Oral health in Brazil - part I: public oral
health policies. Braz Oral Res. 2008;22(Suppl 1):8–17.
3. Ministério da Saúde. Informação e Gestão da Atenção Básica.https://
egestorab.saude.gov.br/paginas/acessoPublico/relatorios/ relHistoricoCoberturaSB.xhtml. Accessed 02 Dec 2018.
4. Ministério da Saúde, Secretaria de Atenção à Saúde, Departamento de
Atenção Básica. Saúde mais perto de você–Acesso e qualidade. Programa
Nacional de Melhoria do Acesso e da Qualidade da Atenção Básica (PMAQ): manual instrutivo 2° ciclo. Brasília: Ministério da Saúde; 2013.
5. Brasil. Ministério da Saúde. Aprova a Política Nacional de Atenção Básica,
estabelecendo a revisão de diretrizes para a organização da Atenção Básica, no âmbito do Sistema Único de Saúde (SUS). Portaria n. 2.436, de 21 de setembro de 2017. Brasília: Ministério da Saúde; 2017.
6. Donabedian A. The quality of care: how can it be assessed? JAMA. 1988;
260(12):1743–8.
7. Jensen RE, Rothrock NE, DeWitt EM, Spiegel B, Tucker CA, Crane HM, et al.
The role of technical advances in the adoption and integration of
patient-reported outcomes in clinical care. Med Care. 2015;53:153–9.
8. Gu D, Yang X, Li X, Liang C, Zhong J, Feng N. Innovating new rural
cooperative medical scheme (NCMS) for better patient satisfaction in rural China. Int J Environ Res Public Health. 2018;15(9):2007.
9. Goetz K, Szecsenyi J, Klingenberg A, Brodowski M, Wensing M, Campbell
SM. Evaluation of patient perspective on quality of oral health care in
Germany--an exploratory study. Int Dent J. 2013;63:317–23.
10. Meng R, Li J, Zhang Y, Yu Y, Luo Y, Liu X, et al. Evaluation of patient and
medical staff satisfaction regarding healthcare Services in Wuhan Public Hospitals. Int J Environ Res Public Health. 2018;15(4):769.
11. Arruda CAM, Bosi MLM. Satisfaction of primary health care users: a
qualitative study in Northeast Brazil. Interface (Botucatu). 2017;21:321–32.
12. Ministério da Saúde. Portal do Departamento da Atenção Básica.http://dab.saude.
gov.br/portaldab/ape_pmaq.php?conteudo=2_ciclo. Accessed 26 Jan 2019.
13. Swan JE, Sawyer JC, Van Matre JG, McGee GW. Deepening the
understanding of hospital patient satisfaction: fulfillment and equity effects.
J Health Care Mark. 1985;5:7–18.
14. Instituto Brasileiro de Geografia e Estatística. Portal do IBGE.https://www.
ibge.gov.br/estatisticas/sociais/populacao/9662-censo-demografico-2010. html?edicao=10503&t=destaques. Acessed 10 Apr 2019.
15. Hosmer DW Jr, Lemeshow S, Sturdivant RX. Applied logistic regression. 3rd
ed. Hoboken: Wiley; 2013.
16. Paul P, Pennell ML, Lemeshow S. Standardizing the power of the
Hosmer-Lemeshow goodness of fit test in large data sets. Stat Med. 2013;32:67–80.
17. Andrade MV, Chein F, Souza LR, Puig-Junoy J. Income transfer policies and
the impacts on the immunization of children: the Bolsa Familia program.
Cad Saude Publica. 2012;28:1347–58.
18. Alves H, Escorel S. Social exclusion and health inequity: a case study based
on a cash distribution program (Bolsa Família) in Brazil. Rev Panam Salud
Publica. 2013;34:429–36.
19. Rasella D, Aquino R, Santos AC, Paes-Souza R, Barreto ML. Effect of a
conditional cash transfer programme on childhood mortality: a nationwide
analysis of Brazilian municipalities. Lancet. 2013;382:57–64.
20. Macarevich A, Pilotto LM, Hilgert JB, Celeste RK. User satisfaction with public
and private dental services for different age groups in Brazil. Cad Saude
Publica. 2018;33:1–10.
21. Saeed AA, Mohammed BA, Magzoub ME, Al-Doghaither AH. Satisfaction
and correlates of patients' satisfaction with physicians' services in primary
health care centers. Saudi Med J. 2001;22:262–7.
22. Rahmqvist M, Bara AC. Patient characteristics and quality dimensions related
to patient satisfaction. Int J Qual Health Care. 2010;22:86–92.
23. Jaipaul CK, Rosenthal GE. Are older patients more satisfied with hospital
care than younger patients? J Gen Intern Med. 2003;18:23–30.
24. Cotta RMM. The user’s satisfaction of the family health program: evaluation
on health care. Sci Med. 2005;15:227–34.
25. Moimaz SAS, Burili MC, Bordin D, Garbin CAS, Saliba TA, Saliba NA.
Satisfação dos usuários segundo variáveis de organização dos serviços
públicos odontológicos. Arch Health Invest. 2017;6:14–9.
26. Colussi CF, Calvo MC. An evaluation model for oral health in primary care.
Cad Saude Publica. 2011;27:1731–45.
27. Ministério da Saúde, Secretaria de Atenção à Saúde, Departamento de
Atenção Básica. Humaniza SUS: Política Nacional de Humanização: PNH.
2013.http://bvsms.saude.gov.br/bvs/publicacoes/politica_nacional_
humanizacao_pnh_folheto.pdf. Accessed 26 Jan 2019.
28. Carnut L, Frazão MP, Neto JGM, Silva ALAS. Principais desafios do
acolhimento na prática da atenção à saúde bucal: subsídios iniciais para
uma crítica. Rev ABENO. 2017;17:46–64.
29. Moimaz SAS, Bordin D, Fedel CB, Santos CB, Garbin CAS, Saliba NA.
Qualification of care in oral health services. Cad Saude Colet. 2017;25:1–6.
30. Leite RAF, Brito ES, Silva LMC, Palha PF, Ventura CAA. Access to healthcare
information and comprehensive care: perceptions of users of a public
service. Interface (Botucatu). 2014;18:661–71.
31. Mills I, Frost J, Cooper C, Moles DR, Kay E. Patient-centered care in general
dental practice - a systematic review of the literature. BMC Oral Health. 2014;14:64.
32. Örsal Ö, Duru P, Tırpan K, ÇulhacıA. Analysis of the relationship among
health awareness and health literacy, patient satisfaction levels with primary care in patients admitting to primary care health centers. Patient Educ
Couns. 2018;18:30696–7.
33. Roberto LL, Martins AMEBL, Paula AMB, Ferreira EF, Haikal DS. Dissatisfaction
with the dental services and associated factors among adults. Cien Saude
Colet. 2017;22(5):1601–13.
34. Santos DC, Ferreira JBB. Family’s medical records in the perspective of the
health care coordination. Physis. 2012;22(3):1121–37.
35. Pereira ATS, Noronha J, Cordeiro H, Dain S, Pereira TR, Cunha FTS, et al. Use
of the family health record as a quality-of-care indicator in primary health
care units. Cad Saude Publica. 2008;24(suppl 1):123–33.
36. Apelian N, Vergnes J, Bedos C. Humanizing clinical dentistry through a
person-centered model. Int. J. Whole Person Care. 2014;1(2):30–50.
37. Nelson KM, Helfrich C, Sun H, Hebert PL, Liu CF, Dolan E, et al.
Implementation of the patient-centered medical home in the veterans health administration: associations with patient satisfaction, quality of care, staff burnout, and hospital and emergency department use. JAMA Intern
Med. 2014;174(8):1350–8.
Publisher’s Note