Improving the Coverage and Connectivity of
WSNS using Diagrammatic Node Clustering
Mr. Shravankumar M. Mamidwar Prof. P. R. Lakhe
Student Assistant Professor
Department of Electronics & Communication Engineering Department of Electronics & Communication Engineering Suresh Deshmukh college of Engineering, Selukate Wardha,
India
Suresh Deshmukh college of Engineering, Selukate Wardha, India
Abstract
WSN suffers from a lot of issues that includes energy conservation, scalability, latency, computational resources and communication capabilities. Energy efficiency is critical issue in Wireless Sensor Networks as nodes are equipped with limited power supply and nodes that bypass most of the traffic deplete their energy faster that leads to decreased network lifetime. Many sensor networks are deployed for the purpose of covering and monitoring a particular region, and detecting the object of interest in the region. In these applications, coverage is one of the centric problems in sensor networks. Such problem is centered on a basic question: “How well can the sensors observe the physical world?” The concept of coverage can be interpreted as a measure of quality of service provided by the sensing function in various ways depending on sensor devices and applications. On the other hand, sensor nodes are usually battery-powered and subject to limitations based on the available battery energy. It is, therefore, critical to design, deploy and operate a wireless sensor network in an energy-efficient manner, while satisfying the coverage requirement. Although many studies have exploited the mobility of sensors to improve the quality of coverage and connectivity, little attention has been paid to the minimization of sensors’ movement, which often consumes the majority of the limited energy of sensors and thus shortens the network lifetime significantly. In order to prolong the lifetime of a sensor network this paper addresses the challenges of the Mobile Sensor Deployment (MSD) problem and investigates how to deploy mobile sensors with minimum movement to form a WSN that provides both target coverage and network connectivity.
Keywords: Wireless Sensor Network, Target coverage, connectivity, mobile sensors, energy consumption
________________________________________________________________________________________________________
I. INTRODUCTION
WSN is a random or deterministic deployment of massive number of sensor nodes in a monitored area. WSNs have extensive applications, including military surveillance, target tracking, wild life monitoring, fire prevention, rescue operations, and air quality monitoring. The primary goal of sensor nodes is to sense and collect raw data by monitoring particular environment, target, and barrier, and report that event to some sink node after some local processing or aggregation. Target coverage and network life time are two of the recent research trends in WSNs. Deployment of a set of sensors to cover a particular area, targets, or barrier is called coverage problem. The main purpose of target coverage is to continuously monitor a set of targets by using a subset of sensors. These sensor nodes are subject to failures due to various reasons. One of the common reasons is battery failure. Other reasons may include radio interference, software or hardware faults, and environmental changes. Sensor node failures may affect the coverage and connectivity adversely which in turn degrades the sensor network performance with higher network delays and higher energy consumption. Sensor nodes are equipped with limited capacity batteries.
Fig. 1.1: Information flow in wireless sensor network [3]
A Wireless Sensor Network (WSN) is a collection of tiny sensor nodes which are interconnected by wireless communication channels. Each sensor node is a small device that can collect data from its surrounding area, carry out simple computations and communicate with other sensors or with the base station (BS).The nodes are deployed in a monitoring field as shown in the following Figure 1.1 and each of them capture data and sends data back to the base station or sink [3].
Data are routed back to the sink by following direct or multi-hop dedicated path. The base station may communicate with the task manager via Internet or satellite. The information flow in typical WSN is explained in Figure 1.1 [3]. Wireless Sensor Networks (WSN) consists of a huge number of sensors with energy resource limitation, dispersed in a region. The network nodes sense data from the region and send them to base station. Each node just knows about sensing region of its own. The overlap areas will have negative impact on the energy factor. It is because of the possibility of repeating messages [4].
As sensors are usually powered by energy limited batteries and thus severely power-constrained, energy consumption should be the top consideration in mobile sensor networks. Specially, movement of sensors should be minimized to prolong the network lifetime because sensor movement consumes much more energy than sensing and communication. However, most of the existing studies aimed at improving the quality of target coverage, e.g., detecting targets with high detection probability, lowering false alarm rate and detection delay. Little attention has been paid to minimizing sensor movement. To fill in this gap, this study focuses on moving sensors to cover discrete targets and form a connected network with minimum movement and energy consumption [1]
II. RELATED WORK
In these studies, mobile sensors move actively to improve the surveillance quality, but the optimization of sensor movement is not explicitly considered. Reactive mobility is exploited to improve the quality of target detection, but the movement of sensors is not considered as the primary optimization objective. In [7] mobile sensors are scheduled to replace failed static sensors in order to guarantee coverage ratio with minimum movement distance. But each sensor concerned in [7] can cover only one target and the maximum moving distance for each mobile sensor is limited. An optimal velocity schedule is proposed to minimize energy consumption in movement when the road condition is uniform.
Many research efforts have also been made to improve the area coverage with mobile sensors with the aim of maximizing the covered area. In [1] Voronoi diagrams are used to detect coverage holes. After that, sensors are dispatched to cover the detected holes. As a result, the area coverage ratio is improved. Further, a multiplicative weighted Voronoi diagram is used to discover the coverage holes corresponding to different sensors with different sensing ranges. However, Voronoi diagram to discover the coverage holes corresponding to different sensors with different sensing ranges. Voronoi diagrams in these studies are constructed according to the position of mobile sensors, and thus need to be recomputed after each round of sensor movement. Mobile sensors are used to improve energy efficiency of sensors in area coverage. In this work, when destinations have been determined, mobile sensors are designed to move along the shortest path to minimize the energy consumption. Given designated destinations, k-coverage is studied in [1]. In this work, a competition scheme is proposed to minimize energy consumption in movement. Recently, parameterized algorithms were exploited to find max- lifetime target coverage and min-power multicast paths in WSNs. In these studies, destinations of mobile sensors are given in advance, and the energy efficiency is considered in the path finding process.
Mobility of sensors could also be exploited to enhance network connectivity after the coverage stage is completed. In, a triangular deployment strategy is proposed to dispatch sensors to connect the network after deploying mobile routers to maximize the coverage area. In the proposed strategy, sensors move along the shortest path to the corresponding triangular vertices in order to save energy. The authors considered a hybrid network consisting of both static and mobile sensors. It first divides the static sensors into groups as large as possible, and then seeks the minimum number of mobile sensors to connect these static sensor groups. A sensor node relocation approach is proposed to maintain connectivity between a region of interest and a centre of interest outside the deployment region where a particular event happens.
Voronoi diagram of targets is adopted to find the nearest sensor, which avoids blind competition among mobile sensors. Besides, because our solution generates the Voronoi diagram according to the position of targets, it does not require re-computation of the Voronoi diagram as the targets are static. This contributes to the lower complexity of the proposed solution. (3) Destinations of mobile sensors are unknown, which should be computed by our algorithms. When mobile sensors move to these destinations, both target coverage and network connectivity are satisfied. (4) In order to investigate the impact of network parameters on the performance of our algorithms, analyses and evaluations are given according to the simulation experiment results, which provides a reference for practical engineering and theoretical basis for the design of mobile sensor networks.
III. METHODE OF APPROACHE
The Basic Algorithm
A simple heuristic to minimize the movement distance of sensors is to minimize the number of sensors that need to move. Actually, after the sensors are deployed, some targets may have already been covered. Denote the set of targets that have already been covered by Tinitcov, and denote the set of uncovered targets by Tneedcov. Then we have Tneedcov =T n /Tinticov. In order to minimize the number of mobile sensors that need to move, we first construct a graph of targets representing whether targets can be simultaneously covered, then find the destinations of mobile sensors by using clique partition. However, although the Basic algorithm minimizes the number of sensors to move, it may increase the total movement distance of sensors.
The graph is constructed as follows. For every target in Tneedcov, there is a vertex in the graph. There is an edge between two vertices if and only if the corresponding targets could be simultaneously covered by the same sensor. After the graph is constructed, we find a minimum clique partition of the constructed graph. Each partitioned clique represents a subset of targets that can be covered by the same sensor. Thus, for targets belonging the same clique, we need to dispatch only one mobile sensor to cover them. With this method, the number of mobile sensors that need to move is minimized. After the clique partition is obtained, the extended Hungarian algorithm is used to determine which sensor should be dispatched to cover the targets in each clique.
The Target-Based Voronoi Greedy Algorithm
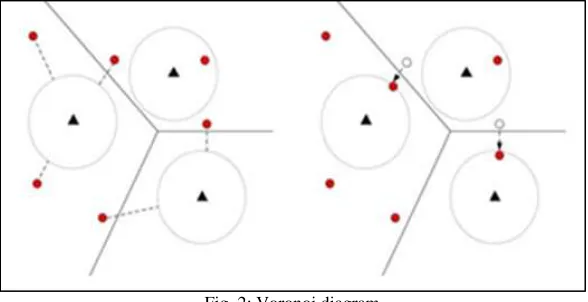
In [1] this section, we present a target based Voronoi greedy algorithm (TV-Greedy) to minimize the total movement distance of sensors to cover targets. The basic idea of TV-Greedy is to deploy the nearest sensor to cover the targets that are uncovered. Since sensors located in a target’s Voronoi polygon are closer to this target than to others, we use Voronoi diagrams of targets to group sensors according to their proximity to the corresponding target. First, the Voronoi diagram of targets is generated by using the coordinate information of targets which is known to sensors. Based on the vertices information of Voronoi polygons, the neighbors of each target are determined.
Second, the own server group OSG of each target is determined. In each OSG, the own servers (sensors in the OSG) is sorted by their distances to the client (the target of the OSG) in ascending order, according to which the chief server is identified as the first in the sorted list. For the rest own servers, we identify the aid server for each neighbor of the client via distance comparison and sorting, as shown in Fig.
Fig. 2: Voronoi diagram
Third, for each target, if it is covered initially, sensors in its OSG stand by and wait for orders. If the target is not covered initially, then its CSG will be formed, which is a logical server group merged with the chief server of the target and all the aid servers from its neighbors.
TV-Greedy starts from the generation of targets’ Voronoi diagrams, which divides sensors into independent groups for each target. With assistance of targets’ Voronoi diagrams, we can construct a sensor group for each target, which includes sensors in proximity to this target.
For the sake of clarity, the definitions and notations that will be used in the algorithm description is presented below:
1) If a sensor is located in a target’s Voronoi polygon, the sensor is defined as a server to this target, and the target is regarded as a client of its servers. The set of a target’s servers is called that target’s own server group (OSG). The sensor in a target’s OSG that is nearest to the target is called the chief server of that target, and other sensors are called non-chief servers of the target. 2) Two targets are neighbors if their Voronoi polygons share an edge. For two neighboring targets A and B, the sensor in A’s
OSG that is closest to B is called an aid server to B.
3) A target’s candidate server group (CSG) is the union of its own chief server and aid servers from neighbors. For a target, only sensors in its CSG will be dispatched to cover it.
Delaunay Triangulation
In this section, we present the Delaunay algorithm which is used to place the nodes in proper locations. Delaunay algorithm based on the principle of attraction and repulsion.
1) Attraction: - Attraction of the nodes occurs when the nodes are out of their sensing range to one another. 2) Repulsion: - repulsion of the nodes occurs when the nodes are too close to their sensing range to each other.
By using this Delaunay algorithm by combining with voronoi we can place the nodes in proper places so that the movement of the node is minimize. As the Delaunay works on the principle attraction and repulsion the overlapping of the sensing range of the two nodes is avoided and in this way the movement of the nodes is minimized. The maximum amount of energy which is wasted on the movement of nodes is saved by minimizing the movement by using Delaunay algorithm.
IV. RESULTS OBTAINED BY COMBINING DELAUNAY WITH VORONOI
Table - 1
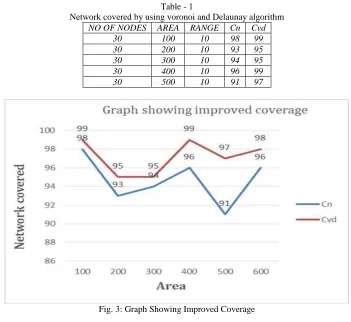
Network covered by using voronoi and Delaunay algorithm NO OF NODES AREA RANGE Cn Cvd
30 100 10 98 99
30 200 10 93 95
30 300 10 94 95
30 400 10 96 99
30 500 10 91 97
Fig. 3: Graph Showing Improved Coverage Table – 2
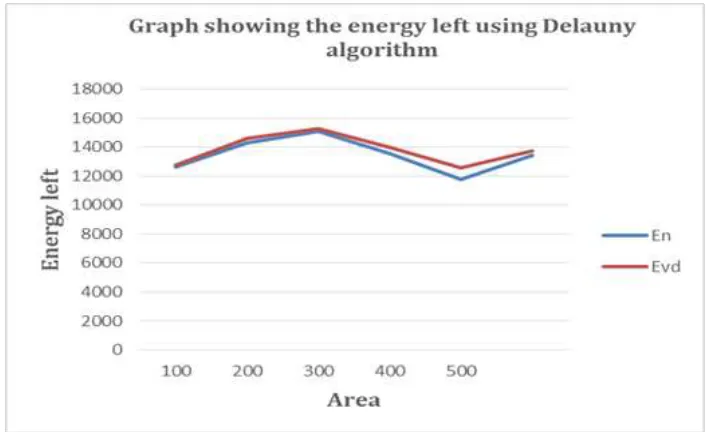
Energy left after using Delaunay with voronoi algorithm NO OF NODES AREA RANGE En Evd
Fig. 4: Graph Showing the energy left using Delauny Algorithm
Where,
Cn- Coverage obtain normally
Cvd- Coverage obtained using voronoi with Delaunay algorithm En- Energy left normally
Evd- Energy left using voronoi with Delaunay algorithm
The table no. 1 and graph shows the comparison between coverage obtained normally and coverage obtained using voronoi with Delaunay algorithm. The graph shows that there is improvement in coverage after using the voronoi with Delaunay algorithm. After using only voronoi algorithm the area is divided into number of parts but the sensors are also sensing or detecting the targets which are not in their area means the targets situated in the neighboring area is also sensed or detected as shown in fig. 3.2.1. The energy is wasted in detecting the neighboring targets so now we have to again minimize the movement of the nodes so that the sensor nodes sense the targets which are only in their area. For this purpose we are using the Delaunay triangulation method which place the nodes into proper places so that the movement of the nodes range is up to the boundaries of the region.
Table no.2 and graph shows the comparison between energy left normally and energy left using voronoi with Delaunay algorithm. By using the Delaunay algorithm maximum amount of energy is left.in this way we can minimize the movement and save the energy which is wasted in the movement of nodes and also increase the lifetime of the network.
V. CONCLUSION
Implemented work will minimize the energy needed for movement of nodes, improve coverage area and lifetime of the network is increased. The concept of Voronoi diagrams to divide the entire network into regions of varying nodes. So a node will only have the responsibility to improve the coverage of the area in which Voronoi diagram has placed it. Thus the node movement is restricted. So the energy needed for movement will be reduced and the coverage area will be improved. This will allow the network to retain energy for a longer time duration.
REFERENCES
[1] Zhuofan Liao, Jianxin Wang, Shigeng Zhang, Jiannong Cao and Geyong Min, “Minimizing Movement for Target Coverage and Network Connectivity in Mobile Sensor Networks”, IEEE Transactions On Parallel And Distributed Systems, Vol. 26, No. 7, July 2015.
[2] M. D. Umale, S. S. Awate, V. N. Gavali, “Energy Efficient Techniques in WSN”, International Research Journal of Engineering and Technology (IRJET), Volume: 02 Issue: 03, June-2015.
[3] Ajit Singh Negi, Neha Garg, Akhand Pratap Singh, “Role of Clustering in Achieving Energy Efficient Coverage in Wireless Sensor Network: A Short Review,” International Research Journal of Engineering and Technology (IRJET), Volume: 02 Issue: 02, May-2015.
[4] J. Shanbehzadeh, M. Mehrani, A. Sarrafzadeh, and Z. Razaghi, “An Energy Efficient Coverage Method for Clustered Wireless Sensor Networks”, Proceedings Of The International Multiconference Of Engineers Of Computer Scientists, Volume 02,IMECS, March-2010.
[5] Bo Jiang, Binoy Ravindran and Hyeonjoong Cho, “Probability-Based Prediction and Sleep Scheduling for Energy-Efficient Target Tracking in Sensor Networks”, IEEE Transactions On Mobile Computing, Vol. 12, NO. 4, April 2013.
[6] Prof. Sachin Deshpande, Prof. Umesh Kulkarni and Mritunjaykumar Ojha, “Target Tracking In Wireless Sensor Network” , International Journal of Emerging Technology and Advanced Engineering,Volume 3, Issue 9, September 2013.
[8] Mostafa Borouomand zadeh, Sayed Mohsen Hashemi and Mitra Mohmedi karbalaii, “Target Tracking Techniques for Wireless Sensor Networks”, International Research Journal of Applied and Basic Sciences © 2013, Vol, 5 (7): 820-823 Science Explorer Publications.
[9] Zaixin Lu, Wei Wayne Li and Miao Pan, “Maximum Lifetime Scheduling for Target Coverage and Data Collection in Wireless Sensor Networks”, IEEE Transactions On Vehicular Technology, Vol. 64, No. 2, February 2015.
[10] Fatme El-Moukaddem, Eric Torng, and Guoliang Xing,“Maximizing Network Topology Lifetime Using Mobile Node Rotation”, IEEE Transactions On Parallel And Distributed Systems, Vol. 26, No. 7, July 2015.
[11] Tarini Mishra, Alok Ranjan Panda, Manas Ranjan Lenka, Debabrata Mahapatra and Amulya Ratna Swain,“Energy Efficient Coverage and Connectivity with Varying Energy Level in WSN”,International Conference on Computational Intelligence & Networks, 2015 IEEE DOI 10.1109.
[12] Juha Petäjäjärvi, Konstantin Mikhaylov, Heikki Karvonen, Risto Vuohtoniemi and Matti Hämäläinen,“Loose Synchronization Method for Low-power Superregenerative Wake-up Receiver”,9th international symposium on medical information and communication technology(ISMICT),978-1-4799-8072-7/15 2015 IEEE.
![Fig. 1.1: Information flow in wireless sensor network [3]](https://thumb-us.123doks.com/thumbv2/123dok_us/7803197.1660873/2.612.174.439.50.209/fig-information-flow-wireless-sensor-network.webp)