Page 381 www.ijiras.com | Email: [email protected]
The Moderating Effect Of Decision-Maker On The Relationship
Between Strategy And Organizational Structure
Levius Koyio Matseshe
Faculty of Commerce, The Catholic University of Easter Africa, Nairobi, Kenya
Robert. Arasa
Tecle H. Yohannes
Faculty of Commerce, The Catholic University of Easter Africa, Nairobi-Kenya
I. INTRODUCTION
Studies in organization design have been ongoing in the field of management for many decades. All this while, there has been very little change in the structural contingency theory underpinning these studies (Burton & Obel, 2004). The interest in these studies is sustained by the significant contribution that organization structures make to organizational performance. The organization structure influences amongst other functions how power, roles and responsibilities are distributed, controlled, goals are achieved and how information flows throughout the organization. Thus, an appropriate organization structure is that which facilitates while an inappropriate one imbeds the attainment of the desired results (Robbin & DeCenzo, 2005). Since strategic
planning involves determination of goals and objectives, it is easy to perceive why organization structure is often conceived after the strategy has been selected and the motivation behind sustained studies in strategy-structure relationship.
The role of the decision-maker in the process of structuring organizations has been presumed by the proponents of the structural-contingency framework. Contingency variables such as strategy are all the important determinants of organization structure (Oliveira & Takahasi, 2012; Greenberg, 2011; Cole, 2004; Donaldson, 2001). Thus, the structural contingency framework assumes that the organization structure directly and logically responds to the demands of the strategy as one of the contingency factors thereby failing to take into account the role of the decision makers. But factors do not by themselves choose organization Abstract: The purpose of this study was to establish the influence of the decision maker on the relationship between strategy and organization structure. The study was informed by the apparent dearth of empirical evidence about the said relationships. Whereas the relationship between strategy and structure is rich in empirical data, the role of the decision-maker in the process of structuring organizations has largely been underscored in theory that the process is neither necessarily logical nor objective. The main objective of the study was to establish the influence of the decision-maker on the relationship between strategy and organizational structure. The study was based on the cross-sectional survey targeting all manufacturing firms in Nairobi and its surrounding. Data was initially analysed by exploratory and confirmatory factor analysis tests, however, the final analysis was done using structural equation modelling. The findings established significant influence of strategy on organization structure. Further, the findings provided evidence that the decision maker has significant moderating effect on the relationship between strategy and organization structure in the manufacturing firms in Kenya. The study has thus yielded a high empirical validity for its theoretical model that was to establish; the moderating effect of the decision-maker in the relationship between strategy and organization structures. Accordingly, the assumption held within the structure-contingency model that the linkage between strategy and structure is logical and direct is no longer tenable.
Page 382 www.ijiras.com | Email: [email protected] structures, people do. The strategic choice approach which
argues that the process of structuring an organization is fundamentally a political one which is why decision makers play an important role. Since most major corporate decisions involve multiple decision makers, Child (1997; Child et al., 2003) discusses them in plural as those who have the power to direct organizations. The argument goes that it is the perceptions and preferences of decision-makers that eventually influence the choice of organization structure having considered the interplay amongst the contingency factors. Indeed this is what strategic choice is about, selection. Those who have the power to direct organizations are largely defined as either; a leading coalition group within an organization, executive manager or owners with executive authority. Such decision-makers are not homogeneous in their outlook and capability. It is the intervention of the decision-makers between contingency factors and the resultant structures that explain the existence of different organization structures even though the contingency factors may be the same, a reality contingency framework can hardly explain.
Since structure is subject to the decision-makers’ choice, some researchers and theorists have argued that structure results from a decision problem (Powell, 2008; Child et al., 2003). Choice is hardly objective for it is a result of perceptions and preferences be they managerial or otherwise. Decision-makers’ perceptions and preferences are nurtured by their (i) cognitive orientation, (ii) bounded rationality, and (iii) motivational orientation, (Currie, 2012; Mackinnon & Powell, 2008; Beach & Connoly, 2005; Bubnicki, 2003). Bounded rationality holds that the ability of decision makers to perceive the totality of their situation is limited by their worldview. Cognitive orientation relates to the information processing ability of the decision maker. It holds that decision-makers with different information processing ability may have different perceptions of the same objective phenomena. Motivation orientation refers to system of values and evaluation in the process of individual or group choice. For example, choices may be made on the basis of personal criteria or organizational criteria. When applied to the organization structure, the decision-maker may choose a structure guided by personal criteria, organizational criteria or a concession of both which is why it may explain variances that exist in organization structures. Through their wish to adhere to industry success factors decision makers often comply in spite of their reading of contingency factors. As a result, the firms in an industry tend to configure look-a-like structures. Ultimately the emergence of new thinking demands of managers to authenticate their interpretation of the contingency factors (Childe et al., 2003).
Strategy is variously defined by different authors but there is unanimity on what the essentials are. Cooper & Schinder (2006) define it simply as the general approach that an organization follows to achieve its goals. Pearce and Robinson (2012) consider strategy as the determination of the long-term goals and objectives of an organization and adoption of courses of action and the allocation of resources necessary for carrying out these goals. An organization structure is part of the organizing function that creates the mechanism that coordinates activities for the achievement of the planned goals and objectives. It is logical that such a mechanism is created
after the goals and objectives are known. This could be why the classic works by Chandler (1962, 2003) contending that structure follows strategy generated a lot of interest resulting in numerous research studies around the world, Robbins (2004). Many of such studies augmented Chandler’s proposition (Hall & Tolbert, 2009; Miles et al., 2011). Many writers argue that organizational structure has to change based on the strategies that are being pursued.
Although a lot of emphasis is given to strategy as one of the key determinants of structure, it is difficult to provide practical advice based on this understanding given the pace of change that is characteristic of modern times (Achaoucaou et al., 2009). It is this challenge that has sustained interest in the research strategy’s influence on organization structure. The present study addressed this issue by examining the position of the decision-maker in the process of determining the organization structure.
OBJECTIVE OF THE STUDY
The main objective of the study is to establish the influence of the decision maker on the relationship between strategy and organizational structure
II. LITERATURE REVIEW
The study was guided by structure-contingency framework and strategic choice approach. The determination of organization structure based on structural contingency theory rests on two fundamental premises namely that; (i) there is no optimal organizational form for all situations, and (ii) the alignment between organizational design and strategy leads to the most appropriate organization structure. On the other hand, the rationale behind the strategic choice approach is that factors do not choose but people do which is the process of choice can hardly be objective. Choices of strategy and structure by leadership of organizations are often laced with interests.
Page 383 www.ijiras.com | Email: [email protected] product and market range. Formalization refers to the extent
to which jobs are standardized and employees exercise discretion on how to perform their jobs and conduct themselves. It is the degree of how rules, policies and procedures regulate the people’s behaviour in the organization. Centralization refers to the degree to which authority and decision-making is concentrated at the top (Quangyen & Yezhuang, 2013; Ugbomhe, et al., 2011; Stoner, et al., 2004). These dimensions need to blend for the organization to work as effectively as possible. A combination of these dimensions would produce a web of relationships that make up organization structural classifications that range from a continuum of mechanistic to organic structures (Lunenburg, 2012; Cole, 2004). A mechanistic structure is highly formal, relies on authority and a well-defined hierarchy to facilitate coordination. Its essence is to maximise efficiency and production. The organic structure on the other end is low on complexity and formalization and enhances participation in decision-making (Greenberg, 2011).
B. THE STRUCTURAL CONTINGENCY THEORY
Structural contingency theory holds that there is no one best organization structure or structural type that is best for all organizations. Instead, the structure that is most effective is the one that fits certain factors, called contingencies. These factors are to be found within (internal) and without (external) organization (Forte et al., 2000; Pettigrew et al., 2000; Donaldson, 2001; Meilich, 2006). A variety of contingency factors can explain variations in the forms of organization structures. The most prevalent set of internal factors to be found in the literature is strategy (Chandler 1962, 2003; Robbins, 2004; Cooper & Schindler, 2006). It is argued that strategy demands a structure that facilitates its implementation. Thus, depending on which strategy that is chosen then only particular forms of organizational structure that bear specific set of features would be selected. Thus, the effectiveness of an organization structure depends on the extent to which it fits the strategy. The structural contingency theory which is the basis of this reasoning has triggered a series of studies over the years. The works of Burns and Stalker (1961), Child (1972), Chandler (1966), Mintzberg (1984), Lorsch (1977) and more recently Hollenbeck (2000), Nasrallah et al. (2009), Quangyen and Yezhuang (2013), Kariuki (2015) emphasize the need to study the influence of contingencies on organization structures. That as it may, structural contingency theory does not explain the process of selection.
C. STRATEGIC CHOICE APPROACH
Strategic choice approach borrows from social action approach within sociology and strategic management theory to advance the argument that leadership action can impact upon organizations and its performance (Child et al., 2003). An established notion in strategic management is that managers cope with changes in their firm’s external environment through the choice of strategies and corresponding structures. The range of actions available to organization leadership is broad. For instance, there is an array of strategies and
structural typologies that leadership can select from. Proponents of strategic choice take the view that organization structure is a function of managerial choice. They argue that decision makers come between the contingency factors and structure. Rather than treat structural differences as the result of a clear contingency factor influence, such differences have to be viewed as the outcome of a process related to those with the power to structure organizations. The key strategic decision makers in organizations have been found to be mostly executive managers and/or owners (Child et al., 2003; Child 1997).
D. EMPIRICAL REVIEW
Several studies have found that the co-alignment between strategy, structure and environment is a necessary condition for firm performance (Chathoth, 2002; Chiyoge, 2009; Krishna & Shubhabrata, 2015). A study on effects of organization structure on strategy implementation of manufacturing firms in Nakuru, Kenya found strong correlation of division of tasks and formalization on strategy implementation (Karani, 2013). Thus, strategy-structure match is an important relationship. When a company diversifies, there is a decline in the performance if a suitable structure is not adopted. Such decline in performance forces the management to adopt an appropriate structure suitable to its strategy. Performance is enhanced when a match is finally restored between strategy and structure. This is a common understanding amongst researchers.
The underlying issue here is that strategy plays a major role in determining organizational form or structure, and that this interaction has greatly influenced configuration literature. Even greater is the realization that although strategy is the driving force, it is the interaction of strategy and structure - fit or configuration-that often truly makes the difference (Burton & Obel, 2004). Karani (2013) found that divisions of tasks and level of formalization, which, are some of the dimensions of organization structure significantly, affected how strategy is implemented.
On the other hand, some studies have shown that the aspects of organization structure that impact control function such as the degree of centralization, standardization and differentiation are the most influenced by the decision makers (Hollenbeck, 2002; Jabnoun, 2005; Auh & Mengue, 2007). There is also an observation that centralization is one of the most broadly studied aspects of organization structure (Hollenbeck, 2000). Decision-maker’s choice tends to be important because this is the aspect of a vertical structure that affect the extent to which decision making authority and responsibility for coordination resides at the top of the organization as opposed to being distributed throughout the lower levels.
Page 384 www.ijiras.com | Email: [email protected] be relatively more risk averse preferred mechanistic structures.
This finding resonates with what other studies found (Hongyan et al., 2015; Delios et al., 2008; Douma et al., 2006).
Other studies, though not purely focused on organization structure confirm that ownership type influence overall strategic decisions and therefore organizational performance. For incidence, it is typically believed that private owned firms are more well-organized than state owned firms, while mixed owned firms fall in the between (Shaomi & Jun, 2008; Douma et al., 2006). It has also been established by some authors that sometimes mixed owned firms perform better than a unitary owned firm where market imperfection is significant (Zhixiang & Kim, 2013; Sing, 2009).
Evidently, strategy and structure relationships have been extensively researched and written about. Not so, the process of how nor who takes the decision of how strategy should influence structure. The assumption is typically made that a type of organization structure is more favourable for a given strategy to achieve alignment. This study sort to test the veracity of this assumption.
III. METHOD
This study adopted a cross-sectional survey research design because it facilitated the collection of data from many different firms in a variety of industries but in one sector at one point in time (Kerlinger, 2007). The population of the study consisted of all manufacturing firms in Nairobi and its surrounding, which are members of Kenya Association of Manufactures. The choice of the manufacturing sector was informed by the evidence from the past studies that; (i) the manufacturing sector is sensitive to contingency factors and, (ii) significant number of past studies on environment, strategy and structure were mostly based on the manufacturing firms (Zsolt, 2012; Quangyen & Yezhuang, 2013; Busienei et al., 2013; Karani, 2013; Kariuki, 2015; Chindia & Pokhariyal, 2015). There are a total of five hundred and nine (509) of such firms in thirteen industries according to the Kenya Association of Manufacturers (2015). The entire population of five hundred and nine (509) manufacturing firms were involved because the population of the study was fairly small and assurance was needed to obtain adequate number of responses required for the structural equation modelling (SEM) analysis. Structural equation modelling requires a large sample (Kline, 2011).
A. SAMPLE SIZE
According to Zikmund et al., (2010), a sample size should be sufficiently large as to allow high statistical efficiency of the method of analysis adopted for the study. For this study a rule of thumb concerning the ratio of sample size to model parameters developed by Jackson (2003) was used to determine the sample size. This rule is applicable when the estimation method is maximum likelihood. In maximum likelihood estimation, Jackson (2003) suggested that researchers think about minimum sample size in terms of the ratio of cases (N) to the number of model parameters that
require statistical estimates (q). An ideal sample size-to-parameters ratio would be 20:1. Less ideal would be an N: q ratio of 10:1. As the N: q ratio decreases below 10:1 (e.g. 5:1), so does the trustworthiness of the results.
The model parameters for this study were 34 (14+14+3+2+1) while the response rate was 78.4% of the manufacturing firms (509). Thus, the sample size for this study was 399 manufacturing firms. The ration of sample size to model parameters ratio was 11.7:1. Hence, this sample size was adequate for structural equation modelling analysis. B. RELIABILITY AND VALIDITY
Since the research instruments of this study was a likert scale, this study applied Cronbach-Alpha to test the reliability of the research instruments. The Cronbach-Alpha coefficients of greater than 70% indicated that the research instruments used were reliable (Kline, 2011). The results in table 4.3 shows that the research instrument had significant reliability.
The validity of this study was measured using convergent and discriminant validity. The convergent validity was tested using lambda (factor loading), t-ratio, p-value, square multiple corrections, communalities, average variance extraction, and composite reliability. The results in tables 4.6 and 4.7 revealed that convergent validity was established. Furthermore, discriminant validity was tested using correlations between the constructs, factor correlation matrix and comparison between correlations square (r2) and average variance extraction. The results in table 4.6 indicates that discriminant validity was also established.
C. DATA ANALYSIS PROCEDURE
The data was initially analysed using exploratory and confirmatory factor analyses. Thereafter, data analysis was done using SEM. SEM analysis was deemed the best analyses that would address the research objective under the study because the concepts were measured by more than one manifest variables (Kline, 2011). Hence, this study applied SEM and the equations that addressed the research objective were:
Ƞi(m×1) = Γ(m×n)ᶓi(n×1) + Ϛ………..………..….1 Yi(p×1) = Λy(p×m)ƞi(m×1) + Єi(p×1) ………...……….2 X(q×1) = Λx(q×n)ᶓi(n×1) + ᵹi(q×1) ………...………...3
D. VARIABLES
Page 385 www.ijiras.com | Email: [email protected] (Quangyen & Yezhuang, 2013; Greenberg, 2012; Ugbomhe,
2011).
IV. RESULTS A. RESPONSE RATE
The questionnaire was administered to each of the five hundred and nine (509) manufacturing firms in Kenya situated within Nairobi and its surroundings. Out of these, three hundred and ninety nine (399) questionnaires were returned which makes up to 78.4% response rate. The data was collected from the chief executive officers, managing directors, chairmen of the boards, and general managers. According to Jackson (2003) SEM’s sample size formula (N: q which is 399/34 = 11.7:1), the sample size was adequate to analyse the data using SEM. Furthermore, the Kaiser-Meyer-Olkin Measure of sampling adequacy in table 4.3 is 0.858, which is greater than the threshold (50%). Therefore, the response rate of 78.4% was adequate for SEM.
B. PRELIMINARY ANALYSIS
Prior to application of SEM analysis, the data was subjected to diagnostic analysis to ascertain the appropriateness of its underlying parametric characteristics for this statistical application. This entailed the parametric tests of normality, exploratory factor analysis, and confirmatory factor analysis.
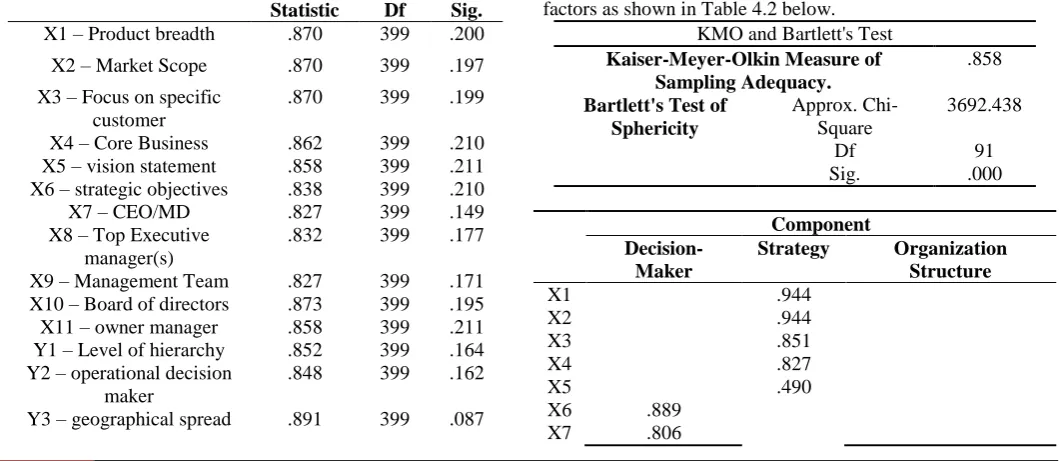
The study carried out normality test to ensure that the data was normally distributed to assure valid research outcome. This is applied when the estimation method is maximum likelihood method as it was applied in this study. The normality test of this study was carried out objectively using Shapiro-Wilk test as presented in table 4.1. On the basis of this test, all of the P-values in table 4.1 are greater than 0.092. Therefore, on the basis of this test, the data was normally distributed because the P-values of the manifest variables were above the threshold, which is 0.05.
Variables Shapiro-Wilk
Statistic Df Sig. X1 – Product breadth .870 399 .200
X2 – Market Scope .870 399 .197
X3 – Focus on specific customer
.870 399 .199
X4 – Core Business .862 399 .210 X5 – vision statement .858 399 .211 X6 – strategic objectives .838 399 .210
X7 – CEO/MD .827 399 .149
X8 – Top Executive manager(s)
.832 399 .177
X9 – Management Team .827 399 .171 X10 – Board of directors .873 399 .195
X11 – owner manager .858 399 .211
Y1 – Level of hierarchy .852 399 .164 Y2 – operational decision
maker
.848 399 .162
Y3 – geographical spread .891 399 .087
Y4 – Written rules .854 399 .132 Y5 – ways of
communication
.949 399 .092
Table 4.1: Normality test
Further to normality test, exploratory factor analysis is required to test which manifest variable load to which construct and to assess the number of constructs the study should handle. In addition, it helps to evaluate convergent and discriminant validities. The analysis was statistically carried out using exploratory factor analysis (EFA) and the findings are statistically discussed below.
a. EXPLORATORY FACTOR ANALYSIS
The exploratory factor analysis test was to screen the data to establish its suitability for SEM. This was done using the Kaiser-Meyer-Olkin (KMO) measure of sampling adequacy (MSA), item correlations and partial correlations were used to assess the adequacy of the data for factor analysis. The overall measure of sample adequacy (MSA) exceeded the 0.50 criterion (MSA = 0. 858), items’ partial correlations were low (< 0.30) and the item correlations was not zero (Determinant = 8.016E-005). Determinant greater than zero implies that the assumptions of positive definiteness are not violated. Bartlett’s test of sphericity was significant (Chi-Square = 3692.438, df = 91, p < 0.000) indicating existence of significant non-zero correlations among the measurement items. These results provided support that the data was appropriate for factor analysis.
To extract the factors we used principal component analysis and promax oblique rotation method. This choice was found suitable since the underlying factors were suspected to be non-orthogonal and the factors were to be used in subsequent analysis of structural relationships. The unconstrained initial solution resulted in four factors explaining 63.23% of the item variance. The items were found to have good communalities (> 0.535), however, two items were cross-loaded. The factor model was re-specified by iteratively trimming off the problematic items. The re-specified model extracted three factors explaining 70.846% of the item variance and the items loaded cleanly onto their prior factors as shown in Table 4.2 below.
KMO and Bartlett's Test Kaiser-Meyer-Olkin Measure of
Sampling Adequacy.
.858 Bartlett's Test of
Sphericity
Approx. Chi-Square
3692.438
Df 91
Sig. .000
Component
Decision-Maker
Strategy Organization Structure
X1 .944
X2 .944
X3 .851
X4 .827
X5 .490
X6 .889
Page 386 www.ijiras.com | Email: [email protected]
X8 .806
X9 .868
X1 0
.884
Y1 .733
Y2 .692
Y3 .909
Y4 .846
Extraction Method: Principal Component Analysis. Rotation Method: Promax with Kaiser Normalization.
a. Rotation converged in 5 iterations.
Table 4.2: KMO, Bartlett, and Pattern Matrix test
To assess the degree of internal consistency of the manifest variables, Cronbach’s alpha coefficient was used. As seen in table 4.3 the alpha coefficients exceeded 0.70. Hence, the reliability of this findings indicated that there was good internal consistency. Therefore, the research instrument had good reliability.
Variables Cronbach’s Test Results
Strategy 0. 899
Decision Maker 0. 878
Organization Structure 0. 797
Table 4.3: Reliability Test
Once the above data screening tests were satisfactorily carried out, data was subjected to measurement model test using confirmatory factor analysis. The results are presented and scientifically discussed below.
b. CONFIRMATORY FACTOR ANALYSIS
Confirmatory factor analysis starts by testing whether the data fit a hypothesized measurement model or not. Thereafter, this tool helps to identify which manifest variables should be retained and which ones to be removed from further SEM analysis using unidimensionality. Two manifest variables (X11 - owner manager and Y5 – ways of communication) were removed from further analysis because they did not represent the constructs (decision-making and organizational structure respectively) significantly. Then, the measurement model fit was tested and the results in table 4.4 revealed that the adjusted chi-square confirmed that the data fits the measurement model because CMIN/DF is between 2 and 5. Likewise, the values of normal fit index (NFI), relative fit index (RFI), incremental fit index (IFI), Tuck Lewis (TLI) and comparative fit index (CFI) are greater than threshold, which is 0.90. The value of Root Mean Square Error of Approximation (RMSEA) is less than the threshold, 0.50. Therefore, the data fitted well to measurement model.
Model NPAR CMIN DF P CMIN/DF
Default model 45 352.388 74 .000 4.762 Saturated model 119 .000 0
Independence model 14 3763.462 105 .000 35.842
Model NFI
Delta1
RFI rho1
IFI Delta2
TLI rho2
CFI
Default model .947 .923 .974 .956 .988
Saturated model 1.000 1.000 1.000
Independence model .000 .000 .000 .000 .000
Model RMSEA LO 90 HI 90 PCLOSE
Default model .023 .121 .140 .000
Independence model .296 .288 .304 .000
Table 4.4: Measurement Model Fit
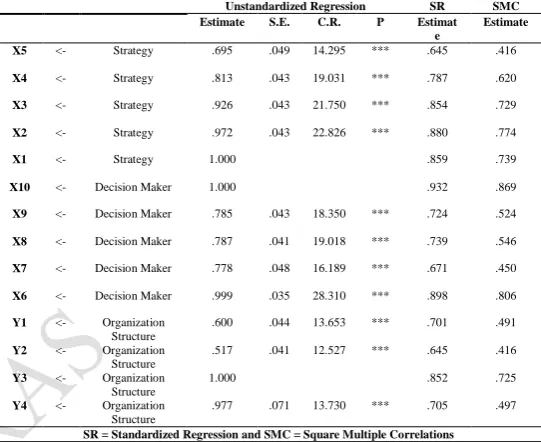
Furthermore, square multiple correlations were analysed to assess the extent to which the dependent variable is explained by the independent variables after X11 (owner
manager) and Y5 (ways of communication) were removed. The threshold for the square multiple correlation is 20%. This further helps to identify which manifest variables should be retained for further analysis and which have to be removed. Table 4.5 showed that all the manifest variables are statistically significant.
Table 4.5 demonstrated that the factor loadings are greater than 0.50, which implies that the manifest variables are significant indicators of the constructs. However, the study requires further investigation for discriminant validity and convergent validity to proceed to structural model fit test in order to address the research objectives correctly.
Unstandardized Regression SR SMC Estimate S.E. C.R. P Estimat
e
Estimate
X5 <- Strategy .695 .049 14.295 *** .645 .416 X4 <- Strategy .813 .043 19.031 *** .787 .620 X3 <- Strategy .926 .043 21.750 *** .854 .729 X2 <- Strategy .972 .043 22.826 *** .880 .774
X1 <- Strategy 1.000 .859 .739
X10 <- Decision Maker 1.000 .932 .869
X9 <- Decision Maker .785 .043 18.350 *** .724 .524 X8 <- Decision Maker .787 .041 19.018 *** .739 .546 X7 <- Decision Maker .778 .048 16.189 *** .671 .450 X6 <- Decision Maker .999 .035 28.310 *** .898 .806 Y1 <- Organization
Structure
.600 .044 13.653 *** .701 .491 Y2 <- Organization
Structure
.517 .041 12.527 *** .645 .416 Y3 <- Organization
Structure
1.000 .852 .725
Y4 <- Organization Structure
.977 .071 13.730 *** .705 .497
SR = Standardized Regression and SMC = Square Multiple Correlations
Table 4.5: Regression Weights and SMC for the Measurement Model
Based on CFA and EFA tests, discriminant validity of this study was established as showed in table 4.6 because the correlations between the contracts are less than 0.60. Besides, the correlations square are less than the average variance extraction. This implies that the three constructs of this study are measuring different things. Hence discriminant validity of this study is well established.
Correlations
CFA EFA
r2
AVEi AVEj
Discrimi nant Validity Estimate (r) Estim
ate Strategy <--> Decision
Maker
.585 .574 0.342 0.655 0.639 Established Organizat
ion Structure
<--> Strategy .186 .197 0.035 0.533 0.655 Established
Organizat ion Structure
<--> Decision Maker
.336 .310 0.113 0.533 0.639 Established
CFA = Confirmatory factor analysis. EFA = Exploratory factor analysis, and AVA = Average variance extraction
Table 4.6: Discriminant Validity Test Based on EFA and CFA Correlations
Page 387 www.ijiras.com | Email: [email protected] Strategy
Decision-Maker Organizational Structure Average Variance Extraction
0.655398 0.639113 0.532589
Composite Reliability
0.943234 0.938147 0.884822 Convergent
Validity
Established Established Established
Table 4.7: Convergent validity test
Since all the above analyses provided satisfactory results, the data was subjected to structural equation modelling test to address the research objectives. However, the procedure required for valid results to be obtained is that the data has to be subjected to structural equation model fit test before estimating the regression weights between latent exogenous and endogenous variables.
C. STRUCTURAL MODEL TEST
The structural model fit was tested by adjusted chi-square, relative fit index (RFI), normal fit index (NFI), incremental fit index (IFI), Tucker Lewis index (TLI), comparative factor index (CFI) and Root Mean Square Error of Approximation (RMSEA). The recommended threshold is the same as stated above in the confirmatory factor analysis. The results in table 4.8 indicated that the data fitted with the structural equation modelling.
Model NPAR CMIN DF P CMIN/DF
Default model 45 352.388 74 .000 4.762
Saturated
model 119 .000 0
Independence
model 14 3763.462 105 .000 35.842
Model NFI Delta1 RFI rho1 IFI Delta2 TLI rho2 CFI
Default model .947 .923 .974 .956 .988
Saturated
model 1.000 1.000 1.000
Independence
model .000 .000 .000 .000 .000
Model RMSEA LO 90 HI 90 PCLOSE
Default model .030 .121 .140 .000
Independence
model .296 .288 .304 .000
Table 4.8: Measurement Model Fit
Lastly, the relationships between latent exogenous and endogenous variables were interpreted using unstandardized regression weights at 5% level of significance from Table 4.9 and 4.10. The interpretation is the same as the factor loading in measurement model above except SEM mainly focuses on the relationship between constructs.
D. EFFECT OF STRATEGY ON ORGANIZATIONAL STRUCTURE
Based on the result in table 4.9 below, all the assessed manifest variables had a positive significant effect on their construct. Similarly the overall strategy had a positive significant effect on organizational structure (ϒ = 0.210, P = 0.002 and SMC = 0.231). The implication is that changes in either the product breadth, market scope, focus to the specific customers, core business or vision statement leads to changes
in the aspects of complexity, formality and centralization of the organization. This finding is thus consistent with what many similar studies have found (Krishna & Shubhabrata 2015; Karani 2013; Yarmohammadzadeh et al, 2011; Chiyoge, 2009).
Unstandardized Regression SR SMC Estim
ate
S.E. C.R. P Estimat e Organization
Structure
<- Strategy .210 .068 3.102 .002 .175 .231 X5 <- Strategy .675 .048 13.964 *** .632
.399 X4 <- Strategy .800 .042 18.972 *** .782 .611 X3 <- Strategy .913 .042 21.758 *** .849
.720 X2 <- Strategy .972 .042 23.373 *** .886 .786
X1 <- Strategy 1.000 .867
.751 Y1 <- Organization
Structure
.584 .043 13.464 *** .692 .478 Y2 <- Organization
Structure
.500 .041 12.276 *** .632 .400 Y3 <- Organization
Structure
1.000 .863
.745 Y4 <- Organization
Structure
.970 .070 13.799 *** .710 .504
Table 4.9: Regression Weights without the Moderator
However, when the moderator is introduced as shown in table 4.10 below, the effect of strategy on structure turns insignificant and negative (P = .815, ϒ = -019 and SMC = .113). According to Hayes (2013), a moderating effect exists if, upon introduction of the moderator, the effect of the predictor (in this study strategy) is either; enhanced, decreased or reverses the outcome. In this case the effect is that of reversal as shown by changes in the direction (from positive to negative) and the fact of insignificance. This finding thus indicates that the decision maker overrides the influence of strategy on the organizational structural aspects of centralization, formality and complexity. Although similar systematic studies to this study are not common in the literature, this finding resonates with the position that the decision makers have been found to influence most the aspects of organization structure that impact the control function such as the degree of; centralization, standardization and differentiation (Hollenbeck, 2002; Jabnoun, 2005; Auh & Mengue, 2007). These aspects are what this study used to measure organization structure.
Unstandardized Regression SR SMC Estimate S.E. C.R. P Estimate Organization
Structure
<- Strategy -.019 .083 -.234 .815 -.016 .113 Organization
Structure
<- Decision Maker
.492 .100 4.919 *** .346 X5 <- Strategy .695 .049 14.295 *** .645
.416 X4 <- Strategy .813 .043 19.031 *** .787
.620 X3 <- Strategy .926 .043 21.750 *** .854 .729 X2 <- Strategy .972 .043 22.826 *** .880 .774
X1 <- Strategy 1.000 .859
.739 Y1 <- Organizatio
n Structure
.600 .044 13.653 *** .932 .491 Y2 <- Organizatio
n Structure
.517 .041 12.527 *** .724 .416 Y3 <- Organizatio
n Structure
1.000 .739 .725
Y4 <- Organizatio n Structure
.977 .071 13.730 *** .671 .497 X10 <- Decision
Maker
1.001 .035 28.310 *** .898 .869 X9 <- Decision
Maker
.785 .044 17.774 *** .701 .524 X8 <- Decision
Maker
.788 .043 18.380 *** .645 .546 X7 <- Decision
Maker
.778 .049 15.786 *** .852 .450 X6 <- Decision
Maker
1.000 .705
Page 388 www.ijiras.com | Email: [email protected]
Table 4.10: Regression Weights for All Variables with the Moderator
A persistent question in the inquiry of organization structures has had to do with why structures differ amongst firms in the similar contexts pursuing similar strategies. This study has shown that variations in organization structure can be explained by the interventions of decision makers who typically do not perceive reality in the same way nor possess same capability. Similarly, the existence of inappropriate structure against a given strategy can also be explained thus. There is a chance that the decision maker’s misinterpretation of the requirement of strategy or any other contingency factor may lead to inappropriate action. Strategy just like other contextual factors are at best stimulus for organization structural decision making.
V. CONCLUSION
This study has yielded a high empirical validity for its theoretical model that was to establish; the moderating effect of the decision-maker in the relationship between strategy and organization structures. Accordingly, the assumption held within the structure-contingency model that the linkage between strategy and structure is logical and direct is no longer tenable. Thus the inevitable conclusion of the study is that the organization structure is an outcome of the decision maker’s choice. The consequence of this conclusion is that when designing organization structure it is imperative to consider the decision maker(s) and decision making process. Those who have the power to direct organizations ultimate take the call on structure. Thus, the study advances the cause for complementing structure-contingency framework with the strategic choice approach in designing organization structure and future studies. The strategic choice approach which argues that the process of structuring an organization is fundamentally a decision problem finds empirical support in this study.
REFERENCES
[1] Achcaoucaou, F., Bernardo, M. & Castan J. M. (2009). “Determinants of Organization Structures: An Empirical Study”. Review of International Comparative Management Vol. 10, Issue 3.
[2] Auh, S., Mengue, B. (2007). “Performance implications of the direct and moderating effect of
[3] Bearch L.R. & Terry Connoly (2005). “The Psychology of Decision Making: People in Organizations (Foundations for Organizational Science)” 2nd Edition, Sage Publication, Thousand Orks, London
[4] Bubnicki, Z. (2003). “Analysis and decision making in uncertain systems”. New York, NY: Springer-Verlag. [5] Burns, T., Stalker, G. (1961). “The Management of
Innovation, London": Tavistock
[6] Burton, R. & Obel, B. (2004). “Strategic Organizational Diagnosis and Design”, Boston, MA: Kluwer Academic Publishers.
[7] Busienei, John R. K’Obonyo P. O., & Ogutu M. (2013). “Moderating effect of business strategy and organization structure on the relationship between human resources strategic orientation and performance”. Prime Journal of Business Administration and Management (BAM) 1261. Vol. 3(1), pp 834-857.
[8] Chandler, A. D. (2003). “Strategy and structure. Chapters in the history of the American industrial enterprise”. Frederick, MD: Beard Books.
[9] Chandler, A. (1966). “Strategy and structure” New York: Doubleday
[10]Chandler, A. D. (1962). “Strategy and Structure”. Cambridge, MA: MIT Press.
[11]Chathoth, P.K. (2002). “Co-alignment between Environment Risk, Corporate Strategy, Capital Structure, and Firm Performance: An Empirical Investigation of Restaurant”. PhD. Thesis, Virginia Polytechnic Institute and State University, Blacksburg, Virginia USA.
[12]Child J, Chung L & Davis H. (2003). “Performance of cross-border units in China: a test of natural selection, strategic choice and contingency theories”. Journal of International Business Studies.
[13]Child, J. (1997). “Strategic choice in the analysis of action, structure, organizations and environment: retrospect and prospect”. Organizational studies, 18(1):43-76
[14]Child, J. (1972). "Organizational Structure, Environment and Performance: The Role of Strategic Choice", Sociology vol. 6 no. 1 1-22
[15]Chindia, E. W. & Pokhariyal G. P. (2015). “Organizational Structure and Accuracy of Performance Forecasting in Large Manufacturing Firms in Kenya”. International Journal of Managerial Studies and Research Vol. 3 Issue8, August, pp 1-6.
[16]Chiyoge, B.S. (2009). “Moderating effect of core-competence on co-alignment factors (strategy, structure and environment) on performance”. Unpublished PhD. Thesis, University of Nairobi.
[17]Cole G.A (2004). “Management: Theory and Practice” (6th Ed), London: Continuum.
[18]Cooper D.R. & Schindler P.S (2006). “Business Research Methods”. New Delhi. Tata McGraw-Hill Publishing Company Limited.
[19]Currie, W. L. (2012). “Institutional isomorphism and change: the national programme for IT – 10 years on”. Journal of Information Technology, Volume 27, Number 3, 14, p. 236-248(13).
[20]Delios, A., Zhou, N. & Xu, W.W. (2008). “Ownership structure and the diversification and performance of publicly-listed companies in China”. Business Horizons, Vol. 51, pp. 473-483.
[21]Donaldson, L., (2001). “The Contingency Theory of Organizations”. Sage, Thousand Oaks.
Page 389 www.ijiras.com | Email: [email protected] [23]Eisenhadrd, K. (2004). “Competing on the edge: strategy
as structured chaos”. Thousand Oaks, CA: Sage Publications.
[24]Forte, M., Hoffman, J., Lamont, B. & Brockmann, E. (2000). “Organizational form and environment: an analysis of between-form and within-form responses to environmental change”. Strategic management journal, 21(7):753-773.
[25]Greenberg, J. (2011). “Behavior in Organizations” (10th Ed). Upper Saddle River, NJ: Prentice Hall.
[26]Jabnoun, N. (2005). “Organization Structure from Customer-Oriented TQM: An Empirical Investigation”. The TQM Magazine, 17(3):226-236.
[27]Jackson, D. L. (2003). “Revisiting sample size and number of parameter estimates: Some support for the N: q hypothesis”. Structural Equation Modelling, 10 (1), 128 − 141.
[28]Hall, R. & Tolbert, P.S. (2009). “Organization: Structures, processes, and outcomes” (9th Ed.). Upper Saddle River, NJ: Prentice Hall.
[29]Hollenbeck, J. (2000) “A structural approach to external and internal person team fit”, Applied psychology: an international review, 49(3):534-549
[30]Hengyang, Y., Jing R. & Ting R. (2015). “Ownership and Management Performance in a Transitional Economy: The Case of the Chinese Real Estate Industry”. Management and Organization Review, 11, pp 715-737. [31]Karani, L.M. (2013). “Effects of organization structure on
strategy implementation; A case of Manufacturing Firms in Nakuru, Kenya”. Lap Lambert Academic Publishing. [32]Kariuki, P. M. (2015). “Organizational Structure and
Internal Processes of Large Manufacturing Firms in Kenya”. Journal for Studies in Management and Planning Vol. 1 Issue 07.
[33]Kline, R.B. (2011). “Principles and Practice of Structural Equation Modelling” (3rd Ed.) The Guilford Press New York London.
[34]Krishna, C.B. & Shubhabrata B. (2015). “Configurations of Resources, Strategy, Structure and Environment in Young High-technology Firms: Evidence from Qualitative Comparative Analysis”. Global Business Review 16(6) 1012–1024
[35]Lorch, J. (1977). “Organization Design: A Situational Perspective”. Organizational Dynamics, 6(2): 12-14. [36]Lunenburg, F.C. (2012). “Organization Structure:
Mintzberg’s Framework”. International Journal of Scholarly, Academic, Intellectual Diversity Volume 14, Number 1.
[37]Mackinnon, A. & Powell B. (2008). Decision Making and Problem Solving. Palgrave Macmillan UK.
[38]Meilich, O. (2006). “Bivariate models of fit in contingency theory - Critique and a polynomial regression alternative”. Organizational research methods, 9(2):161-193.
[39]Miles, R.E., Snow C.C., Meyer A.D. & Colman, H.J. (2011). “Organizational strategy, structure, and process”. Palo Alto, CA: Stanford University Press.
[40]Mintzberg, H. (2009). “Tracking strategies: Towards a general theory of strategy formation”. New York, NY: Oxford University Press.
[41]Mintzberg, H. (1984). “The structure of organizations”, Barcelona: Ariel
[42]Mullins, L.J. (2007). “Management in fives: Designing Effective Organizations”. NJ: Prentice – Hall.
[43]Nasrallah, W. & Qawashem, S. (2009). “Comparing multi-dimensional contingency fit to financial performance of organizations”. European journal of operational research, 194(1):911-921 Review of International Comparative Management Volume 10, Issue 3, July 2009 577.
[44]Olivieira, N. & Takahashi N. (2012). “Automated organizations: Development and structure of the modern business firm. New York, NY: Springer.
[45]Orlikowski, W.J. (2007). “Sociomaterial practices: exploring technology at work”. Organization Studies, Vol. 28 No. 9, pp. 1435-1448.
[46]Pearce, J. & Robinson R. (2012). “Strategic Management”. McGraw-Hill Education; 13 edition. [47]Pettigrew, A., Massini, S., Numagami, T. (2000).
“Innovative forms of organising in Europe and Japan”. European management journal, 18(3): 259-73.
[48]Powell W.B. (2008). “Approximate dynamic programming: Lessons from the field Proceedings” - Winter Simulation Conference. 205-214. DOI: 10.1109/WSC.2008.4736069
[49]Quangyen, T. & Yezhuang T. (2013). “Organizational Structure: Influencing Factors and Impact on a Firm”. American Journal of Industry and Business Management Vol. 3 pp. 229-236.
[50]Robbins, S.P. (2004). “Organization Theory: Structure, Design and Application”. Englewood Cliff, NU: Prentice-Hall Inc.
[51]Robbins, S.P. & DeCenzo, D.A. (2005). “Fundamentals of Management: Essential Concepts and Applications”. Prentice Hall, Upper Saddle River, NJ.
[52]Singh, S. K. (2009). “Structuring organizations across industries in India”. Management Research News, Vol. 32 Iss 10 pp. 953 – 969.
[53]Shaomin, L. & Jun X. (2008). “The Roles and Performance of State Firms and Non-State Firms in China’s Economic Transition”. World Development Vol. 36, No. 1, pp. 39–54.
[54]Stoner, J.A.F., Freeman, R.E. & Gilbert, Jr.D.R. (2004). “Management”. (6th Ed). Patpargany Delhi: Pearson Prentice – Hall.
[55]Ugbomhe, O.U. & Dirisu A.B. (2011). “Organizational Structure: Dimensions, Determinants and Managerial Implication”. International Journal of Economic Development Research and Investment, Vol. 2 No. 2. [56]Yarmohammedzadeh, P., Allammah S. M., Ghalavandi
H., Farhang A. & Ajdari Z. (2011). “The Analysis of the Relationship between Organizational Structure and Information Technology (IT): and the Barriers to its Establishment at the University of Isfahan from the Faculty Members’ Viewpoints”. Higher Education Studies, Vol. 1, No.1.
Page 390 www.ijiras.com | Email: [email protected] Journal of Operations and Production Management, Vol.
33 Issue 9 pp. 1202 – 1229
[58]Zikmund, W.G., Babin, B.J.,Carr, J.C. & dan Griffin, M. (2010). “Business Research Methods”, 8th edition. Australia: SouthWestern Cengage Learning.
[59]Zikmund, W.G. (2003). “Business Research Methods”. 7th Ed, Thomson Learning, Mason, Ohio.