A Hybrid Optimization Algorithm to Evaluate the
CCWPE Based on DEA Sampled by FCE
Zhibin Liu
Department of Economics and Management, North China Electric Power University, Baoding City, China
Email: [email protected]
Chunyu Gao
Institute of Agricultural Resources and Regional Planning, Chinese Academy of Agricultural Sciences, Beijing City,China
Email: [email protected]
Abstract—Along with the reform in electric power market and the establishment of bidding for access mechanism, the competition among the power generation enterprises is more intense. As a kind of renewable clean energy, wind power has the disadvantages of no pollution, low cost, but the wind power also has the inherent shortcoming of intermittence, random and instability. To evaluate the core competitiveness of wind power enterprises (CCWPE), the authors overcame the shortcoming of the traditional methods, and proposed a hybrid optimization method which unified the fuzzy comprehensive evaluation (FCE) and data envelopment analysis (DEA) model, which took FCE as the foundation to sample, and used DEA theory to establish the CCWPE evaluating model. The model could not only play the advantages of DEA, but overcome the problem of seeking training sample with high quality. The CCWPE evaluation of 4 wind power generation enterprises indicated that the method was efficient and reliable.
Index Terms—data envelopment analysis, fuzzy comprehensive evaluation, core competitiveness, wind power generation enterprises
I. INTRODUCTION
Electricity is the basic industry in China, which has the important strategic significance to maintain the social stability, ensure the national security and promote the economic development. With the reform of electric power market, the establishment and improvement of bidding for access mechanism, the power generation enterprises enter the electric power market as the competitors, face the pressure of market competition directly, the competition among the power generation enterprises is more and more intense. As a kind of clean renewable energy, wind power has not the environmental pollution which the conventional energy source creates. With the rapid development in recent years, the wind power scale is expanding continually, and it has huge superiority in the electric power new energy. But the wind power also has the inherent shortcoming of intermittence and random, along with a large number of wind power access network, inevitably brings the serious
challenge to the power system security, the steady operation and the power quality.
So it is very important to analyze and evaluate the core competitiveness of wind power enterprises (CCWPE) objectively, which can help them to identify the market position, make the targeted strategy and increase the economic benefits. When evaluating the core competitiveness of wind power generation enterprises, the uncertain type evaluation indices of institutional factor, competition performance, input factor and process factor are the fuzzy variables, which have the characteristics of unclear boundary, so we use fuzzy theory to study. But in the practical application, the fuzzy comprehensive evaluation (FCE) method only can reflect the competitive strength degree of different enterprises, cannot reflect the enterprise weaknesses as well as the reason; At the same time, the evaluation index weight is main determined based on the subjective judgment, it is difficult to exclude the deviation for the human factors. Data envelopment analysis (DEA) can evaluate the relative effectiveness of each enterprise, find out the enterprise weaknesses and the reason, and it need not any weight hypothesis, the each input and output weight is not determined by the subjective judgment, but get the optimal weight according to the actual data, thus eliminate the deviation for the human factors, it has the very strong objectivity [1-3]. Based on the above consideration, the authors constructed a hybrid method to evaluate the core competitiveness base on data envelopment analysis and fuzzy comprehensive evaluation.
II. FUZZY DATA ENVELOPMENT ANALYSIS MODEL CONSTRUCTION
fuzzy characteristics, and the comprehensive evaluating aimed to the fuzzy factors is called fuzzy comprehensive judgment. The basic theory and steps are as follows:
Step 1: We classified the factor sets,
{
x x xn}
X = 1, 2L, , according to the characteristics, and the s subsets are formed.
{
i i in}
i x x x
X = 1, 2,⋅⋅⋅, i =1,2,⋅⋅⋅,s. (1) In equation (1):
∑
= = s i i n n 1 ;U
1 ; = = i i X X . ,i j O XXiI j ≠ ≠
Step 2: We made the comprehensive decision for each sub-factor Xi. If Yi =
{
yi1,yi2,L,yin}
is the evaluating set of Xi, in which the evaluating set expressed the different degrees from high to low. Then we could evaluate the performance of difference sub-factors. For example, when m=4, Yi ={
yi1,yi2,L,yin}
may express 4 degrees, superior, good, general and bad.The weight of different factors in Xi is Ai.
{
i i in}
i
a
a
a
A
=
1,
2,
L
,
(2)In equation (2):
1 1 =
∑
= ni i it aIf
R
i is single factor matrix, then we could gain the fuzzy judgment vector:{
i i im}
i i
i A R b b b
B = ⋅ = 1, 2,L, , i=1,2,L,s
Step 3: We could see each Xi as a influence factor, and X was also a factor set,
X
=
{
x
1,
x
2,
L
,
x
s}
, then the single factor matrix of factor setX
is:⎥ ⎥ ⎥ ⎥ ⎦ ⎤ ⎢ ⎢ ⎢ ⎢ ⎣ ⎡ = ⎥ ⎥ ⎥ ⎥ ⎦ ⎤ ⎢ ⎢ ⎢ ⎢ ⎣ ⎡ = sm s s m m
s b b b
b b b b b b B B B R L M M M M L L M 2 1 2 22 21 1 12 11 2 1 (3)
Each
X
1 reflected some kinds of fuzzy characteristics of X as a part of X , and which may distribute the weight in terms of their important degree{
a
a
a
s}
A
=
1,
2,
L
,
, then we could obtain gain thesecond-level fuzzy vector, the comprehensive judgment result B:
{
b
b
b
m}
R
A
B
=
⋅
=
1,
2,
L
Now, we must carry on the decomposition again if the Xi, the first-level factor set, still contained more
influence factors. Therefore, we constructed the third-level model; the four-third-level models, etc [4-6].
B. Data Envelopment Analysis Evaluation Model
In 1957, when analyzing the agriculture production ability of British, Farrell proposed the production efficiency measurement (PEM) method. And he valuated the efficiency value, and determined the frontline efficiency based on the mathematical method through the new non-preinstall production function. Generally, this can be seen the DEA’s rudiment. In 1978, Charnes and Cooper proposed the DEA method formally, which estimated the relative validity between the input units and the output units. And we called the input units and the output units as the decision making units (DMU), which searched the optimal solution using the mathematical method. The C2R model was the first DEA model that be proposed and the basic description was as follows:
⎪ ⎪ ⎪ ⎪ ⎩ ⎪⎪ ⎪ ⎪ ⎨ ⎧ ≥ ⋅⋅ ⋅ = ≥ ⋅⋅ ⋅ = ≤ = = =
∑
∑
∑
∑
= = = = 0 ) , , , ( 0 ) , , , ( 1 . . max 2 1 2 1 1 1 1 1 T s T m m i i i s r r r j m i i i s r r r u u u u v v v v x v y u h t s x v y u η (4)And the above model can be described as equation (5), which was a fractional program.
⎪ ⎪ ⎩ ⎪⎪ ⎨ ⎧ = ≥ − ≥ 1 0 . . 0 max 0 j T j T j T j T X w Y v x w t s y v (5) ) , , 2 , 1
(j= ⋅⋅⋅
Now, we supposed that the DMU input was as follows:
(
)
Tn
x
x
x
X
=
1, 2,
L
The DMU output was as follows:
(
)
Tn
y
y
y
Y
=
1, 2,
L
The
( )
x
,
y
expressed the productive activities, for several DMU, the related productive activities were as follows:(
xj,yj)
, j=1,2,L,nThe
x
ij was the total input amounts; andv
i was theweight of
i
thinput,u
r was the weight ofr
th.In equation (6), the
x
ij andy
rj were known,v
iandr
u
were variable, then we could gain the optimal model that was as follows:⎪ ⎪ ⎪ ⎪ ⎪ ⎪ ⎪ ⎩ ⎪⎪ ⎪ ⎪ ⎪ ⎪ ⎪ ⎨ ⎧ ≥ ⋅ ⋅ ⋅ = ≥ ⋅ ⋅ ⋅ = ⋅ ⋅ ⋅ = ≤ = =
∑
∑
∑
∑
= = = = 0 ) , , , ( 0 ) , , , ( , , 2 , 1 1 . . max 2 1 2 1 1 1 1 0 1 0 T s T m m i i i s r r r m i i i s r r r u u u u v v v v n j x v y u t s x v y u (7)Order: tv tu
x v
t= t1 ,
ω
= ,μ
=0
Then the equation (7) can be expressed:
⎪ ⎪ ⎪ ⎩ ⎪⎪ ⎪ ⎨ ⎧ ⎪ ⎪ ⎩ ⎪⎪ ⎨ ⎧ ≥ ≥ = ≥ − = 0 , 0 1 0 . . max ) ( 0 0 μ ω ω μ ω μ x y x t s V y P T j T j T T (8)
The equation (8) was the basic model, but the accuracy degree of C2R model was lower in some occasions. And the model could evaluate the technology effectiveness of the different units. The evaluating accuracy of C2GS2 model was high; the C2GS2 model was as the equation (9):
(
)
( )
⎪ ⎪ ⎪ ⎩ ⎪ ⎪ ⎪ ⎨ ⎧ ⎪ ⎪ ⎩ ⎪ ⎪ ⎨ ⎧ ⋅ ≥∈ ⋅ ≥∈ = ≥ − − ∈ = + ∈ T T T T T T j T T e e x y x t s V y P μ ω ω μ μ ω μ μ 1 , 0 . . , max ) ( 0 0 0 0 0 (9)For the equation (9), the linear programming problem was:
(
)
⎪ ⎪ ⎪ ⎪ ⎪ ⎪ ⎪ ⎪ ⎩ ⎪⎪ ⎪ ⎪ ⎪ ⎪ ⎪ ⎪ ⎨ ⎧ ⎪ ⎪ ⎪ ⎪ ⎪ ⎪ ⎪ ⎩ ⎪ ⎪ ⎪ ⎪ ⎪ ⎪ ⎪ ⎨ ⎧ ≥ ≥ ≥ = = + = + ∈ = + ∈ − ∈ + − = = + = − + −∑
∑
∑
0 , 0 , 0 , 1 , . . . . ), ( min[ ) ( 1 0 1 0 1 s s y s y x s x t s t s V s e s e D j n j j n j j j n j j j D T T λ λ λ θ λ θ (10)Then for the optimal solutionVD
( )
ε
≤1, theθ
was theeffective index, and the greater the
θ
was, expressed better technology effectiveness. In order to solve the linear program model, we constructed the optimal function values aiming at the decision making units of evaluation index; they are the decimal between 0 and 1. Based on the above analysis, the optimal function value matrix M can be expressed as follows:(
M M My)
mij x yM = 1, 2,L, =( ) ×
⎥
⎥
⎥
⎥
⎥
⎦
⎤
⎢
⎢
⎢
⎢
⎢
⎣
⎡
=
xy x x y ym
m
m
m
m
m
m
m
m
L
M
M
M
M
K
L
2 1 2 22 21 1 12 11 (11)C. The Evaluation Results Determination
We multiplied the optimal function values
(
j y)
mij =1,2,L, aiming at all evaluation indices of
th
i
wind power generation enterprisesXi(
i=1,2,Lx)
,the product di is the comprehensive evaluation result of
i X :
)
,
,
2
,
1
(
1x
i
m
d
y j iji
=
∏
=
L
=
(12)
The bigger of the di, indicates that the comprehensive
evaluation result of Xi is better, and the enterprise core
competitiveness is stronger [7-11].
III.NUMERICAL SIMULATION AND ANALYSIS
A. The Index System of Core Competitiveness Evaluation (1) Institutional factor indices. The institutional factors include the equity structure and corporation governance.
(2) Competitive performance indices. The ultimate goals of power generation enterprises are to capture the market, gain the profit and get their own sustainable development; therefore, the competitive performance can be reflected from the market ability, profitability ability and growth ability.
(3) Input factor indices. Input factors are mainly referred to all the resource factors that can be used in the purchasing, production and sale activities, including the equipment resources, geography resources, credit resources, relationship resources and human resources.
(4) Process factor indices. Process factors are mainly referred to the integration, development and efficient allocation resources ability of power generation enterprises, including the financial operation ability, production ability and organizational culture ability.
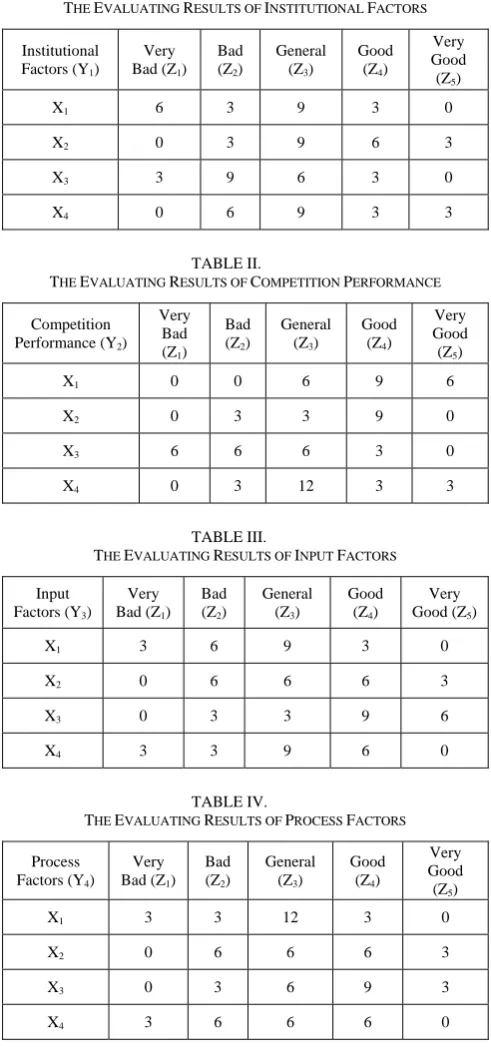
B. The Core Competitiveness Evaluation Based on Fuzzy Data Envelopment Analysis
To determine the evaluation index set Y={institutional factors (Y1), competitive performance (Y2), input factors
(Y3), process factors (Y4)}, at the same time, to determine
the evaluation level set Z= {very bad (Z1), bad (Z2),
general (Z3), good (Z4), very good (Z5)}. We carried on
the fuzzy evaluation to the evaluation index Yj(j=1,2,…,4), the results were shown as Table 1 to Table
4.
TABLE I.
THE EVALUATING RESULTS OF INSTITUTIONAL FACTORS
Institutional Factors (Y1)
Very Bad (Z1)
Bad (Z2)
General (Z3)
Good (Z4)
Very Good (Z5)
X1 6 3 9 3 0
X2 0 3 9 6 3
X3 3 9 6 3 0
X4 0 6 9 3 3
TABLE II.
THE EVALUATING RESULTS OF COMPETITION PERFORMANCE
Competition Performance (Y2)
Very Bad (Z1)
Bad (Z2)
General (Z3)
Good (Z4)
Very Good (Z5)
X1 0 0 6 9 6
X2 0 3 3 9 0
X3 6 6 6 3 0
X4 0 3 12 3 3
TABLE III.
THE EVALUATING RESULTS OF INPUT FACTORS
Input Factors (Y3)
Very Bad (Z1)
Bad (Z2)
General (Z3)
Good (Z4)
Very Good (Z5)
X1 3 6 9 3 0
X2 0 6 6 6 3
X3 0 3 3 9 6
X4 3 3 9 6 0
TABLE IV.
THE EVALUATING RESULTS OF PROCESS FACTORS
Process Factors (Y4)
Very Bad (Z1)
Bad (Z2)
General (Z3)
Good (Z4)
Very Good (Z5)
X1 3 3 12 3 0
X2 0 6 6 6 3
X3 0 3 6 9 3
X4 3 6 6 6 0
(2) Structure the membership matrix of evaluation indices
The membership matrix Rj (j=1,2,…,4) for every
evaluation index Yj (j=1,2,…,4) was as follows:
⎥ ⎥ ⎥ ⎥ ⎦ ⎤ ⎢ ⎢ ⎢ ⎢ ⎣ ⎡ = 0 143 . 0 571 . 0 286 . 0 0 0 143 . 0 286 . 0 428 . 0 143 . 0 143 . 0 286 . 0 428 . 0 143 . 0 0 0 143 . 0 428 . 0 143 . 0 286 . 0 1 R ⎥ ⎥ ⎥ ⎥ ⎦ ⎤ ⎢ ⎢ ⎢ ⎢ ⎣ ⎡ = 143 . 0 143 . 0 571 . 0 143 . 0 0 0 142 . 0 286 . 0 286 . 0 286 . 0 0 429 . 0 429 . 0 142 . 0 0 286 . 0 428 . 0 286 . 0 0 0 2 R ⎥ ⎥ ⎥ ⎥ ⎦ ⎤ ⎢ ⎢ ⎢ ⎢ ⎣ ⎡ = 0 286 . 0 428 . 0 143 . 0 143 . 0 286 . 0 428 . 0 143 . 0 143 . 0 0 142 . 0 286 . 0 286 . 0 286 . 0 0 0 143 . 0 428 . 0 286 . 0 143 . 0 3 R ⎥ ⎥ ⎥ ⎥ ⎦ ⎤ ⎢ ⎢ ⎢ ⎢ ⎣ ⎡ = 0 286 . 0 286 . 0 286 . 0 142 . 0 143 . 0 428 . 0 286 . 0 143 . 0 0 142 . 0 286 . 0 286 . 0 286 . 0 0 0 143 . 0 571 . 0 143 . 0 143 . 0 4 R
(3) Establish the optimal objective function value matrix
The authors selected the index values of very bad (Z1),
bad (Z2), and general (Z3) as the system input, the good
(Z4) and very good (Z5) as the system output. And we
selected the electric power enterprises Xi (i=1,2,3,4) as
the decision-making unit of the DEA method, and now
we introduced the input vector
(
)
T
v
v
v
V
3'' 2 ' 1 '
,
,
=
, andthe output vector
(
)
T
u
u
U
2'' 1 '
,
=
.For the institutional factors (Y1), we took the
transposed matrix R1T of its membership matrix as DEA’s
input and output data. And we evaluated the efficiency of electric power enterprise X1. Using the LINDO software,
we could gain m11=0.5000, this is the optimal value of
electric power enterprise X1 in the institutional factors
(Y1). Similarly, we could gain the performance of the rest
three electric power enterprises in the institutional factors (Y1): m21=1.0000; m31=0.7483; m41=0.3749.
M1=(m11, m21, m31, m41)T
=(0.5000, 1.0000, 0.7483, 0.3749)T So similarly, we can gain:
M2= (1.0000, 0.6682, 0.3318, 0.2504)T
M3=(0.1671, 0.3341, 1.0000, 0.6682)T
M4=(0.3341, 0.9930, 1.0000, 0.6682)T
So we could build the optimal objective function value matrix M of the four electric power enterprises Xi
(i=1,2,…,4) in each of the evaluation index Yj
(4) Determination of the comprehensive evaluation matrix
The comprehensive evaluation results of wind power generation enterprises Xi (i=1,2,…,4) were as follows:
027914 . 0
4
1 1
1=
∏
== j
j
m d
221683 . 0
4
1 2
2 =
∏
== j
j
m d
248286 . 0
4
1 3
3=
∏
== j
j
m d
041914 . 0
4
1 4
4 =
∏
==
j j
m d
So, d3>d2>d4>d1, the comprehensive evaluation of
electric power enterprise X3 was best, the core
competitiveness of X3 was the strongest [12-15].
IV.CONCLUSIONS
The core competitiveness evaluating problems are influenced by many factors, and which involved a large of complex calculation process. For that matter, the competitiveness evaluating problem work is hard. The authors built a hybrid evaluation model of wind power enterprise competitiveness using the fuzzy evaluating method and DEA theory, which used the fuzzy comprehensive evaluation to sample and constructed the model based on the DEA theory. The model can exert the advantage of DEA theory, which needn’t to estimate parameters and determine the weight, so the final evaluating results are not influence by the index value. The model could not only play the advantages of DEA method, but overcome the problem of seeking training sample with high quality. Therefore, the method is fit for evaluating the core competitiveness problem.
ACKNOWLEDGEMENT
The work is supported by the Fundamental Research Funds for the Central Universities under Grant No. 11MR58.
The work is supported by the 2013 Soft Science Research Plan Item of Department of Science and Technology in Hebei Province.
The work is supported by the 2010 Social Scientific Research Foundation projects of Education Department in Hebei Province under Grant No. SZ2010506.
The work is supported by the Academy of Baoding Low-Carbon Development.
REFERENCES
[1] L. T. Fan, “Analysis and evaluation model of the competitiveness of China’s thermal power plants,” Harbin: Harbin University of Science and Technology, 2010. [2] J. M. Zhang, “Research on core competence of
independent power generation enterprise,” Beijing: North China Electric Power University, 2008.
[3] J. S. Liu, “Study on evaluation and cultivation of core competence of electric power enterprise in China,” Harbin: Northeast Forestry University, 2006.
[4] H. Li, Y. H. Wu, “Multi-level fuzzy comprehensive evaluation method and its application in the social assessment of traffic investment projects,” Industrial Technology Economics, vol. 26, pp. 94-96, October 2007. [5] S. Y. Kang, “Decision support system of performance
measurement for provide chain on combining multistage dynamic fuzzy comprehensive performance evaluation with BP neural network method,” Journal of Chongqing Technology Business University, vol. 22, pp. 373-377, April 2005.
[6] Y. Y. Hsu, “A heuristic based fuzzy reasoning approach for distribute system service restoration,” IEEE Trans on PWRD, vol. 9, pp. 948-953, February 1994.
[7] X. H. Wang, Y. Liu, “The comprehensive evaluation of agricultural production efficiency based on DEA model in our country,” Journal of Hebei University of Economics and Trade, vol. 29, pp. 53-59, January 2008.
[8] Z. L. Wang, S. Z. Shan, L. Qiu, “The DEA evaluation model of urban supply water performance based on chaos optimization algorithm,” Water Resources and Power, vol. 25, pp. 10-12, February 2007.
[9] Z. L. Wang, J. H. Tian, L. Qiu, “The DEA analysis of the urban supply water performance,” Journal of Water, vol. 36, pp. 1486-1491, December 2005.
[10] T. Shi, J.P. Liu, “Forecasting the most fund superior increment rate based on DEA and BP neural network,”
Industrial Technology Economy, vol. 27, pp. 143-146, May 2008.
[11] C. L Ma, “Decision making method for variable-rate fertilization based on data envelopment analysis and artificial neural network,” Journal of Agricultural engineering, vol. 20, pp. 152-155, February 2004.
[12] D. S. Liao, Y. P. Sheng, Y. W. Chen, C. F. Huang, X. W. Wang, “Research on psychological operations evaluation based on fuzzy comprehensive assessment method and fuzzy DEA,” Operations Research and Management Science, vol. 17, pp. 131-136, January 2008.
[13] Y. Zhang, X. J. Wang, “Study on evaluation method for investment project based on DEA and fuzzy theory,”
Technology Economics, vol. 29, pp. 64-67, February 2010. [14] Y. Peng, “Fuzzy DEA efficiency based on multiple programming,” Journal of Systems Engineering, vol. 19, pp. 548-552, May 2004.
[15] X. M. Qin, “Competitive ability evaluation for generation enterprises based on the fuzzy comprehension decision theory,” Beijing: North China Electric Power University, 2009.
Zhibin Liu, was born in Luannan County, China, and graduated from the Agricultural University of Hebei in 2004, gained the master's degree of management. The author’s major field of study is the information management.
Chunyu Gao, was born in Shuangcheng City, China, and graduated from the Chinese Academy of Agricultural Sciences in 2011, gained the doctor degree of agriculture. The author’s major field of study is the agricultural regionalization.