ISSN (Online): 2320-9364, ISSN (Print): 2320-9356
www.ijres.org Volume 7 Issue 4 Ser. I ǁ 2019 ǁ PP. 50-59
Numerical Study on the NO
xControl in Municipal Solid Waste
Incinerator by Direct Spray of Food Wastewater
Jingmei Jin
1, Sunghoo Kim
2, Jin-Do Chung
3*1Department of Architecture, Yanbian University, No.977 Gongyuan Road, Yanji City, Jinlin Prov. China 2
Department of Environmental Engineering, Shinhan University, Hoam-ro 95, Eujeongbu-si, Kyunggi, 11644, S.Korea
3Department of Environmental Engineering, Hoseo University, Hoseo-ro 79beon-gil, Baebang-eup, Asan-si,
Chungnam, 336-795, S.Korea *Corresponding Author:Jin-Do Chung
ABSTRACT: In this study, numerical study result of computational numerical simulation under the same condition of existing experiment result that researched NOx reduction effect by substituting ammonia water
required for SNCR process by food wastewater in MSW incinerator of C city was comparatively analyzed. Based on existing experiment result, 4 experiment conditions, that is, Case A in which NOx was removed by
using SNCR, Case B in which NOx was removed by spraying food wastewater in secondary combustion chamber,
Case C in which food wastewater was sprayed in primary combustion chamber (2ton/hr) and secondary chamber (4ton/hr) and Case D in which food wastewater was reversely sprayed in primary chamber (4ton/hr) and secondary chamber (2ton/hr) were established. In Case A, NOx generation was predicted to be higher than
that of experiment result by 5.4ppm and in Case B, it was predicted to be close to experiment result (29.0ppm). Case C & D also showed higher result than experiment result by app. 2ppm. When comparing Case A&B, a case of spraying food wastewater showed better NOx reduction effect and when comparing Case C with D, Case
C that sprayed much more food wastewater quantity in secondary combustion chamber showed better NOx
removal rate.
KEYWORDS: NOX Control;SNCR;CFD;Food Wastewater;MSW Incinerator.
--- Date of Submission: 30-12-2019 Date of acceptance: 12-01-2020
---I.
INTRODUCTION
Since 2005, as direct burial of food waste was prohibited in Korea, food waste has been made as resources (fodder, compost).
In washing, dehydration process, food waste leachate(food wastewater) that is organic by-product of high concentration has been generated in reality.
Since 2007, in order to convert to inland treatment of food wastewater as a result of prohibiting its ocean disposal, policies of converting existing treatment facility to inland treatment facility by the end of 2012 based on London Dumping Convention have been promoted by expanding inland treatment facility of food wastewater through promotion of general countermeasure for food wastewater inland treatment and making waste resource (biomass including food wastewater)as energy.
Since London Dumping Convention, ocean disposal of food wastewater was entirely prohibited from 2013 [1-4] .
Recently, as a method of inland treatment of food wastewater, a technology of spraying food wastewater and incinerating it in large incineration plant has been developed. As a part of this effort, in order to remove NOx in a process of incinerating MSW of C city, a technology of spraying food wastewater instead of
ammonia water that is reducing agent was developed and commercialized [5] .
In this study, based on existing experiment result [6] , numerical analysis was performed for NOx
generation amount, temperature being obtained from actual experiment by performing NOx removal test through
spray of food wastewater after predicting NOx being generated at the time of incinerating wastes by progressing
computer numerical simulation for MSW and food wastewater incineration process based on same experiment condition of CFD commercial code.
A principle of reducing NOx by food wastewater ammonia component is as shown on below formula (1), (2):
4NH3+6NO ⟶ 5N2+ 6H2O (1)
II.
EXPERIMENTAL
2.1 Numerical analysis method2.1.1 Analysis model
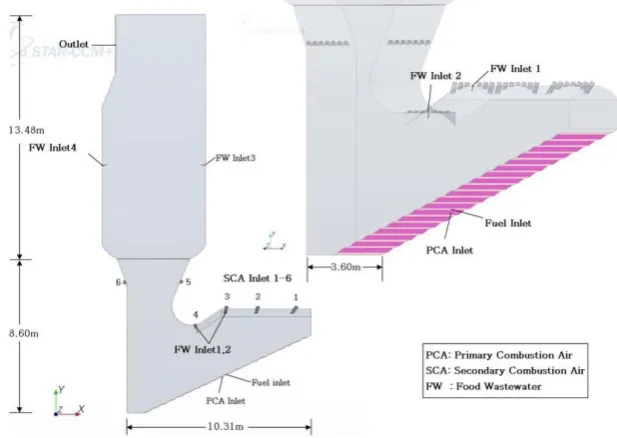
Incinerator applied for this study is continuous stoker type incinerator that incinerates MSW 200ton/day and in order to analyze actual incinerator shape (H×W×L=22.08m×10.31m×3.60m), it was implemented as 3D model. Major components are as follows.
(a) Fuel Inlet (b)Primary Combustion Air Inlet 1, 2, 3, 4, 5, 6(Primary combustion air inlet 1, 2, 3, 4, 5, 6) (c)Secondary Combustion Air Inlet(Secondary combustion air inlet) (d)Food Wastewater Inlet 1, 2, 3, 4(Food wastewater inlet 1, 2, 3, 4), (e)Outlet.
Shape and dimension of incinerator model are shown on Fig. 1. As shown on the Fig, in the bottom of boiler, fuel inlet is arranged between primary air inlets.
In the upper part of primary combustion chamber, 6 rows of secondary combustion air inlet are distributed and in inlet 1, 2, 3, 5, 6, 7 injection nozzles are provided in 1 row and in inlet 3, 4, 6 injection nozzles are provided. In central position, food wastewater spray nozzle 1, 2 are provided and in central part of secondary combustion chamber, food wastewater nozzle 3, 4 are provided at both sides. At secondary combustion chamber of left upper part of incinerator, outlet is located.
Fig.1 Schematic diagram of the incinerator
2.1.2 Physical model
(1) Operation data and input condition
In order to establish a physical model in progressing this study, 16 days’ operation data [7] of MSW incinerator of C city was surveyed. Based on surveyed operation data, computational simulation of incinerator was performed.
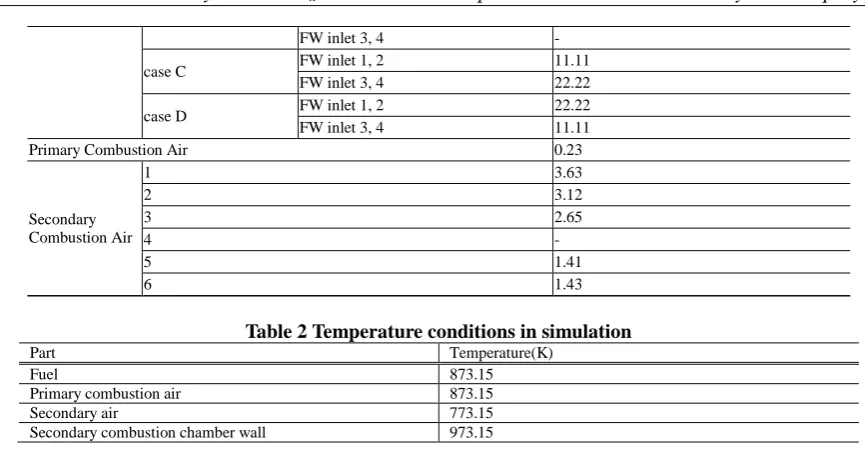
In this study, quantity of fuel and air being injected into each inlet was shown on below Table 1 and temperature condition of injection air and wall was shown on Table 2.
Table 1 Flow conditions of fuel and air in simulation
Item Velocity(m/s)
Fuel 0.000499
NH3 liquid
case A FW inlet 1, 2 0.08
case B FW inlet 1, 2 -
FW inlet 3, 4 -
case C FW inlet 1, 2 11.11
FW inlet 3, 4 22.22
case D FW inlet 1, 2 22.22
FW inlet 3, 4 11.11
Primary Combustion Air 0.23
Secondary Combustion Air
1 3.63
2 3.12
3 2.65
4 -
5 1.41
6 1.43
Table 2 Temperature conditions in simulation
Part Temperature(K)
Fuel 873.15
Primary combustion air 873.15
Secondary air 773.15
Secondary combustion chamber wall 973.15
Considered reaction formula is as follows.
C + O2= CO2(3)
C + 0.5O2= CO2(4)
H2+ 0.5O2= H2O(5)
NH2+ NO + 0.25O2= N2+ 1.5H2O(6)
Formula(3),(4),(5),(6) are reaction formula when waste combustion is progressed and formula(6) is reducing reaction when spraying food wastewater that plays a role of reducing agent.
Food wastewater is composed of ammonia, water and other components but for an analysis, it was assumed to be composed of NH3 and water that are actually participated in reaction. Volume fraction of NH3 and H2O was
established as 0.1: 0.9.
2.2Case Set-up
Experiment condition of Table 3 was established by referring to existing experiment research result of Master’s degree thesis of Lee, Young-Jin [6]in which experiment was progressed with same incinerator.
Table 3 Establish of case A, B, C, D
Item
SNCR (㎥/hr)
Food wastewater (ton/hr) Temperature (℃) Emission (ppm) 1st Combustion chamber (Inlet 1, 2)
2nd Combustion chamber (Inlet 3, 4)
1st Combustion chamber (Inlet 1, 2)
2nd Combustion chamber (Inlet 3, 4)
1st Combustion chamber (A, B) 2nd Combustion chamber (C, D)
NOx CO
CaseA - 25.7 - - 1,254 948 41.1 -
Case B - - - 3.5 1,210 935 29.4 -
Case C - - 2.0 4.0 1,257 930 18.0 30.0
Case D - - 4.0 2.0 1,243 932 26.0 10.0
Note) FW: Food Wastewater
2.3 Analysis method
In this study, turbulence model-standard κ − ϵ model that was most stable and widely verified together with excellent performance ability when solving industrial flow problem was used for calculation. Regarding combustion reaction being taken place in incinerator, fast eddy break-up model was used and NOx
model followed Zeldovich mechanism considering thermal NOx only.
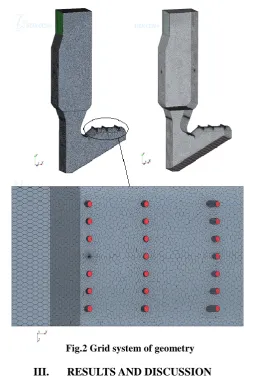
Fig.2 Grid system of geometry
III.
RESULTS AND DISCUSSION
Comparative summary between analysis result of Case A, B, C, D and relevant experiment result was shown on below Table 4 and its graphic diagram is Fig. 3.
NOx emission concentration at Case A outlet in case of removing NOx by relying on SNCR only was
46.5ppmthat was higher than experiment result of 41.1ppm by 5.4ppm. In case of Case B that sprays food wastewater at the speed of 3.5ton/hr at secondary combustion chamber without using SNCR, NOx emission
volume at outlet was 29.0ppm and this result was almost close to experiment result of 29.4ppm (less than the latter by 0.4ppm).
Table 4 Comparison of the modeling & experimental result
Items SNCR (NH3 Feed rate)
(㎥/hr)
Food wastewater
(ton/hr) Temperature (℃) NOx
Emission (ppm) combustion chamber combustion chamber combustion chamber
1st 2nd
1st 2nd 1st 2nd Modeling Experiment Modeling Experiment Modeling Experiment
CaseA - 25.7 - - 1,230 1,254 906 948 46.5 41.1
CaseB - - - 3.5 1,200 1,210 903 935 29.0 29.4
CaseC - - 2.0 4.0 1,130 1,257 902 930 29.0 18.0
CaseD - - 4.0 2.0 1,100 1,243 903 932 28.9 26.0
Fig.3 Comparison of the modeling & experimental result
3.1 Velocity field
Residence time in SNCR process is residence time of reducing agent in minimum temperature range and scale of reaction time. In order to achieve complete NOx removal reaction in most of the systems, residence
time of at least 0.2-0.5 seconds is required and generally, in pilot scale experiment, effective NOx reduction
could be obtained by enough residence time of app. 1 second[7-8]. Therefore, velocity of combustion gas in combustion chamber significantly affects reduction.
When observing from Fig. 4, as velocity of combustion gas in secondary combustion chamber is the fastest (3.2m/s), it is considered that its reaction time is enough after reducing agent is injected.
Flow streamline was shown on Fig. 5 by taking Case C as a typical case where combustion air, fuel and food wastewater flow are provided as a whole.
Fig.5 The streamline of Case C
3.2 Temperature field
In NOx occurrence, temperature exerts a significant influence. In order to suppress NOx, NOx
generation itself is required to be reduced and for already generated NOx, post-treatment shall be performed by
using reducing agent.
Already generated NOx is unable to be controlled by temperature but in order to suppress NOx
generation itself, temperature of combustion gas is required to be lowered and generation of local high temperature section should be avoided. Where, temperature of overall incinerator section rather than that of combustion gas itself is also included.
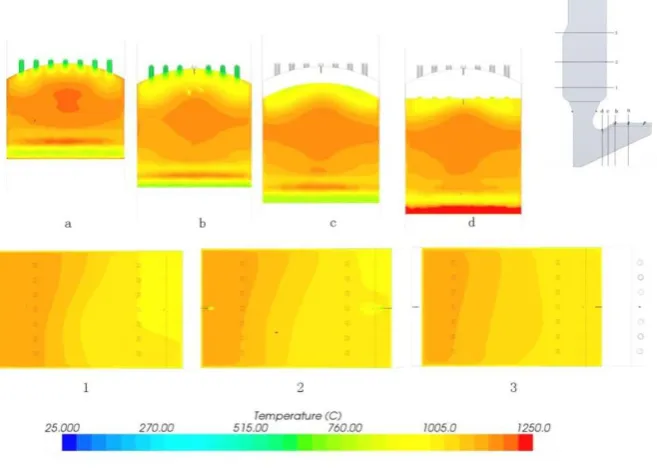
Temperature distribution in overall primary, secondary combustion chamber of incinerator was shown on Fig. 6 by each case. It could be seen that overall temperature in combustion chamber is distributed below 1,100oC and temperature in primary combustion chamber showed distribution over 1,100oC in every case and in Case B, C, D where food wastewater was sprayed, Case C and D that sprayed food wastewater in primary, secondary combustion chamber showed lower distribution than Case B that sprayed in secondary combustion chamber only.
When observing Case C & D, primary combustion chamber temperature of Case D that sprayed a lot of volume in primary combustion chamber showed temperature lower than that of Case C by 30oC. From this result, it could be realized that combustion temperature of primary combustion chamber was also lowered as all the food wastewater was sprayed from primary combustion chamber as well.
In case of Case A that simulated a case of removing NOx by entirely relying on SNCR of Case A, it
generally showed slightly high temperature distribution than other case of denitrification by relying on food wastewater. When comparing with primary combustion room temperature of experiment result, similar result was represented and both two results showed same changing pattern even though slight difference was evident.
Outlet temperature of incinerator secondary combustion room is required to be maintained over 850oC and when observing outlet temperature of secondary combustion chamber of flue gas in Fig. 6, it is shown to be distributed to 906oC and 902oC that is early stage of 900oC. When comparing with actual operation data of 900oC, it is proper temperature. However, there is a difference of app. 30oC than outlet temperature of secondary combustion chamber being distributed in the range of 930-950oC that is experiment result.
The result of analyzing a cause of difference by comparing experiment result with numerical analysis result is as follows.
In this study, at the time of computer numerical simulation, it was assumed that combustible components of MSW would be burnt in incinerator without considering moisture contained in wastes. It was assumed that combustible components as a fuel being composed of C(s), CO, H2 would be evaporated.
Food wastewater is also actually composed of water and sludge as well as ammonia component but it was assumed as ammonia solution (10%) of which concentration is lower than ammonia solution (25%) being used as reducing agent in SNCR process without considering other components.
There would be an activity of reducing NOx by reduction of ammonia component when incinerating
food wastewater by spraying it to combustion chamber in order to actually remove its NOx and other activity of
suppressing NOx generation itself by lowering temperature of combustion chamber while food wastewater under
room temperature is sprayed.
Moreover, as combustible components in sludge are burnt, outlet temperature of combustion chamber would be increased. Outlet temperature difference of 30-40oC between experiment result and numerical simulation is considered to be taken place by this cause.
Fig.6 Result of simulation of temperature distribution
Fig.7 Temperatures of section a, b, c, d, and section 1, 2, 3
3.3 NOxemission
In this study, predicting NOx generation is most important in order to achieve research objective of
verifying an effect of reducing NOx by spraying food wastewater.
Generally, when observing NOx emission volume, an effect of reducing NOx by spraying food
wastewater rather than by relying on ammonia solution using SNCR process was bigger by app. 17ppm and it could be confirmed through Fig. 9, 10. In case of Case C & D that spray food wastewater in primary, secondary combustion chamber, Case C that sprayed extensively in secondary combustion chamber (4ton/hr) while spraying less in primary combustion chamber (2ton/hr) emitted less NOx than Case D by 8ppm.
When comparing computer numerical simulation with experiment result, experiment result and Case A & B are considered to be almost coincided.
However, when changing food wastewater quantity being combusted in primary, secondary combustion chamber represented in Case C & D, change of NOx emission was almost marginal.
In experiment result, it could not be confirmed that NOx emission at outlet was reduced from 28ppm to
18ppm when spraying food wastewater at 2ton/hr in primary combustion chamber and 4ton/hr in secondary combustion chamber rather than when spraying food wastewater reversely and NOx of same quantity was
emitted.
A mode of spraying reducing agent in secondary combustion chamber for NOx reduction in general
incinerator is frequently used but a mode of spraying in primary combustion chamber is not frequently used. In view of experiment result, NOx reducing activity of food wastewater sprayed from primary combustion chamber
is more effective for reducing NOx by lowering temperature of combustion chamber rather than by chemical
reaction.
When comparing with NOx emission of experiment result, generally same changing pattern was represented.
Fig.8 Result of simulation of NOx emission
IV.
CONCLUSIONS
In this study, numerical analysis result being obtained by performing computer numerical simulation under the same condition as existing experiment result that researched on NOx reduction effect by substituting
ammonia water required for SNCR process by food wastewater in MSW incinerator of C city was comparatively analyzed.
As a result of numerical analysis, temperature of primary combustion chamber was represented over 1,100oC and as changing pattern, temperature of SNCR process that uses ammonia water as reducing agent was the highest as 1,230oC and comparing with this, temperature of Case B was represented as 1,200oC and Case C & D where food wastewater was sprayed both in primary and secondary combustion chamber showed 1,130 and 1,100oC, respectively. When comparing this result with temperature of primary combustion chamber of experiment result, Case A & B showed slight change but Case C & D showed difference as much as app. 130oC.
However, experiment result and numerical analysis result showed same changing pattern and in case of Case D that sprayed much plenty food wastewater in primary combustion chamber among Case C & D, it showed lower temperature than Case C that sprayed much plenty food wastewater in secondary combustion chamber by app. 30oC. From this result, it could be seen that when increasingly spraying room temperature food wastewater in primary combustion chamber, it has a tendency of further decreasing combustion temperature.
Temperature of secondary combustion chamber showed early 900oC in all the Cases and this result means difference lower than actual outlet temperature by 30-40oC. The reason of this result is that while simulating food wastewater numerically, as combustion heating value of solid waste in food wastewater was not reflected in numerical analysis while considering just ammonia and water component in food wastewater, combustion temperature was low and actual experiment value was represented to be high while solid combustible component was burnt.
NOx emission of Case A was predicted as 46.5ppm that is higher than actual experiment result by
5.4ppm and that of Case B was predicted to be very close to numerical analysis result and experiment result as 29.0ppm and this value was lower than experiment result by 0.4ppm.
Case C & D also showed higher difference than experiment result by app. 2ppm. When comparing Case A with B, Case B that sprayed food wastewater in secondary combustion chamber showed less NOx
emission and from this result, it could be seen that food wastewater induces better NOx reducing effect.
When comparing Case C with D, Case C that sprayed less food wastewater in primary combustion chamber and more in secondary chamber emitted NOx of 18ppm that is less than Case D that sprayed food
wastewater reversely.
www.ijres.org agent and that sprayed in secondary combustion chamber is more active in reducing NOx by creating reduction
and this result was obtained through analysis of temperature and NOx emission of Case C & D.
REFERENCES
[1]. MOLIT:Ocean environment management law, Article 32 [2]. London Dumping Convention/London Protocol Article 4
[3]. Administrative improvement method including problem and recommendation for waste classification of food wastewater, ME(2013)
[4]. ME, General countermeasure for inland treatment of food wastewater and making it as energy(2007) [5]. Song, J.H., Hoseo Univ., Doctor’s degree thesis28-30,51-84(2012)
[6]. Lee, Y.J., Hoseo Univ. Doctor’s degree thesis50-56(2013) [7]. Jin, J.M.:, Doctor’s degree thesis 64-65 (2015)
[8]. Shin, M.S., Shin, N.R., Jang, D.S., J. Kor.Soc. Environ, Eng.,35(2),32,115-123(2013)
[9]. Leckner, B., Karlsson, M., Dam-Johansen, K., Weinell, C.E., Kilpinen, P.& Hupa, M., Industrial and Engineering Chem. Research, 30, 2396-2404(1991)