Fusion Method for True Value Estimation
Based on Information Poor Theory
Xintao Xia
College of Mechatronical Engineering, Henan University of Science and Technology, Luoyang, China Email: [email protected]
Leilei Gao and Jianfeng Chen
College of Mechatronical Engineering, Henan University of Science and Technology, Luoyang, China Email: [email protected], [email protected]
Abstract—Poor information means incomplete and
insufficient information, such as small sample and unknown distribution. For point estimation under the condition of poor information, the statistical methods relied on large sample sizes and known distributions may become ineffective. For this end, a fusion method is proposed. The fusion method develops five methods, three concepts, and one rule. The five methods include the rolling mean method, the membership function method, the maximum membership grade method, the moving bootstrap method, and the arithmetic mean method. The three concepts comprise the solution set on the estimated true value, the fusion series, and the final estimated true value. The rule is the range rule. The results of the Monte Carlo simulation and of the experimental investigation on information of the quality evaluation for the tapered roller bearing indicate that the fusion method allows the number of the data to be little and the distribution to be unknown, having the reliable estimated result.
Index Terms—information fusion, point estimation, data
series, small sample, information poor system
I. INTRODUCTION
Point estimation, viz., true value estimation, is an important issue in data processing. According to classical statistics, the problem is taken into account to assess mainly the true value of a measurand under the condition of large sample sizes and known probability distributions. Commonly, the mathematical expectation or the arithmetic mean in statistics can be employed to evaluate the true value. And many methods have been developed, such as the maximum-likelihood method [1], the maximum a posteriori estimation [2], the weighted average method [3], and the least-square approximation [4].
Nevertheless, in fields of science and technology, many problems are characterized by small sample sizes and unknown probability distributions. For example, in development and manufacture of special type bearings
such as bearings for space applications or wind turbines, much less bearings can be made a trial due to many species, small quantity, or high cost, every time only ten-odd or even several bearings are required, thus only smaller characteristic data can be obtained. Accordingly, under the circumstances, point estimation becomes a commonly admitted difficult task. With the development of the information theory, it is possible to work it out with the help of the concept of information fusion [5-10]. In the information theory, this problem belongs to the category of the information poor system [5]. Poor information means incomplete and insufficient information, such as, in system analysis, a known probability distribution only with a small sample, an unknown probability distribution only with several data, and trends without any prior knowledge.
At present, parameter estimation for an information poor system is one of the hot topics in the field of information science and system science. For example, Anthony Hunter [6] presented the fusion rule for merging uncertain information, Robert S Lynch Jr [7] studied the fusion of legacy classifiers based on Bayesian data reduction, Zhi [8] made a damage effect assessment for battlefield target based on the multiple neural network fusion algorithm, and Liu [9] analyzed a least squares estimating sensitivity for self-calibrating parallel imaging.
It is particularly worth noting that the available methods for information fusion are based on the given rules which usually deal with the distribution characteristics of a data series. Although these methods can be employed to estimate the true value, different methods have different results owing to different rules. This does not mean that one method is better than another. It just shows that this method may be better for one data series, but the other method may be better for another data series. This is to say that the result achieved using single method is not the most reasonable "representative" of the true value based on the fact that it reflects single aspect of the attribute of a data series with poor information. For this reason, this paper develops five methods, three concepts, and one rule. The methods include the rolling mean method, the membership function method, the maximum membership grade Manuscript received March 1, 2011; revised June 1, 2011; accepted
July 1, 2011.
method, the moving bootstrap method, and the arithmetic mean method. The concepts comprise the solution set on the estimated true value, the fusion series, and the final estimated true value. And the rule is the range rule. Based on this, a fusion method for the multiple estimated true values is presented to put in practice the point estimation under the condition of poor information. And the Monte Carlo simulation and the experimental investigation on the evaluation for information of the quality parameters of the tapered roller bearing are used to make sure of adaptability of the fusion method proposed in this paper.
II.CONCEPT OF FUSION FOR TRUE VALUE
In the true value estimation, so far as the same data series with poor information is concerned, various methods should be used in order to obtain more varied information that can be utilized to describe the characteristics of the population of this data series from more aspects. As different methods have different rules [10], the characteristic information obtained is different. The characteristic information obtained has the relationship with the true value and can therefore form a set of information of the estimated true values. It is obvious that from different aspects, the set is an embodiment of the characteristics of the population. According to the information fusion theory, the true value can be evaluated by means of the set. This is the fusion method for the multiple estimated true values.
Suppose a raw data series, viz., a small sample of size N, outputted by a population, can be given by
2 ; , , 2 , 1 )); ( , ), ( , ), 2 ( ), 1 (
( = >
= x x xt x N t N N
X L L L (1)
where t is the sequence number, x(t) is the tth data in the raw data series X, and N is the number of the data.
It must be pointed out that according to the information poor system theory, N can be a small real number and the probability distribution of X can be unknown.
Definition 1: Solution set is a set on the true value estimated using the L methods. It is noted as
(2)
L l
X X X X
X0 =( 01, 02,L, 0l,L, 0L); =1,2,L,
where X0 is called the solution set and X0l is called the lth
estimated true value obtained using the lth method in mathematics.
The solution set is not the final solution to the problem. It is only a set on the varied characteristic information of the population.
Definition 2: Fusion for the multiple estimated true value means that a new value which is closely related with the set X0 can be acquired via a special method of mathematical treatment. This new value is the final solution X0True in accord with a rule Θ, which is denoted by
(3)
True 0 True
0 | |Fusion X A
X Θ ⊆
where X0True is the final solution that is a estimation for the true value of the population, viz., the final estimated
true value; ATrue is the true value set on the varied attributes of the population; symbol |Θ is according to the rule Θ; symbol |Fusion X0 means that X0 is fused using the L methods in mathematics; and symbol X0⊆ATrue means that X0 is included in ATrue.
Fusion for the true value, in fact, is that through the mathematical treatment of the solution set X0, a finally estimated true value is obtained, which is the final estimation for the true value of the attribute of the population.
In Definition 1, the L methods in mathematics are usually based on the information poor theory. The information poor theory is a theory on analysis for a data series with poor information (such as small sampling sizes, unknown probability distributions and trends) and consists of many mathematical theories which are different from classical statistics. For example, the theories such as the fuzzy set theory, the grey system theory, the rough set theory, the bootstrap methodology [5], the chaotic theory [11], and the Bayesian statistics belong to the category of the information poor system theory. In point estimation, many concepts and methods in the information poor theory can be employed to evaluate the true value. On the basis of available findings, this paper introduces the five methods, as shown in Table 1, which are used for fusion of the true value.
TABLE I.
MAIN METHOD ADOPTED IN INFORMATION POOR THEORY
No. l Method Remark
1 Rolling mean method Variation of weighted average method
2 Membership function method Method based on fuzzy set theory
3 Maximum membership grade method Method based on fuzzy set theory
4 Moving bootstrap method Variation of bootstrap methodology
5 Arithmetic mean method Method based on statistical theory
The steps to apply the fusion method for the multiple estimated true values are as follows:
1. A rule, denoted by Θ, is chosen, that is usually a convergence criterion.
2. A raw data series X outputted by a population is obtained (see (1)).
3. The estimated true values X0l, where l=1,2,…,5, is
calculated by means of the lth method in Table 1. 4. The solution set X0 is formed according to (2). 5. The final solution X0True in accord with the rule Θ is gained at repetitiously using the five methods in Table 1.
III.METHOD FOR ESTIMATED TRUE VALUE
a number of data and so on. At this point, the five methods shown in Table 1 may be suitable to settle the problem on both a small sample size and an unknown probability distribution.
The reason that only five methods are considered is that the more methods used, the more the prior knowledge required, but the fewer methods used, the fewer the characteristic information obtained. Commonly the number of the methods used can be 4-6 according to the information poor theory.
The reason for using the five methods in Table 1 is connected with their characteristics and is explained in detail below.
A. Rolling Mean Method
The 1st method is called the rolling mean method. It is a cross between the weighted average method and the bootstrap resampling.
Rearrange x(t) taken from (1) from small to large to form a new order as
1 , , 2 , 1 ;
1 = −
≤x+ i N
xi i L (4)
An estimated true value of the population is defined as
∑
∑
= =
=
= N
j j N
j j jx N
X
1 1
01
1 ξ
ω (5)
with
N j
j x j
N
j N
i j i
i k
k
j 1 1 ; 1,2, ,
1
1 1
L
= +
−
=
∑ ∑
+ −
= − +
=
ξ (6)
where X01 is the 1st estimated true value, ωj is the weight
of the data xj, and ξj is the jth factor of the rolling mean.
The essential thinking of the rolling mean method roots in the bootstrap resampling. With the help of the resampling in sequence, the number of the data sampled each time changes and increases in the range from 1 to N, together with calculating the factor of the rolling mean. Thus the estimated true value is approaching the true value of the population step by step.
The rolling mean method belongs to the weighted average method which has the fixed weight sequence. And the closer the distance between the data xjand the
estimated true value X01 is, the larger the weight of the data xj is.
The reason to use the fixed weight sequence is due to the lack of prior knowledge of the weight in information poor system analysis.
B. Membership Function Method
The 2nd method is called the membership function method. It is based on the membership function in the fuzzy set theory.
By means of (1) and (4), define the difference sequence as
(7) )
, , , ,
( 1 2 −1
= d d di dN
d L L
with
1 , , 2 , 1 ; 0
1− ≥ = −
=x+ x i N
di i i L (8)
where diis called the difference between xi+1 and xi, the
difference value for short.
From the point of view of the possibility theory, X in (1) can be considered as an event. The smaller the difference value di is, the thicker the distribution of the
data xi is, indicating that the possibility of the event in
the interval [xi, xi+1] is likely to be large. The larger the difference value di is, the thinner the distribution of the
data xi is, indicating that the possibility of the event in
the interval [xi, xi+1] is likely to be small. That is to say, the difference value di is closely related to the
distribution density. Accordingly, define the linear membership function fi as
1 , , 2 , 1 ; 1
max
min = −
− −
= i N
d d d
f i
i L (9)
with
(10)
i N
i d
d 1
1 min min
−
= =
and
(11)
i N
i d
d 1
1 max max
−
= =
where dmin and dmax are called the minimum difference value and the maximum difference value, respectively.
Set the immediate neighbor mean series is ) , , , ,
( 1 2 −1
= z z zi zN
Z L L (12)
with
1 , , 2 , 1 ); (
2 1
1+ = −
= x+ x i N
zi i i L (13)
where zi is the ith immediate neighbor mean.
An estimated true value of the population is defined as
∑
∑
−
= −
=
= 1
1 1
1 02 1
N i
i i N
i i
z f f
X (14)
where X02 is the 2nd estimated true value.
It can be seen from (9) - (14) that the membership function method also belongs to the weighted average method which has the varying weight sequence formed by the membership function fi. And the smaller the
difference value di is, the larger the weight of the ith
immediate neighbor mean zi is.
C. Maximum Membership Grade Method
The 3rd method is called the maximum membership grade method. It is based on the principle of the maximum membership grade in the fuzzy set theory.
Via (9), let the maximum membership grade fmax be
(15) 1
max1
1
max = =
−
= j
N j f
f
Define the mean of the two data xv+1 and xv
corresponding to the maximum membership grade fmax as an estimated true value of the population, as follows:
) 1 , , 2 , 1 ( ); (
2 1
1
03= x+ +x v∈ N−
X v v L (16)
If there are T repeated maximum membership grades, let the τth mean be
1 , , 2 , 1 ; ) (
2 1
1
0 = x+ +x = T−
xτ v v τ τ L (17)
An estimated true value of the population is defined as
∑
− = −= 1
1 0 03 11
T
x T
X
τ τ
(18)
where τ stands for the position of the τth data corresponding to the maximum membership grade.
The maximum membership grade method is a special mean method, in which the mean of the several data, in general the two data, only corresponding to the minimum difference value dmin (see (10)) are used to calculate the estimated true value.
The reason for only using the several data is that they are closely concerned with the true value according to the principle of the maximum membership grade in the fuzzy set theory. The smaller the minimum difference value dmin, the better the several data conform to the true value, indicating that the relative error between the estimated true value and the true value is likely to be small. The larger the minimum difference value dmin, the worse the several data conform to the true value, indicating that the relative error between the estimated true value and the true value is likely to be large.
D. Moving Bootstrap Method
The 4th method is called the moving bootstrap method. It is an improved bootstrap method, with the feature of dynamic evaluation.
For the convenience, a data series is represented as a vector, thus (1) is written by
} , , 2 , 1 ); (
{xt t= L N =
X (19)
In (19), the sequence number t can be regarded as the time t. This has no effect on the result estimated for the true value.
In a measuring process, the problem studied with the moving bootstrap method is an estimation of the true value at the time t by means of the m data, which are close and before the time t (including the time t). And the parameter m is a very small integer. The smaller the
value of the parameter m is, the fresher the information taken from the population is. In addition, the reason that only m data are taken into account at the time t is that the estimated true value will change with time in the measuring process, in which the larger the value m is, the larger the errors estimated for the true value is. According to the bootstrap methodology, the value of the parameter m is less than or equal to N [5].
At the time t, the m data taken from the series X can
form a sub-series Xm as follows:
m t t m t m t u u xm
m={ ( )}; = − +1, − +2,L,; ≥
X (20)
where u is the time.
According to the bootstrap methodology, B simulation samples of size m, namely the bootstrap resampling samples, can be obtained by an equiprobable sampling with replacement from (20), as follows:
(21) )
, , , , , ( 1 2
Bootstrap Y Y Yb YB
Y = L L
with
B b
u yb
b ={ ( )}; =1,2,L,
Y (22)
where Yb is the bth bootstrap sample, yb(u) is the uth
bootstrap resampling sample within Yb and B is the
number of the bootstrap resampling samples. The mean of Yb is given by
∑
+ − =+ =
= t
m t u
b
mb m y u t m m N
y
1
, , 1 , ); ( 1
L (23)
Thus at the time w=t+1, a sample of size B can be obtained, as follows:
1 ;
, , 2 , 1 )}; (
{ = = +
= ymb w b B w t
mw L
X (24)
Using (24), a probability function can be obtained, as follows:
(25)
) ( m
wB wB F x
F =
According to the histogram principle in statistics, the true value at the time w can be estimated by a weighted mean, as follows:
(26)
∑
= =Q q
mq wBqx
F w X
1 04( )
where X04 (w) is the estimated true value at the time w; Q is the number of groups; q is the qth group, q=1,2,…, Q; xmq is the median of the qth group; FwBq is the value of
the bootstrap probability at the point xmq.
An estimated true value of the population is define as
∑
= + −= N
m k
k X m
N
X ( )
1 1
04
04 (27)
E. Arithmetic Mean Method
The 5th method is the arithmetic mean method. It is one of most commonly used methods for point estimation.
In this paper, the reason to use this method is that the data are generally observed in an equal weight manner and should be equally treated if the lack of prior knowledge on the probability distribution of the population. Therefore, this method is characterized by the equal weight means.
An estimated true value of the population is defined as
∑
== N
t
t x N X
1
05 1 () (28)
It is obvious that the property of the five methods above is different. Accordingly, they can be applied to mine five different kinds of feature information of the population by processing the raw data series X, laying the foundation for the fusion method for the multiple estimated true values [6-10].
IV.FUSION METHOD FOR ESTIMATED TRUE VALUE In order to evaluate the final result, the solution set X0 obtained using the five methods can be regarded as a data series. It is defined as the 0th fusion series, as follows:
(29) )
, , , , , (
) , , , , , (
0 0 02 01
0 F 0 0 F 0 0 F 02 0 F 01 0Fusion0
L l
L l
X X X X
X X
X X X
L L
L L
= =
with
X0lF0= X0l (30)
where X0lF0 is the lth fused true value calculated using the
lth method to process the raw data series X.
The 0th fusion series X0Fusion0 is fused with the help of the five methods and then a new data series, which is called the 1st fusion series X0Fusion1, is obtained, as follows:
(31) ) , , , , ,
( 01F1 02F1 0F1 0 F1 0Fusion1 X X X l X L
X = L L
where X0lF1 is the lth fused true value calculated using the
lth method to process the 0th fusion series X0Fusion0. The 1st fusion series X0Fusion1 is fused with the help of the five methods and then a new data series, which is called the 2nd fusion series X0Fusion2, is obtained, as follows:
(32) ) , , , , ,
( 01F2 02F2 0F2 0 F2
0Fusion2 X X X l X L
X = L L
where X0lF2 is the 2nd fused true value calculated using the lth method to process the 1st fusion series X0Fusion1.
In the same way mentioned above, the jth fusion series X0Fusionj is obtained, as follows:
(33)
L L
L, , , ); 1,2,
,
( 01F 0F 0 F
0Fusion = X X X j=
X j j lj Lj
where X0lFj is the jth fused true value calculated using the
lth method to process the j-1th fusion series X0Fusionj-1.
If the jth fusion series X0Fusionj is in accord with the
given rule Θ, the final estimated true value X0True is gained.
Rule 1:Define the range as
(34)
j l L l j l L l
j X X0F 1 F 0
1 min
max
=
= −
= δ
If the range δj≤ε where εis a arbitrarily small positive
number, the final estimated true value X0True is obtained by
∑
== L
l j l
X L X
1 F 0 True
0 1 (35)
This is the rule Θ. It is called the range rule and, in fact, is a convergence criterion, in which the estimated true values converge to a point, i.e., the true value.
V.EXPERIMENTAL INVESTIGATION
The experiment is done to ensure the reliability of the fusion method proposed in this paper. The main points of the plan and thought of the experiment are as follows:
1. Acquiring conventional true value
In the experiment, lots of data must be collected in order to acquire the conventional true value. These data form a data series, viz., a large sample of size NTest, which is called the testing series, denoted by XTest. Using the five methods in Table 1 to process the testing series, five estimated true values, denoted by Xm01, Xm02, Xm03,
Xm04, and Xm05, respectively, based on the large sample size, can be obtained.
According to the law of large numbers and the central limit theorem in classical statistics, each of the five estimated true values should equal or be approaching a fixed constant called the mathematical expectation Em because of the large sample sizes, i.e., the five estimated true values should be equal to each other in theory. But the difference, in fact, always appears among them due to much interference in the process of measurement and the additional uncertainty introduced by finite sampling. According to the error theory and the statistical theory, if the difference is very small, the mean of the five estimated true values based on the large sample size can be considered as approaching the mathematical expectation Em and can therefore be regarded as a conventional true value XTrue, viz., there is
True True 5
1 m0 m 5
1
A X X X
l
l = ⊆
=
∑
=
(36)
where Xm stands for the mean of the five estimated true values based on the large sample size, the mean for short, and XTrue standsfor the conventional true value.
2. Making small sample
range from 3 to 10 according to the information poor theory.
3. Calculating final estimated true value
By means of (1)-(35), the final estimated true value X0True is obtained. It is the estimation for the true value of the testing series XTest.
4. Testing estimated result
The relative error ER of estimation can be used for testing the estimated result, as follows:
% 100
True True True 0
R ×
− =
X X X
E (37)
A. Testing Series
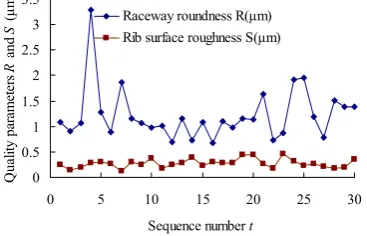
The experimental investigation deals with information of the quality parameters of the tapered roller bearing marked with 30204. As shown in Fig. 1, the manufacturing quality parameters considered are the raceway roundness and the rib surface roughness of the inner ring. Thus the two testing series are obtained in the experimental investigation, each of which has thirty data.
0 0.5 1 1.5 2 2.5 3 3.5
0 5 10 15 20 25 30
Sequence number t
Q
ua
lity
p
ara
m
ete
rs
R
and
S
(
μ
m)
Raceway roundness R(μm) Rib surface roughness S(μm)
Figure 1. Two testing series obtained in experimental investigation.
B. Conventional True Value Based on Large Sample Size As described above, the mean Xm can be employed for expressing the conventional true value XTrue under the condition of the large sample sizes. Based on this and considering the thirty data as a large sample of size NTest=30, the five estimated true values can be calculated using the five methods, respectively. The results are shown in Tables 2 and 3.
It can be seen from Table 2 that for the raceway roundness based on the large sample size, the five estimated true values take values in the range from Xm02=1.13727 μm to Xm05=1.22 μm, only with a very small difference between Xm02=1.13727 μm and
Xm05=1.22 μm (the relative error is only 0.7%). The mean of the five estimated true values in Table 2 is equal to
1.181 μm. It can be regarded as the conventional true value XTrue of the raceway roundness of the inner ring.
It can be seen from Table 3 that for the rib surface roughness based on the large sample size, the five estimated true values take values in the range from Xm02=0.26944 μm to Xm05=0.27473 μm, only with a very small difference between Xm02=0.26944 μm and
Xm05=0.27473 μm (the relative error is only 1.9%). The mean of the five estimated true values in Table 3 is equal
to 0.2719μm. It can be regarded as the conventional true value XTrue of the rib surface roughness of the inner ring.
C. Evaluation of Information of Raceway Roundness Based on Small Sample Size
From Fig. 1, choose the former 5 data (viz., a small sample of size N=5) in the testing series XTest about the raceway roundness R as the raw data series X=(1.08, 0.9, 1.06, 3.28, 1.28). Using the five methods in Table 1 to process the raw data series X, the results are shown in Table 4.
TABLE II.
ESTIMATED TRUE VALUE OF INFORMATION OF RACEWAY ROUNDNESS BASED ON LARGE SAMPLE OF SIZE NTEST=30
No. l Method Estimated true value
Xm0l(μm)
1 Rolling mean method 1.15832
2 Membership function method 1.13727 3 Maximum membership grade method 1.17
4 Moving bootstrap method (B=50000, Q=8, and m=30) 1.21972
5 Arithmetic mean method 1.22
TABLE III.
ESTIMATED TRUE VALUE OF INFORMATION OF RIB SURFACE ROUGHNESS BASED ON LARGE SAMPLE OF SIZE NTEST=30
No. l Method Estimated true value
Xm0l(μm)
1 Rolling mean method 0.27112
2 Membership function method 0.26944 3 Maximum membership grade method 0.27050
4 Moving bootstrap method (B=50000, Q=8, and m=30) 0.27374
5 Arithmetic mean method 0.27473
TABLE IV.
ESTIMATED TRUE VALUE OF INFORMATION OF RACEWAY ROUNDNESS BASED ON SMALL SAMPLE OF SIZE N=5
No. l Method Estimated true value
X0l[μm]
Relative error ER(%)
1 Rolling mean method 1.428 20.91
2 Membership function method 1.080 8.55
3 Maximum membership grade method
1.070 9.40
4 Moving bootstrap method 1.578 33.62
5 Arithmetic mean method 1.520 28.70
It is easy to see from Table 4 that the five results are different each other in numerical value. The estimated true value takes values in the range from 1.070 μm to 1.578 μm. And the minimum and the maximum of the relative errors are 8.55% and 33.62%, respectively.
According to Define 1, the solution set X0 can be formed by the estimated true value X0lin Table 4, viz.,
X0= (1.428, 1.080, 1.070, 1.578, 1.520).
0th fusion series be X0Fusion1=X0. Then using the rolling mean method to process the 0th fusion series X0Fusion0, the 1st fused true value 1.339 μm can be obtained. Using the membership function method to process the 0th fusion series X0Fusion0, the 2nd fused true value 1.346 μm can be obtained. Using the maximum membership grade method to process the 0th fusion series X0Fusion0, the 3rd fused true value 1.075 μm can be obtained. Using the moving bootstrap method (let B=50000, Q=8, and m=4) to process the 0th fusion series X0Fusion0, the 4th fused true value 1.271 μm can be obtained. Using the arithmetic mean method to process the 0th fusion series X0Fusion0, the 5th fused true value 1.335 μm can be obtained.
These five fused true values above can form the 1st fusion series X0Fusion1=(1.339, 1.346, 1.075, 1.271, 1.335). In the same way, many fusion series are obtained successively. Let ε=0.001, according to Rule 1, the final estimated true value X0True is 1.3. And the relative error is 10.08%.
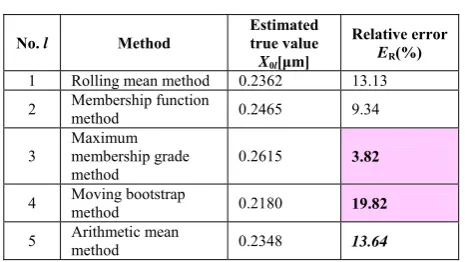
D. Evaluation of Information of Rib Surface Roughness Based on Small Sample Size
From Fig. 1, choose the former 5 data (viz., a small sample of size N=5) in the testing series XTest about the raceway roundness R as the raw data series X=(0.247, 0.148, 0.197, 0.276, 0.306).
The estimated true values of the rib surface roughness based on the small sample size are shown in Tables 5. It is easy to see from Table 5 that the five results are different each other in numerical value. The estimated true value takes values in the range from 0.2180 μm to 0.2615 μm. Let ε=0.001. According to Rule 1, the final estimated true value X0True is 0.2391 and the relative error is 12.06%.
TABLE V.
ESTIMATED TRUE VALUE OF INFORMATION OF RIB SURFACE ROUGHNESS BASED ON SMALL SAMPLE OF SIZE N=5
No. l Method
Estimated true value
X0l[μm]
Relative error
ER(%)
1 Rolling mean method 0.2362 13.13 2 Membership function method 0.2465 9.34
3
Maximum membership grade method
0.2615 3.82
4 Moving bootstrap method 0.2180 19.82
5 Arithmetic mean method 0.2348 13.64
E. Monte Carlo Simulation
A stochastic process of the uniform distribution (with the [0,1] interval) is simulated using the Monte Carlo method, then the testing series XTest is taken from the stochastic process (the number of the data in the testing series XTest is NTest=1024). Clearly, the testing series XTest conforms to the uniform distribution. According to statistics, the mathematical expectation Em of the uniform distribution is (1−0)/2=0.5 and hence the conventional true value of the testing series XTest is
XTrue=0.5. Choose the former 5 data (a small sample of size N=5) in the testing series XTest about the uniform distribution U as the raw data series X=(0.77374, 0.40697, 0.72449, 0.55777, 0.38796). The estimated true values of the uniform distribution based on the small sample size are shown in Table 6.
It is easy to see from Table 6 that the five results are different each other in numerical value. The estimated true value takes values in the range from 0.39746 to 0.58083. And the minimum and the maximum of the relative errors are 10.62% and 20.51%, respectively.
TABLE VI.
ESTIMATED TRUE VALUE OF UNIFORM DISTRIBUTION BASED ON SMALL SAMPLE OF SIZE N=5
No. l Method Estimated true value
X0l
Relative error
ER(%)
1 Rolling mean method 0.56836 13.67
2 Membership function method 0.58083 16.17
3 Maximum membership grade method
0.39746 20.51
4 Moving bootstrap method 0.55312 10.62
5 Arithmetic mean method 0.57018 14.04
Let ε=0.0005. According to Rule 1, the final estimated true value X0True is 0.55066 and the relative error is 10.13%.
Under the condition of the small sample size, the relative errors between the final estimated true value and the conventional true value take values in the range from 10.08% to 12.06%. Using the fusion method, the maximum of the relative errors is 12.06%, which is smaller than that can be produced by the other five methods.
VI.DISCUSSIONS
As described above, the fusion method proposed in this paper contains three approaches. First, for a raw data series outputted by a population, the solution set structured with different estimated truth values is obtained via different methods with different properties. Second, a chain of the fusion series composed of the fused true values is formed using different methods to process repeatedly the fusion series. Finally, the final estimated truth value is accepted according to the range rule, which is the appropriate estimation for the true value of the population. In this way, the relative error of estimation is very small. For example, in the experimental investigation on the quality parameters of the tapered roller bearing marked with 30204, the maximum of the relative errors is only 12.06%. Therefore, the result estimated using the fusion method presented in this paper is suitable for the reasonable "representative" under the condition of poor information.
raceway roundness is evaluated, indicating the statistical method is likely to be inappropriate under the condition of small sample sizes.
It is reported that the data series about the roundness and the roughness possess different probability distributions. Therefore, it will be seen from the experimental investigation that the fusion method for the estimated true value presented in this paper is always the appropriate method in evaluating the quality parameters which conform to different probability distributions.
According to Tables 2 and 3, under the condition of large sample sizes (with the thirty data in the testing series), the five results obtained using the five methods proposed in Table 1 are close to each other in numerical value. But according to Tables 4-6, under the condition of small samples (only with the five data in the raw data series X), the difference among the five results is very large. This means that the five methods in Table 1 are effective under the condition of large samples (for example as many as thirty data), but they are likely to be ineffective under the condition of small samples (for example as few as five data). Nevertheless, under the condition of the small sample size, if the five results are processed using the fusion method developed in this paper, the good results can be attained and the maximum of the relative errors between the final estimated true value and the conventional true value is only 12.06%. As a result, the fusion method for the estimated true value can be one of complements for the available statistical methods and data fusion methods in use.
In addition, when the true value is estimated under the condition of small sample sizes and unknown probability distributions, if the fusion method is utilized, the maximum of the relative errors is commonly small, but if single method is utilized, the maximum of the relative errors is commonly large.
As a result, the method for fusion of methods is good at solving the problem on both small sample sizes and unknown probability distributions, having the reliable estimated result.
VII.CONCLUSIONS
The fusion method for the multiple estimated true values allows the number of the data to be very little and the probability distribution to be unknown.
Synthetically considering the characteristics of the various methods and effectively depicting the true value from different aspects, the fusion method is able to obtain the final estimated true value which can be used as the most appropriate representative of the true value of the information poor system.
The results of the Monte Carlo simulation and of the experimental investigation on information of the quality evaluation for the tapered roller bearing indicate that the fusion method for the multiple estimated true values can be one of complements for the available statistical methods and data fusion methods in use.
ACKNOWLEDGEMENT
This work was supported in part by the National Natural Science Foundation of China (Grant No. 51075123) and the Doctoral Scientific Research Initiation Fund of Henan University of Science and Technology (Grant No. 09001318).
REFERENCES
[1] M. V. Kulikova, “Maximum likelihood estimation via the
extended covariance and combined square-root filters,” Mathematics and Computers in Simulation, vol. 79, no. 5, pp. 1641–1657, 2009, doi:10.1016/j.matcom.2008.08.004.
[2] Charlotte T. M. Kwok, Kapil Dev, Edmund G. Seebauer,
and Richard D. Braatz, “Maximum a posteriori estimation of activation energies that control silicon self-diffusion,” Automatica, vol. 44, no. 9, pp. 2241–2247, 2008, doi: 10.1016/j.automatica.2008.01.020.
[3] Z. L. Du, H. N. Wang, H. He, L.Y. Zhang, R. Li, and Y.
M. Cui, “A summary of the applications of a weighted average method determining times of solar cycle
extrema,” Advances in Space Research, vol.42, no. 9, pp.
1457–1463, 2008, doi: 10.1016/j.asr.2007.06.072.
[4] Carlos Zuppa, “Good quality point sets and error estimates
for moving least square approximations,” Applied
Numerical Mathematics, vol. 47, nos.3–4, pp. 575–585, 2003, doi:10.1016/S0168-9274(03)00091-6.
[5] X. T. Xia, X. Y. Chen, Y. Z. Zhang, and Z. Y. Wang,
“Grey bootstrap method of evaluation of uncertainty in
dynamic measurement,” Measurement, vol. 41, pp. 687–
696, 2008, doi:10.1016/j.measurement.2007.10.008.
[6] Anthony Hunter and W. R. Liu, “Fusion rules for merging
uncertain information,” Information Fusion, vol. 7, pp.
97–134, 2006, doi:10.1016/j.inffus.2005.02.006.
[7] Gail A. Carpenter, Siegfried Martens, and Ogi J. Ogas,
“Self-organizing information fusion and hierarchical knowledge discovery: a new framework using ARTMAP
neural networks,” Neural Networks, vol. 18, pp. 287–295,
2005, doi:10.1016/j.neunet.2004.12.003.
[8] J. Zhi, J. Y. Liu, and C. Q. Fu, “Damage effect assessment
of battlefield target based on multiple neural network
fusion algorithm,” Journal of Computers, vol. 5, no. 10,
pp. 1590–1596, 2010, doi:10.4304/jcp.5.10.1590-1596.
[9] X. F. Liu, X. Z. Ye, S. Y. Zhang, and F. Liu, “Regularized
least squares estimating sensitivity for self-calibrating
parallel imaging,” Journal of Computers, vol. 6, no. 5, pp.
857–864, 2011, doi:10.4304/jcp.6.5.857-864.
[10]S. J. Li, Y. L. Zhang, M. Xie, and H. Sun, “Belief
reasoning recommendation: Mashing up web information
fusion and FOAF,” Journal of Computers, vol. 5, no. 12,
pp. 1885–1892, 2010, doi:10.4304/jcp.5.12.1885-1892.
[11]X. T. Xia and T. M. Lv, “Chaos prediction of rolling
bearing friction torque,” Applied Mechanics and Materials,
vols. 26-28, pp. 190–193, 2010, doi: 10.4028/www.scientific.net/AMM.26-28.190.