ISSN (Online): 2320-9364, ISSN (Print): 2320-9356
www.ijres.org Volume 3 Issue 6 ǁ June 2015 ǁ PP.55-65
Hot Erosion Experiment on the
Blade Material of Dust Contained Gas Turbine
Huang Xinyou
1, Zheng Lingxiang
2, Sun Chen
3, Zhang Zhiying
4, Lu Jiahua*
1-4 (College of Mechanical Engineering, Shanghai University of Engineering Science, China)
*(College of Mechanical Engineering, Shanghai University of Engineering Science, China)
Abstract:
Gas turbine is the main power plant use dusty gas of high temperature and high pressure produced during the industrial processes. At the same time can effectively bring down nitrogen oxide emissions. High temperature dust gas will erode the surface of turbine blade, not only aerodynamics characteristics of the destruction (cause of affection to the blade profile) but also jeopardizes the strength of the safety blade. Therefore, erosion tests carried out on the blade material at a variety of temperature and angle of attack are very necessary to provide the basis for optimizing blade material. In simulate real conditions reveal the resistance to erosion of different materials. In this paper, erosion tests carried out on three different blade materials(1Cr12Mo、X20Cr13、2Cr12NiMo1W1V)at different angle of attack. Test temperature is 200℃ and 300℃. Experimental results showed that: Accumulate mass loss of materials studied all linearly vary according to the particle quality; 15 ° ~ 25 °, the erosion rate is the highest; 90 °angle of attack shows the lowest erosion rate; The erosion rate of material 2Cr12NiMo1W1V is higher than the other two materials at 200 ℃ and 300 ℃, poor resistance to erosion.Keywords:
erosion rate, gas-solid, gas turbine, hot erosion, turbine bladesI. Introduction
In the industrial areas of energy, metallurgy, oil, chemicals, etc, high temperature and high pressure gas dust produced during industrial processes has enormous potential, among which the gas turbine is the most
typical case. It could not only effectively bring down nitrogen oxide emissions during energy conversion processes, but also could be used as energy recycle. However high temperature dust gas in loose small particles
according to certain angle and speed eroding material surface, causing wear and tear. This impact not only aerodynamics characteristics of the destruction (cause of affection to the blade profile) but also jeopardizes the
strength of the safety blade. This phenomenon is common in electric power, machinery, iron and steel, aviation, chemical and other industries. This becomes one of the important reasons for material damage or equipment failure [1,2].
The erosion on the blade material has carried out many studies at home and abroad [3-6], but as a result of test conditions, test results is still need further argumentation and exploring stage. In this research, firstly
developed hot erosion wind tunnel system, then test three kinds of commonly used blade materials at different Angle of attack and temperatures to explore the erosion phenomenon, trying to further reveal the erosion of their features, so as to provide the basis for optimizing blade material.
II. Composition of Test Device
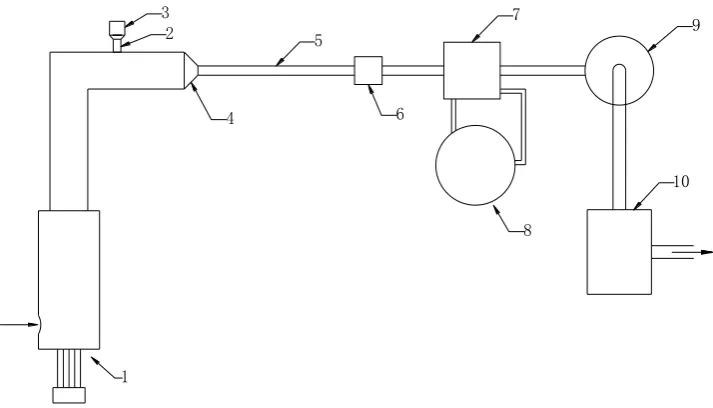
section, test section, heat exchanger, dust collector and induced draft fan. The test bench is designed as a
negative pressure system to avoid test particles cannot be well mixed with the airflow due to the atmospheric pressure inside the duct is higher than that of outside if a positive pressure system applied [7]. In positive pressure system, a bypass channel is needed to balance pressure to make the particles suffered particles into the flow channel. Negative pressure system also can ensure that the high temperature gas in wind tunnel will not leaked through the cracks, causing danger.
Firstly, erosion particles into the pipe and mixed with heated air by star-shaped feed valve. And then in the stable section particles are mixed with air and reach a steady speed. In test section, specimens are eroded. Later,
the airflow is cooled by heat exchanger, the dust particles are filtered out by dust filter. Finally, after the completion of the airflow into the air, the test is finished. The cross-sectional area of the entire experiment began
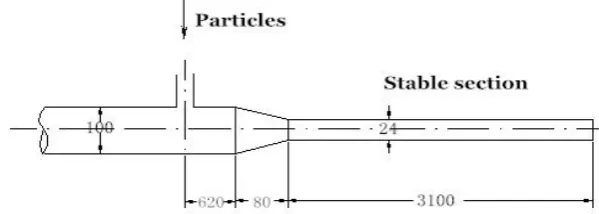
to shrink before the stable section. This is to make sure the particle stream into the test section have enough erosion speed and the contraction ratio is approximately 1: 17.36. In the stable section, pipe length to diameter ratio is 129:1, to ensure that there is sufficient distance particles mixed with the airflow, at the same temperature
with airflow and reached a steady speed.
1 2
4
5
6
7
8
9
10 3
1.Electric heater 2.Star-shaped feed valve 3.Particle hopper 4.Convergent nozzle 5.Stable section
6.Test section 7.Heat exchanger 8.Cooling water tank 9.Dust filter 10.Induced draft fan Fig. 2-1 Erosion test wind tunnel system schematic diagram
Wind tunnel use electric heater for heating, and temperature is controlled by automatic control device.
Electric heater has rapid heating and cooling rate, high efficiency, good mechanical, high security, air clean pollution-free, etc. Wind tunnel using the star-shaped feed valve adding particles to the pipe, particles down to
the airflow only by its own gravity, ensure uniform particle concentration. Test section of the specimen clamp can rotate 360 degrees, to realize stepless attack angle.
There are thirteen temperature sensors, pressure transmitter ten, a flow meter, a pressure gauge and an
anemometer in the wind tunnel system to collect experimental data, signal acquisition, processing and storage by computer. The Star-shaped feed valve adjustable speed (control particles flow rate) and the angle of attack to
show experimental conditions simultaneously displayed.
III. The Test Scheme
modes. Generally, it is called ductility erosion if the erosion sand is micro cutting, shovels and other plastic
deformation of the material loss. Plastic materials generally have this feature. If the loss is the micro-cracks caused by the impact of stress and extends along the crack caused by the process, it belongs to brittle erosion.
Most brittle metals, ceramics, carbides, oxides, etc. have this feature.
Ductility erosion was first proposed by scholars Finnie, when he pointed out that more high-speed impact surface angular grit, sand protruding corner edge cutting tool will approach the material loss caused by erosion,
strength and impact angle of the erosion, sandy, sand between target shape and nature are closely related. In this research, brittle and plastic characteristics of blade material can be judged by the conclusion.
3.1 Selection of Test Materials
In this test, there are three different steel are tested. No. for them are 1Cr12Mo, X20Cr13 and 2Cr12NiMo1W. The main characteristics are shown in Table 3-1.
Table 3-1 Main parameters of the substrate steel
No. Steel brand Main ingredients Application
1 1Cr12Mo
Cr 11.5-13.0 Mo 0.3-0.6
Ni 0.3-0.6 Si<0.5 Cu<0.3 C 0.1-0.15 P<0.04 S<0.03
It’s very commonly used as blades of gas turbine, compressor guide vanes material,
with high strength, corrosion resistance, high temperature, and good process
characteristics.
2 X20Cr13 C 0.16-0.25 Si<1 Mn<1 Cr 12-14 S<0.03 P<0.04
It’s a blade steel of turbine imported from Germany's Siemens, Belong to the
martensitic stainless steel.
3 2Cr12NiMo1W1V
Cr 11-12.5 Mo 0.9-1.25
W0.9-1.25 Ni0.5-1 Si<0.5 Mn0.5-1 Ni0.5-1 C0.2-0.25
It is used for blade, shroud, bolts, valve
stem and so on.
3.2 Selection of Particles
In this test, the test particle selected is quartz sand. Due to coal-bearing is the main working medium of the gas-solid turbine. Table 3-2 is the analysis to the composition of coal mine in West Virginia Kingston, US [8]. Among which the main component is SiO2, so we select quartz sand particles as grains tested representative.
The microscopic observation shows that the appearances of quartz sand are polyhedral particles similar to the
coal-bearing. The diameter of quartz sand is 0.074 mm in this experiment.
Table 3-2 Composition of coal mine in West Virginia Kingston, US [8]
Compound SiO2 Al2O3 Fe2O3 TiO2 CaO MgO Na2O K2O SO3 Undetermined Total
Percentage 54.39 28.58 10.08 0.47 1.28 1.04 0.20 2.09 1.03 0.84 100
3.3 Estimation of Particle Velocity
Among the estimates, assuming that the particles are spherical in shape, and only consider Stokes drag speed
slip between the particles and the gas caused. Under the condition of low particle concentration, ignore collisions between particles and energy transport between particles and gas (one-way coupling). Based on
multiphase fluid dynamics knowledge [9], one dimensional particle momentum equation is obtained:
)
(Re
)
(
p p p g pf
t
v
v
dt
dv
3-1In the formula,
t
pis particle relaxation time;v
p is particle velocity;v
gis gas velocity;Re
pisParticles Reynolds;
f
(Re
p)
is higher Reynolds number, the correction formula of drag coefficient. Respectively for: g p p pd
t
18
2
3-2 g p g p g pv
v
d
Re
3-3)
Re
6
1
1
(
)
(Re
3 2 p pf
3-4
Rewritten formula 3-1 into expression of spatial coordinates:
)
Re
6
1
1
(
)
(
)
(
3 2 p p p p g pt
v
x
v
x
v
dx
dv
3-5In the formula, X represents the flow direction of particles in the wind tunnel.
Fig. 3-1 Simplified schematic of the particle flow channel
Table 3-3 Particle velocity estimation at the outlet of accelerating straight pipe
Particle type Particle size Dp(mm)
Gas velocity
g
v
(m/s)Particle velocity
p
v
(m/s)v
p/v
gQuartz sand 0.074 139 79 0.57 Quartz sand 0.038 139 81 0.58 Quartz sand 0.074 105 62 0.59
Quartz sand 0.038 110 63 0.60
3.4
Effective range of uniform gas-solid flow
There is a great relationship between mass loss of specimen and particle flow rate uniformity. If the erosion area is too big, particles left nozzle assumes the diffusivity will lead to the edge of the specimen by erosion (that is mass loss of specimen) assumes the attenuation distribution. However, the erosion area is too small, require
balance a high accuracy to measure the mass loss of specimen. Two cases of the experimental results can not accurately reflect the erosion characteristics of material. Therefore to determine the area of particle distribution
uniformity is particularly important.
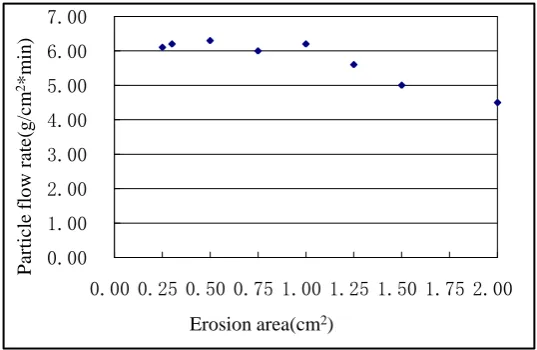
Fig. 3-2 Relationship between particle flow rate uniformity and erosion area
This test bench, nozzle diameter is 2.4 cm, specimens from the nozzle 7 cm. After calibration, particle flow rate uniformity change with erosion area as shown in Fig. 3-2. The figure shows that erosion area in the
range of 1 square centimeters, the particle flow rate is basically constant, but after the erosion area is more than 1 square centimeters, flow rate decreases with the increasing area. Comprehensive above factors, the specimen erosion area is 1.5 cm diameter circular (area is 1.76 cm2 ). To make erosion experiment results comparable, calculate the erosion rate divided by area is the erosion rate per unit area.
0.00 1.00 2.00 3.00 4.00 5.00 6.00 7.00
0.00 0.25 0.50 0.75 1.00 1.25 1.50 1.75 2.00
P
ar
ticle
flo
w
r
ate
(g
/cm
2*
m
in
)
3.5 Relative Quality of Particles and Relative Mass Loss of Specimen
Fig. 3-3 Location diagram of test piece
As shown in Fig. 3-3, when the specimen fixture adjustment to the angle of attack is less than 90°the projection area in the vertical plan of the erosive area of specimens is reduced. The decrease in the number of particles that
the actual erosion to the specimen. The mass loss of material is not comparable. There are two ways to solve this contradiction:
The first one is the conception of relative quality of particles [10]. Refer to figure 3-2, when the Angle of attack is 90°and the quality of particles is M g, however when the Angle of attack is
degree the quality ofthe particles actually impact onto the specimen is only
M
sin
g. So,when the angle of attack is 90°and the quality of particles in each test is M g, the quality of particles at the other Angle of attack should beM/ sin
g.
The second one is the conception of relative mass loss of specimen [10]. Scilicet, when the Angle of attack is less than 90°, each test does not increase the quality of particles, but will be reduced mass loss of specimen. When the Angle of attack is
degree and the mass loss of specimen is N g that the relative gravity ofspecimen is
N / sin
g. Scilicet, CompareN / sin
with the mass loss of specimen when the Angle of attack is 90°.The method of this experiment is relative gravity of specimen. Its advantage is that use less grain quality
and less test time. Different angles of erosion test finished at the same time have a higher comparability.
3.6 Calculating Erosion Rate
Firstly, clean the processed specimens with ultrasonic cleaning machine in acetone solution. Secondly, measuring the initial specimen quality in electronic balance which precision is 0.01mg after dying, denoted as
0
M
.Thirdly, put the test specimen into specimen clamp which can rotate 360 degrees. Fourthly, choose anangle between 0°and 90°and then do the erosion test. Fifthly, each completed an erosion test, repeat the cleaning,
drying, weighing process. Measuring the specimen quality in electronic balance, denoted as
M
1.Mass loss of specimen:
m=
M
0
M
1 3-6Relative Mass loss:
X=
m
sin
3-7
Angle of attack
Mass loss of specimen per unit area:
1
Y
X
S
3-8
In the formula,
is the angle of attack,S
1 is the erosive area of specimen.The analysis on the result of the erosion of the specimens test particles mainly reflected in the change of
specimen quality before and after erosion as well as the ratio of the changes and erosion particle quality, and the ratio is defined as the erosion rate:
Mass loss of specimen per unit area
Erosion rate
=
Quality of particles M
(
Y
)
( Z)
(
)
3-9IV. Test Results and Analysis
In order to guarantee the reliability of the test data and explore the relationship between the mass loss of
specimen and the accumulate quality of particles, at the same time. In every angle of attack accumulated for six tests under the same conditions. After each test, measure the quality of specimen and records, calculated the
mass loss of specimen per unit area. Data smoothing and least squares fitting are studied and used to modify the test data.
4. 1 Accumulate Particle Quality Impact on Mass Loss of Specimen
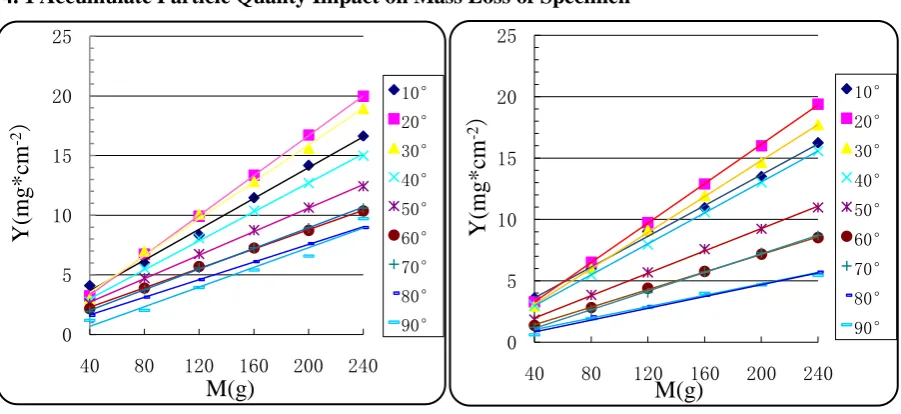
Fig. 4-1 Accumulate mass loss of Fig. 4-2 Accumulate mass loss of material 1Cr12Mo at 200 ℃ material 1Cr12Mo at 300 ℃ 0
5 10 15 20 25
40 80 120 160 200 240
Y(
mg
*c
m
-2
)
M(g)
10° 20° 30° 40° 50° 60° 70° 80° 90°
0 5 10 15 20 25
40 80 120 160 200 240
Y(
mg
*c
m
-2
)
M(g)
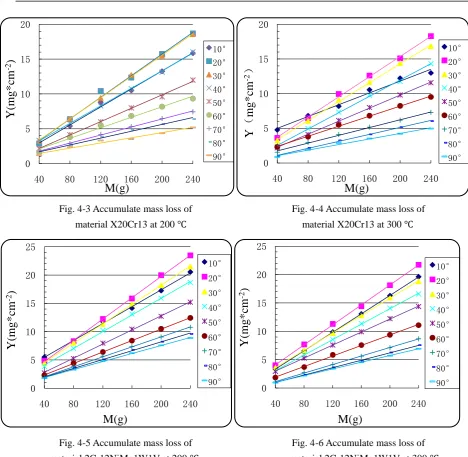
Fig. 4-3 Accumulate mass loss of Fig. 4-4 Accumulate mass loss of
material X20Cr13 at 200 ℃ material X20Cr13 at 300 ℃
Fig. 4-5 Accumulate mass loss of Fig. 4-6 Accumulate mass loss of
material 2Cr12NiMo1W1V at 200 ℃ material 2Cr12NiMo1W1V at 300 ℃
Fig.4-1 to Fig. 4-6 shows that the three kinds of materials under test conditions, there is linear relationship between accumulate mass loss of specimen and the quality of particles. The mass loss of specimen is most at 20°the angle of attack. Mass loss of specimen is least at 90°. Usually first mass loss of specimen is more
significant, the main reason is the loose material on surface are more likely to be erosion. Another reason is at the particle erosion process, the hard particle has cold work hardening on the surface of the specimen like a
cutting tool that improved the erosion resistance of the specimen.
Not only reflects the relationship between mass loss and particle mass, but also based on this linear relationship, it is possible to measure the relationship between accumulate mass loss and time. It is also possible
to implanted a change factor into predict the blade natural frequency of vibration changes, thus explore the influence factors of blade life more objectively.
4.2 Influence of Temperature on Erosion Rate
05 10 15 20
40 80 120 160 200 240
Y(
mg
*c
m
-2)
M(g)
10° 20° 30° 40° 50° 60° 70° 80° 90° 0 5 10 15 2040 80 120 160 200 240
Y
(
mg
*c
m
-2)
M(g)
10° 20° 30° 40° 50° 60° 70° 80° 90° 0 5 10 15 20 2540 80 120 160 200 240
Y(
mg
*c
m
-2)
M(g)
10° 20° 30° 40° 50° 60° 70° 80° 90° 0 5 10 15 20 2540 80 120 160 200 240
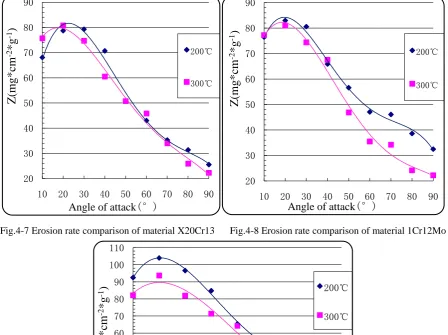
Fig.4-7 Erosion rate comparison of material X20Cr13 Fig.4-8 Erosion rate comparison of material 1Cr12Mo
Fig. 4-9 Erosion rate comparison of material 2Cr12NiMo1W1V
Fig. 4-7 to Fig. 4-9 shows that the maximum erosion rate appeared between 15 ° and 25 ° the minimum erosion rate at 90 ° angle of attack. The influence of temperature change on the mass loss of material X20Cr13 is
minimal. The most influence is on material 2Cr12NiMo1W1V. The erosion rate of three kinds of materials at 300℃ is higher than that at 200 ℃. This phenomenon has certain rationality, because existing studies have shown
that the erosion rate of plastic material along with the change of temperature in general can be divided into three categories [11]:(1) Erosion rate decreases with temperature increase and then increases with temperature rise when achieve the minimum. (2) Below the threshold temperature erosion rate were similar, after more than the
temperature, erosion rate increases with temperature increase rapidly. (3)Erosion rate always increases with temperature rise. In this experiment proved that the first kind of phenomenon under the condition of the test, and
at what temperature erosion rate will appear the opposite trend change, need more test to verify.
4.3 Erosion Rate Comparison of Different Materials
2030 40 50 60 70 80 90
10 20 30 40 50 60 70 80 90
Z
(mg
*
cm
-2
*
g
-1
)
Angle of attack
(°)
200℃
300℃
20 30 40 50 60 70 80 90
10 20 30 40 50 60 70 80 90
Z
(mg
*
cm
-2
*
g
-1
)
Angle of attack
(°)
200℃
300℃
20 30 40 50 60 70 80 90 100 110
10 20 30 40 50 60 70 80 90
Z
(mg
*
cm
-2
*
g
-1
)
Angle of attack
(°)
200℃
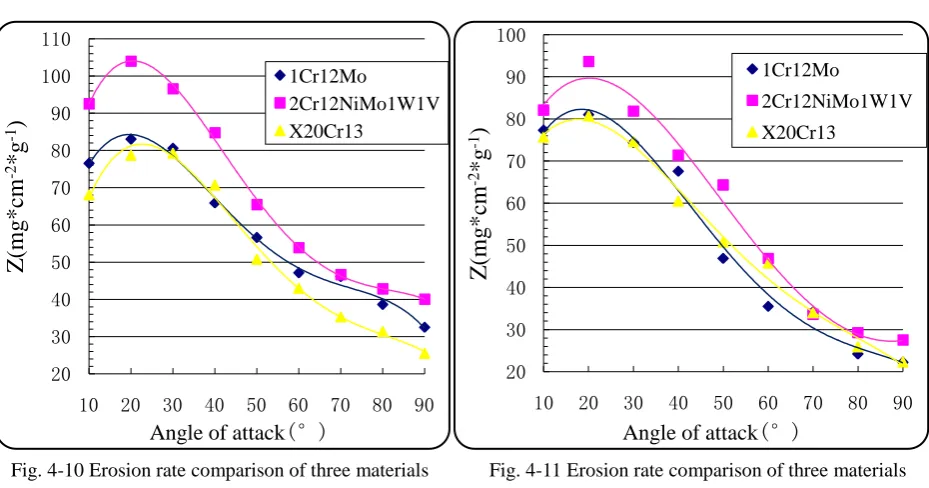
Fig. 4-10 Erosion rate comparison of three materials Fig. 4-11 Erosion rate comparison of three materials
at 200℃ at 300℃
Fig.4-10 and Fig. 4-11 shows that the erosion rate of material 2Cr12NiMo1W1V is higher than the other two
materials at 200 ℃ and 300 ℃, poor resistance to erosion. The erosion rate of material 1Cr12Mo is higher than X20Cr13 at small angle of attack but lower at big angle of attack. This provides assistance to gas turbine blade
materials selection under the experimental conditions.
V. Conclusion
In his research first developed hot erosion wind tunnel system, then test three kinds of commonly used blade materials(1Cr12Mo、X20Cr13、2Cr12NiMo1W1V)at different Angle of attack and temperature, to
explore the erosion of their features. The following conclusions: (1) There is linear relationship between accumulate mass loss of specimen and the quality of particles at the different angle of attack and temperature. (2) The maximum erosion rate appeared between 15 ° and 25 ° the minimum erosion rate at 90 ° angle of attack. (3)
The erosion rate of material 2Cr12NiMo1W1V is higher than the other two materials at 200 ℃ and 300 ℃, poor resistance to erosion. (4) Erosion rate decreases with temperature increase under the condition of test
temperature. At what temperature erosion rate will appear the opposite trend change, need more test to verify.
References
[1] Allen C, Ball A, A review of the perfomance of engineering materials under prevalent tribological and wear situations in South
Africa industries, Tribo Inter,1996,(29):105-116.
[2] Ma Ying, Ren Jun, Li Yuandong, Research Progress of Erosion, Journal of Lanzhou University of Technology,2005,31(1):21-25.
[3] Shun-sen Wang, Guan-wei Liu, Jing-ru Mao, Effects of Coating Thickness, Test Temperature, and Coating Hardness on the
Erosion Resistance of Steam Turbine Blades, Journal of Engineering for Gas Turbines and Power. 2010,2.
[4] Zhao Xianping, Sun Rongjian, Experimental Research of 15CrMo Alloy Steel’s Erosion Resistance at Constant and
HighTemperature, Shanghai Electric Power College Journal,2006,22(1).
[5] Tabakoff, W., and Shanov, V., Erosion Rate Testing at High Temperature for Turbomachinery Use, Surf. Coat. Technol.,
76–77(1–3):75–80.
[6] Wang, S. S., Liu, G. W., Mao, J. R., and Feng, Z. P., 2007, Experimental Investigation on the Solid Particle Erosion in the Control
Stage Nozzles of Steam Turbine, Proceedings of the ASME Turbo Expo 2007, Vol. 6:713–721. 20
30 40 50 60 70 80 90 100 110
10 20 30 40 50 60 70 80 90
Z
(mg
*
cm
-2
*
g
-1
)
Angle of attack
(°)
1Cr12Mo
2Cr12NiMo1W1V X20Cr13
20 30 40 50 60 70 80 90 100
10 20 30 40 50 60 70 80 90
Z
(mg
*
cm
-2
*
g
-1
)
Angle of attack
(°)
1Cr12Mo
2Cr12NiMo1W1V
[7] Lu Jiahua, Ling Zhiguang, The Gas-solid Two-phase Turbine Blade Erosion Characteristics of the Pneumatic Test Research, Fluid
Mechanics Experiment and Measurement,2003,2.
[8] Tabakoff, W, Metwally, M., Coating effect on particle trajectories and turbine blade erosion, J. of Eng. for Gas Turbines and
Power. 1992, 114(2): 250~ 257.
[9] Shu Chaohui, Wu Keqi, Advanced Fluid Mechanics,China electric power press,2009.
[10] Lu Jiahua, The Viscous Flow Field of Turbine Blade Erosion Numerical Simulation and Experimental Research,Ph.D. Thesis.,
Shanghai University of Science and Technology, 2002.
[11] Nahum Gat, Widen Tabakoff, Some effects of temperature on the erosion of metals, Wear,1978, 50(1):85–94.
Fund project:Shanghai municipal education commission 085 engineering projects (JR0901)
Author: Huang Xinyou(1989-), male, Qingdao China, master, The main research direction is the turbine thermal state aerodynamic experiment. Tel: 18201751263; E-mail:[email protected]
Corresponding author: Lu Jiahua(1960-), male, Shanghai China, doctor, The main research direction is
![Table 3-2 Composition of coal mine in West Virginia Kingston, US [8]](https://thumb-us.123doks.com/thumbv2/123dok_us/7798336.1659825/3.595.65.527.301.494/table-composition-coal-west-virginia-kingston.webp)