ISSN (e): 2250-3021, ISSN (p): 2278-8719
Vol. 09, Issue 1 (January. 2019), ||V (I) || PP 33-37
Comparison of Continuous Probability Distribution and Robust
Mean in WSN Data Aggregation
M.Lakshmi
1, Dr P.Velmani
2, Dr P.Arockia Jansi Rani
3Research Scholar (Part time Internal) Register No: 11964 Department of Computer Science & Engg , Manonmaniam Sundaranar University, Abishekapatti, Tirunelveli-627012,Tamil Nadu, India1. Assistant Professor of Computer Science, The M.D.T Hindu College, Pettai, Tirunelveli, TamilNadu, India2.
Associate Professor of Computer Science & Engg , Manonmaniam Sundaranar University, Abishekapatti, Tirunelveli-627012,Tamil Nadu, India3
Corresponding Author:M.Lakshmi
ABSTRACT: The Environment Pollution Index reveals a tension between two fundamental dimensions of sustainable development: environmental health, which rises with economic growth and prosperity, and ecosystem vitality, which comes under strain from industrialization and urbanization. Good governance emerges as the critical factor required balancing these distinct dimensions of sustainability. Air quality remains the leading environmental threat to public health. In 2016 the Institute for Health Metrics and Evaluation estimated that diseases related to airborne pollutants contributed to two-thirds of all life-years lost to environmentally related deaths and disabilities. Air pollution issues are especially acute in rapidly urbanizing and industrializing nations such as India and China. One of the method developed for the assessment of environmental consequences is Comprehensive Environmental Pollution Index (CEPI). A major problem for constructing the CEPI is the determination of an appropriate aggregation method to combine multi-dimensional environmental variables in to an overall index. Probability distribution has an easy application and widespread use. The main aim of this paper is to apply and analyses the Continuous Probability Distribution methods namely Uniform, Normal, Exponential in aggregation of pollution monitoring data with the consideration of data accuracy and usefulness of data.
Keywords: Continuous Probability Distribution Methods, Robust mean, WSN data aggregation
--- --- Date of Submission: 18-12-2018 Date of acceptance: 03-01-2019 ---
---I.
INTRODUCTION
A distinguishing characteristic of the probabilistic analysis approach is the ability to perform precise quantitative analysis of probabilistic systems. Any variable can have two types of values. Either the values can be fix numbers which are also known as discrete values or a specified range that is known as continuous values. Based upon these types of values a data set is defined as continuous or discrete. Continuous probability distribution can be a good approximation of many real world processes and phenomena. In continuous data type, the values can be lying anywhere within the range that is specified. The probability of a continuous variable will take a specific value is equal to zero. Because of this, never express continuous probability distribution in a tabular form. Thus we require an equation or a formula to describe such kind of distribution. Such equation is termed as probability density function. [1] A probability density function is defined such that the likelihood of a value of X between a and b equals the integral (area under the curve) between a and b. This probability is always positive. [2] A probability distribution is a statistical model that shows the possible outcomes of a particular event or course of action as well as the statistical likelihood of each event. [3] This paper attempts to apply three of the Continuous Probability Distribution functions namely Uniform, Normal, Exponential to analyze aggregation in air pollution data. The rest of the paper is organized as follows: Section II presents the literature survey, Section III describes the category of air quality, Section IV discusses Uniform, Normal, Exponential distribution descriptions, Section V illustrate simulation study and Section VI concludes the paper.
II.
LITERATURE SURVEY
distribution theory stresses on problem-solving faced by the practitioners and applied researchers and proposes a variety of models so that lifetime data set can be better assessed and investigated in different fields. In other words, there is a strong need to introduce useful models for better exploration of the real-life phenomenon. Nowadays, the trends and practices in defining probability models totally differ in comparison to the models suggested before 1997. One main objective for proposing, extending or generalizing (models or their classes) is to explain how the lifetime phenomenon arises in fields like physics, computer science, insurance, public health, medical, engineering, biology, industry, communications, life-testing and many others. [5]Continuous probability distributions are widely used to mathematically describes a significant step towards the development of formal probabilistic analysis method.[6] Ambient air quality monitoring sites generally falls into the following categories such asdetermine the highest concentration expected to occur in the area covered by the network, determine typical concentration in areas of high population density, determine the impact on ambient pollution levels from significant sources , determine the general background concentration levels, measure the air pollution impacts on visibility, vegetation damage, or other welfare based effects.[7] Low Energy Adaptive Clustering Hierarchy (LEACH) is a self organizing adaptive clustering protocol that uses randomization to distribute the energy load evenly among the sensors in the network.[8] Concept of clustering has used by Leach protocol enforces less communication between sensor nodes and the Base Station, which increases the network lifetime.[9]
III.
ACCURATE AIR QUALITY ANALYSIS
Air Quality Index Summary Report displays an annual summary of Air Quality Index (AQI) values for countries or Core Based Statistical Areas (CBSA). To compute accurate air quality, AQI with all pollutant in a geographic area is to be measured.
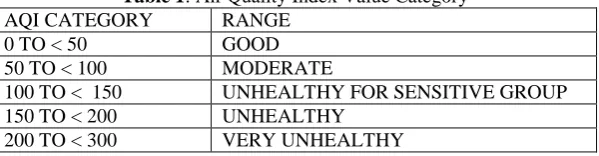
Table 1: Air Quality Index Value Category AQI CATEGORY RANGE
0 TO < 50 GOOD 50 TO < 100 MODERATE
100 TO < 150 UNHEALTHY FOR SENSITIVE GROUP 150 TO < 200 UNHEALTHY
200 TO < 300 VERY UNHEALTHY
Table (1) shows the AQI category and the corresponding air quality values in, parts per million (ppm) or parts per billion (ppb). The point to be considered here is the proper aggregation method to be used in industrial pollution monitoring. Mostly industries are sending average of air pollution data to the State Pollution Control Board. (Tamil Nadu Pollution Control Board).This may lead to the false analysis.
IV.
DESCRIPTIONS OF DISTRIBUTIONS
Normal distribution
The normal probability distribution is one of the fundamental continuous distributions of statistics. It is actually a family of distributions (an infinite number of distributions with differing means (μ) and standard deviations (σ). Because the normal distribution is a continuous distribution, we cannot calculate exact probability for an outcome, but instead we calculate a probability for a range of outcomes. [10][11]
Uniform distribution
The continuous uniform distribution or rectangular distribution is a family of symmetric probability distributions such that for each member of the family, all intervals of the same length on the distribution's support are equally probable. The support is defined by the two parameters, a and b, which are its minimum and maximum values. [12]
Exponential Distribution
which is in a statistical sense. The exponential distribution is the only continuous distribution and it is used in survival analysis. [14]
V.
SIMULATION STUDY
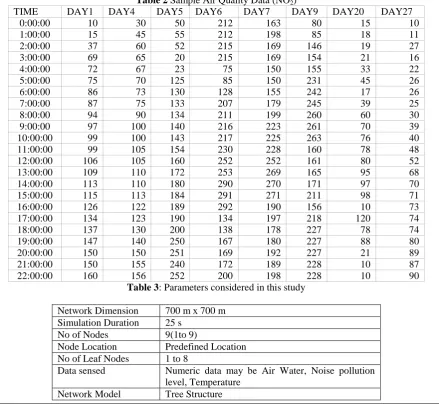
More than 660 million Indians are living in areas that exceed in the country’s standard for what is considered safe exposure to fine particulate pollution (PM 2.5).To improve India, air quality researchers from the University of Chicago and Harvard Kennedy School have laid out five key evidence based policy recommendation in a new report. The group recommendations include improving emissions monitoring by better aligning incentives of auditors providing regularities with real time data on pollutions emissions, etc. [15] From this report it is evident that still there is a problem in air pollution monitoring and reporting mechanism. [16] To improve air quality monitoring standard most of the large scale industries and state, central pollution control boards are having high quality sensors. But the problem is in reporting and analyzing mechanism of air quality data. The alternative to the mostly available statistics like total and average is need of the hour to prevent and take precautionary actions. This section presents the performance of various probability distributions by providing numerical illustration of air pollution data. For the given data set estimates the value of scale and location parameter under various method of distribution is computed by using NS2. Table (2) shows independent measurement of an Air Quality Index data obtained from UCI Repository. [17]
Table 2 Sample Air Quality Data (NO2)
TIME DAY1 DAY4 DAY5 DAY6 DAY7 DAY9 DAY20 DAY27
0:00:00 10 30 50 212 163 80 15 10
1:00:00 15 45 55 212 198 85 18 11
2:00:00 37 60 52 215 169 146 19 27
3:00:00 69 65 20 215 169 154 21 16
4:00:00 72 67 23 75 150 155 33 22
5:00:00 75 70 125 85 150 231 45 26
6:00:00 86 73 130 128 155 242 17 26 7:00:00 87 75 133 207 179 245 39 25 8:00:00 94 90 134 211 199 260 60 30 9:00:00 97 100 140 216 223 261 70 39 10:00:00 99 100 143 217 225 263 76 40 11:00:00 99 105 154 230 228 160 78 48 12:00:00 106 105 160 252 252 161 80 52 13:00:00 109 110 172 253 269 165 95 68 14:00:00 113 110 180 290 270 171 97 70 15:00:00 115 113 184 291 271 211 98 71 16:00:00 126 122 189 292 190 156 10 73 17:00:00 134 123 190 134 197 218 120 74 18:00:00 137 130 200 138 178 227 78 74 19:00:00 147 140 250 167 180 227 88 80 20:00:00 150 150 251 169 192 227 21 89 21:00:00 150 155 240 172 189 228 10 87 22:00:00 160 156 252 200 198 228 10 90
Table 3: Parameters considered in this study
Network Dimension 700 m x 700 m Simulation Duration 25 s
No of Nodes 9(1to 9)
Node Location Predefined Location No of Leaf Nodes 1 to 8
Data sensed Numeric data may be Air Water, Noise pollution level, Temperature
Protocol Used Destination Sequenced Distance Vector Routing Protocol
Table (3) shows the WSN setup parameters used in this study. The 23 values are assigned to each node to signify the pollutant values of a day in one hour duration. To supply pollution data for 8 days 8 leaf nodes are created and values are passed through that.
Table 4: Comparisons of Uniform, Normal, Exponential Distributions
Distributions/Days Day1 Day4 Day5 Day6 Day7 Day9 Day20 Day27 UNIFORM 160
(UH) 156 (UH) 252 (VUH) 292 (VUH) 271 (VUH) 263 (VUH) 120 (US) 90 (M)
NORMAL 99
(M) 100 (M) 154 (UH) 200 (UH) 199 (UH) 211 (VUH) 45 (G) 48 (G) EXPONENTIAL 10
(G) 30 (G) 20 (G) 75 (M) 150 (US) 80 (M) 10 (G) 10 (G)
Table 5: Comparisons of Mean, Trimmed Mean (20%), Winsorised Mean(20%)
Estimators/Days Day1 Day4 Day5 Day6 Day7 Day9 Day20 Day27 Mean 99.43
(M) 99.73 (M) 149.0 (US) 199.17 (UH) 199.73 (UH) 195.69 (UH) 49.916 (G) 49.913 (G) Trimmed Mean
20% 103.26 (US) 99.53 (M) 152.59 (UH) 202.19 (VUH) 194.26 (UH) 200.46 (VUH) 49.53 (G) 49.53 (G) Winsorized Mean
20% 103.69 (US) 99.17 (M) 143.86 (US) 199.69 (UH) 195.73 (UH) 199.78 (UH) 50.56 (M) 49.52 (G)
Table (4) shows the result obtained by applying Uniform, normal and Exponential distribution in the air pollution data of Table (2). Table (5) shows the result obtained from our previous work [18] by applying Mean, Trimmed Mean (20%) and Winsorized Mean (20%) using the same data. To analyze most pollutant data, robust estimators namely Trimmed Mean (20%) and Winsorized Mean (20%) may produce better prediction when compared to three continuous distribution categories uniform, normal and Exponential.
VI.
CONCLUSION
To improve air quality monitoring standard most of the large scale industries and state, central pollution control boards are having the high quality sensors. But the problem is in reporting and analyzing mechanism of air quality data. The alternative to the mostly available and easy to compute statistics like total and average is need of the hour to prevent and take precautionary actions. This paper analyzes the performance of two robust estimators and three continuous distribution functions, with numerical illustrations carried out by using NS2 simulator. The results are compared with mostly available aggregation function Mean. It is concluded that two robust estimators are not affected and provide the better results when outliers are present in the data. The next work is to apply robust estimators in energy efficient LEACH Protocol that may be used for data aggregation in WSN. So many variations of leach are available with specific advantage. The main aim of the proposed algorithm is to design improved LEACH in terms of data accuracy and usefulness of data.
REFERENCES
[1]. https://stattrek.com/probability-distributions/discrete-continuous.aspx?tutorial=prob [2]. https://sites.nicholas.duke.edu/statsreview/continuous-probability-distributions/.
[3]. https://smallbusiness.chron.com/role-probability-distribution-business-management-26268.html.
[4]. Families of distributions arising from the quantile of generalized lambda distribution”Mahmoud Aldeni Email authorView ORCID ID profile, Carl Lee and Felix Famoye Journal of Statistical Distributions and Applications20174:25
[5]. Compounding of distributions: a survey and new generalized classes Muhammad H Tahir Email authorView ORCID ID profile and Gauss M. Cordeiro Journal of Statistical Distributions and Applications20163:13
[6]. Formalization of Continuous Probability Distributions Osman Hasan and Sofiene Tahar F.Pfenning(Ed): CADE 2007, LNAI 4603, pp.3-18, 2007.Springer-verlag Berlin Heidelberg 2007.
[7]. Quality assessment and statistical Analysis of Air monitoring Data Chapter 13 Revision No 12, December 31, 2017).
[9]. A Survey on successors of Leach Protocol Sunil Kumar singh,(Student Member ,IEEE), Prabhat Kumar,(Member,IEEE),And Jyoti Prakash Singh,(Senior Member,IEEE).IEEE Access Multidisciplinary Rapid Review Open Access Journal Volume 5,2017
[10]. https://sites.nicholas.duke.edu/statsreview/continuous-probability-distributions/
[11]. http://www.r-tutor.com/elementary-statistics/probability-distributions/continuous-uniform-distribution [12]. https://en.wikipedia.org/wiki/Uniform_distribution_(continuous)
[13]. https://en.wikipedia.org/wiki/Exponential_distribution
[14]. http://www.math.wm.edu/Nleemis/chart/UDR/PDFS/Exponential.Pdf [15]. (A Roadmap towards cleaning India's Air Aug ,20,2018).
[16]. https:www.bbc.co.UK/news/world-asia-India-41925067 Sep 2018. [17]. http://www.epa.gov/outdoor-air-quality-data/air-quality-index-report
[18]. M.Lakshmi,P.Velmani,P.Arockia Jansi Rani “Data Aggregation in WSN Using Robust Mean”International Journal of Research in Advent Technology,Vol.6,No.10,October 2018