ISSN (e): 2250-3021, ISSN (p): 2278-8719
Vol. 08, Issue 7 (July. 2018), ||V (I) || PP 22-30
Analysis of the Use of Solar Energy in the Design of Zero Energy
Buildings
SoheylMalekpourKolbadinezhad
1, Mona Sadeghian
2, Fardin Ahm
adi3 1(Department architectural, University Of Marlik,Iran)
2(Departmentarchitectural, University Of Gilan, Iran) 3(Departmentarchitectural, University Payam Noor Tehran, Iran)
Abstract: The purpose of this paper is to analyze the use of solar energy in the design of zero energy buildings. This study examines the feasibility of applying net zero – energy solar building geometries, is determined the size of solar Collector systems to meet all the annual energy requirements. The effect of household Cover changes, residents behavior and the efficiency of household appliances is analyzed and the final energy demand and the size of the net zero energy building system. After finding the size set of solar thermal (st) system and solar photovoltaic (PV), an analytical work will be done to identify the best configuration of the system from the perspective of financial and environmental issues. The results of the study showed that the proposed scheme has a very high potential for financially net zero energy buildings.
Keywords: zero energy, solar energy, photovoltaic, thermal system.
---
Date of Submission: 21-06-2018 Date of acceptance: 05-07-2018
---
I.
INTRODUCTION
Energy consumption in buildings represents about 40% of final energy consumption, to achieve a zero energy balance at the annual level, energy savings and energy efficiency measures should be fully utilized. However, demand for active heating and cooling remains in most buildings and under climatic conditions. A zero energy building can be independent or depended to the electricity’s net. As Mr .Vos (2008) and Marsezal and Colleagues (2011) have discussed, with current technology, the implementation of a zero- energy building apart from the net is difficult both from the economic and technical perspective, due to the seasonal mismatch between renewable energy supply and demand. In the off-grid method, the renewable energy accumulated in the summer, is wasted and cannot be used to balance needs during the winter. A zero- energy building with a net does not need to store energy in the area, any surplus production is injected into the net, and in return, when the production is not enough, the building receives the required amount of electricity from the net (1). This net- connected method for energy exchange is called net zero energy building (NZEB): according to an annual look at the building there is no need for any energy in puts. In the case of homes, the most common term is the net zero energy home (NZEH). In the future, the concept of net zero energy may be generalized by the zero energy method of life, which is also presented by Mr. Hernandes and Kenny (2010) (2).
presented by chen and his colleagues (2010). In this system, a geothermal heat pump is fed with photovoltaic integrated panels, which collects thermal energy. (The heating air circulating in a closed loop on the rear of the panels). One of the goals of this work is to provide a system that is based on existing current technology. For this reason, we don’t consider the ability to automatically optimize demand profiles to maximize the use of renewable energy sources. The benefits of this upcoming optimization, along with the major technological boundaries that have been successfully implemented in net zero- energy buildings; have been fully discussed by kolokutsa and colleagues (2010
).
II.
DEFINE A ZERO ENERGY HOME
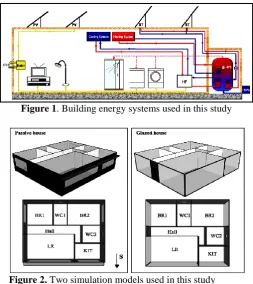
The study models a two –bedroom house with a 110-square-meters building developed in the passive on (8). In order to evaluate the sensitivity of the net zero- energy building system to resident’s behavior and architectural solutions, two types of coatings and machine efficiency were tested. The temperate region of Europe is displayed by the city of Lisbon (9). All the equipment at home is electric. Figure 1 offers striking display of home energy systems, for example, on the power grid interface and the solar thermal hot water system on the left. A heat pump (HP) , provide heating and cooling space in the summer. This analysis includes all common household equipment as well as higher performance models, such as dishwashers that can use pre-heating water (increased use of solar thermal energy). The order to reduce costs and enhance the functionality of the solutions, the system provides roof-mounted systems for the local use of all solar collectors. This option is also the most common type; there are various combinations of systems that can be considered (10).
Figure 1. Building energy systems used in this study
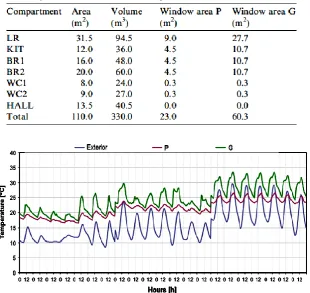
Figure 2. Two simulation models used in this study
The geometry of the building and its materials
The above figure shows two simulation models used in this study. In addition to an optimal mode, which is called (inactive, passive), this study also examines and analyzes a separate house with the same dimensions but without a non-optimal glazed area. The passive house represents an (inactive) passive design featuring low cooling and heating requirements (superiority to the current standard of Portugal). The non-optimal house, called (glazed), represents a very common non-passive design with large glazed areas and inadequate shading systems, resulting in poor performance in the summer.
. ceiling: polysterane insulation (15 cm), light weight cement (20 cm) and plaster (1 cm). total amount of U: 23% w/m2k (maximum value U= 1/20 w/m2k).
. floor: sand, polysterane insulation (8 cm) and heavy weight cement (15 cm). total value U: 0/41 w/m2k (maximum Not defined).
. External rims: plaster (1 cm), Hollow brick (11 cm), polysterane insulation (10 cm), Hollow brick (15 cm) and plaster (1 cm). total value U: 0/32 w/m2k (maximum value U=1/45 w/m2k).
. Internal rims: plaster (1 cm), Hollow brick (11 cm) and plaster (1 cm).
. windows: double glazed, little reflection. Glass U value: 1/8 w/m2k, solar factor g=1/63 , Blinds shade on all windows (Except the small window of the bathroom) (maximum Not defined).
. shading systems: foreign in house P , inside in house G. the shadows are applied when the sun’s exposure to the window is more than 150 w/m2 and the area is in a cooling state.
Both houses are use with standard Portugal construction systems (concrete structures, double brick rim with insulation between glasses) with increased insulation and advanced double glaze (little reflection). In general, the coating structure is more insulated than the requirements specified in the building regulations, which results in a significant reduction in the heating needs.
Table 1. Building dimensions.
Figur3. External temperature and average internal weights for indoor comfort for housesP and G for a typical week.
To compare the thermal behavior of the houses, two simulation sets were made: . Building with free circulation.
. Building despite cooling and heating in the hall (LR) bedrooms (BR2 and BR1) and kitchen.
Case study-solar heating and cooling system for a hotel building
Today, almost all solar heating and cooling systems are driven by solar collectors as the main source of solar power and the use of a cooling cycle to cover thermal cooling loads.
It is estimated that up to 1000 systems are installed around the world. These systems cover a wide range of technology used, system design, sizes and applications implemented for systematic analysis of the potential and limitations of using solar heating and cooling systems, a computer study has been introduced in the following outcomes.
Energy performance and issues related to the cost of solar heating and cooling systems for a virtual hotel building. The heating and cooling function of the solar heating system has been studied for this hotel, depending on different weather conditions and more in depth for a selected site (Ilam).
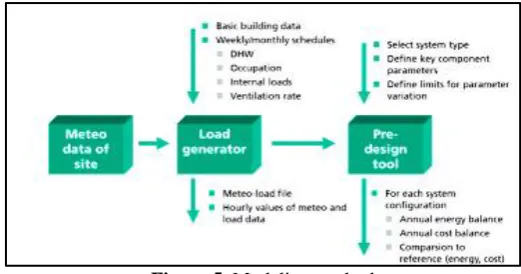
Figure 5. Modeling method
Table 2- places used in the simulation study.
Site: load for hotel example.
Energy demand for conditioning of ventilation air per 1000 m3/h. Solar irradiation on collector
Description of the values in the columns in table 1: column 2: the hotel’s annual heat demand example column 3: the hotel’s annual cooling demand example
Qheet ,sens = V . P. 8760
h=1
cp,air + xamb. cp,vap . (Tvant ,set − Tamb)+
V: fixed air volume flow (1000 m3/h) P: Air density
CP, air: special air-dry heat capacity Xamb: relative humidity of ambient air CP ,vap: capacity for hot water steam
Tvent,set: set the air temperature of the source (20 C)
Tamp: the temperature of the dry bubble of the surrounding air +Indicates that the brocket is only for positive values and is set to negative values (zero).
Column 5: theoretical energy demand roe a sensible cooling of the air conditioner for a constant flow of 1000 m3/h assumed to be based on the calculation:
Qcool ,sens = V . P. 8760
h=1
cp,air + xamb. cp,vap . (Tamb − Tvent ,set)+
Column 6: theoretical energy demand for a hidden cooling of the air conditioner for a constant flow of 1000 m3/h assumed to be based on the calculation:
Qcool ,lat = V . P. 8760
h=1
r0. (xamb − xvent ,set)+
Ro= enthalpy evaporates water-vapor
xvent,set= set points humidity supply ratio (8,5 grams per kilogram of dry air)
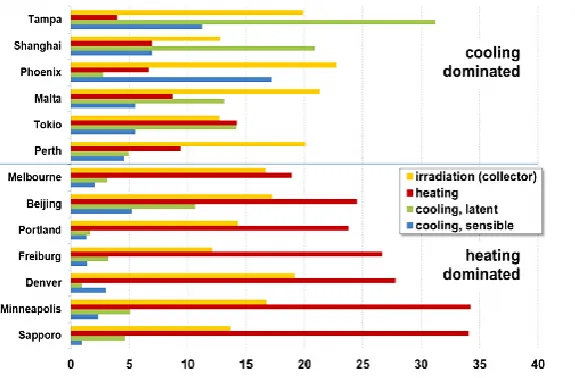
Column 7: Radiation on collector plate (Assumed tilt angle 45 C) the locations used cover a wide range of hot weather conditions to extremely cold weather. Among the cold weather, some of them are characterized by large hidden loads, including Tempa, Shanghai and Ilam. Figure 6 shows the comparison of the site according to the meteorological conditions according to the calculation of the above equation.
Figure 6- compare locations reviewed. The red, green, and blue bars refer to columns 4, 5 and 6 of the table.
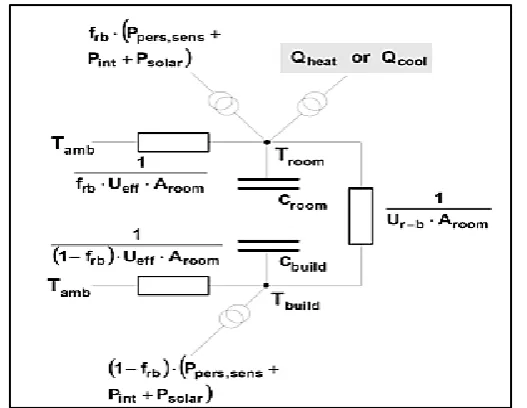
considered without floor. Although this ,model is relatively simple, it is clear that the annual result are very comparable with the results obtained with more sophisticated simulation tools. In addition, for economic analysis for each component, cost curves are included, which indicates their specific cost as a function of their size.
Figure 7- 2C-3R model- for a construction area used in the load generator.
Description of the load:
To reach the goal of this study, a virtual hotel with a floor space of 3050 square- meters was considered. Four regions were modeled to calculate building loads for each hour: includes a room, a guest room, a floor, a restaurant and a kitchen. Kitchen. Key results of load calculations are displayed in columns 1 and 2 of table 1 for all locations under review.
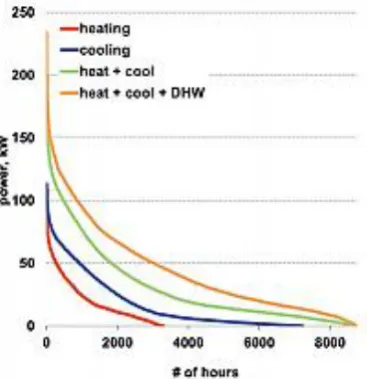
These values include the total annual heating and cooling load of four regions. Further details for the location of Ilam are shown in table 2 and the annual load curve shown in Ilam, as shown in figure 10. the values shown and curves are related to the following loads: need to heat (figure 10 is shown as “warm”), cooling demand (“cooling” shown), heat demand for hot coating and cooling demand if the cooling is completely covered by a thermal conductivity chiller with a thermal constant of 0/68 – COP (“cold + heat”), and the overall heating demand for heating, colling (thermal conductivity chiller with a thermal constant of 0/68 COP) and domestic hot water demand (shown with “heating + colling + DHW”). Based on the cooling load curve, it can be concluded, for example, that with a cooling capacity of 50 kw, thermal conductivity chillers can be covered by more than 50% of annual cooling.
General defaults cooling:
The assumptions used for all technical specifications and cost amounts are summarized here. the collector plate was considered with the following collection parameters:
C0 = 0.81, C1 = 3.0 w/m2k , C2 = 0.006 w/m2k2.
Thermal conductivity chiller with a thermal average of 0.68 COP was considered. an electric vapor compression chiller for up to a moderate value of 3.0 COP and an average efficiency of boiler of 0.9, was considered to be high thermal fuel value. For the cooling tower, assuming that an average of 40 watts of electricity per kilowatt hour of heat is emitted in to environmental air; this value is referenced to well- designed and operative wet and cool towers.
Assumptions used to analyze the exact cost of a hotel in Ilam
Figure 8- Annual load curve for hotel construction in Ilam
III. RESULT
Below are the results of extensive simulation studies. First, the energy performance of designing solar heating and cooling systems for the hotel building under various climatic conditions was studied. then a more accurate analysis was done for a web site (Malta). here, initial savings were made in energy and cost with a conventional system using fossil fuels for heating and producing domestic hot water and a conventional steam compression machine for cooling. The following control strategies have been implemented for solar heating and cooling systems in all simulations: since heating requires the lowest temperature (44 C) as compared to domestic hot water (55 C) and thermal conductivity cooling (80 C), the first priority was to heat the storage from to the system. The second priority is internal hot water and the third priority is given to thermal conduction cooling drives.
Solar section and specific final energy savings.
In this section, the solar deficit is compared for heating, cooling, domestic hot water and solar fraction to build hotels in different locations marked in the section.
Therefore, simulations for different sizes of collectors (150- 750 m2, varying at 150 m2), storage size (30- 80 liters per m2 of collector, at different stages of 12.5 liters per m2) and the thermal conductivity of the chiller (0-60 kw, different at the 15 kw stage). the favorable deduction for heating, cooling and domestic hot water is defined as: (DHW)
fsolar ,i=
(Qi− Qi,back −up)
Qi
= 1 −Qi,back −up Qi I. Abbreviation of heating, cooling or DHW respectively;
Qi Annual energy demand for heating, cooling or DHW, respectively, and Qi , back- up heating demand DHW, is a cooling system that is covered by the backup source. the solar energy fraction is calculated as follows: f solar, tot
fsolar ,tot =
Qh+ Qr+ QDHW − (Qh,back −up+ Qr,back −up+ QDHW ,back −up)
(Qh+ Qr+ QDHW)
This represents the total heating, cooling, and domestic total heating capacity covered by solar thermal systems.
Esolar ,tot =
Qh+ Qr+ QDHW − (Qh−back −up+ Qr,back −up + QDHW ,back −up)
Arell
Economic analysis:
and maintenance costs. The systems examined are shown in figure 21. It is interesting to note that, for the smallest area of the collector under study (150 m2), the decrease in LCC does not seem to be conductive by increasing the chiller capacity. the reason is that almost all the heat generated by solar collectors is used to generate domestic hot water or heat and as a result, only a small amount of thermal conductivity chiller is made to cover part of the cooling loads. this can also be seen with a very slight increase in primary energy savings for a 150 m2 collection area in figure 17. for all collector sizes, there are specific thermal conductivity chillers that result in a minimum LCC. for example, a system with a 300-m2 solar collector and a 30-kw thermal conductivity chiller leads to LCC, which is about 7,5% below that which is conventional, the primary energy savings in the range are about 58% . the largest surveyed system (the 750 m2 collection area, TDC capacity 60 kw) result in a slight increase of 4,3% in the life- cycle cost compared with conventional solutions for primary energy savings of 5,79%. This example demonstrates that only a comprehensive analysis including extensive energy balance, including the power consumption of all auxiliary components, and a cost analysis that allows the whole system to last a lifetime to decide on the size of key components such as solar collectors and thermal conductivity chillers. In the example of Malta and the hotel’s profile, a reasonable design, for example, is a system with a 450 m2 collection area and a 3-kw thermal conductivity chiller. the scheme leads to a primary energy savings of 5,66% compared to the reference, and life- cycle costs are about 9,3% below the reference.
IV.
CONCLUSION AND RECOMMENDATIONS
Solar heating and cooling systems using a solar thermal collector and thermal conductivity cooling equipment are an interesting option under many border conditions, and it should always be considered as an alternative to the design phase of a construction project. As shown in this study, the life- cycle cost of solar and cooling systems (LCC) is no higher than a conventional solution. At the same time, initial energy savings of up to 80% can be realized.
In general, many favorable conditions for the successful implementation of the solar cooling and solar market are:
•High- performance applications for heating, cooling and hot water. in this case, it is possible to use about one year of the solar collector system. so, hotels seem to be a promising part of solar heating and cooling.
•Places with a high solar energy potential, that is, high solar radiation.
•The conditions are marked by a high accident rate of solar gain, since it reduces the need for storage. Especially in the climate that needs both heating and cooling.
•The economy will be most desirable in places with high energy costs.
•In most cases, the thermal conductivity of the chiller is reasonable, which is much smaller than the colling load peak. this thermal conduction chiller mainly covers the base load, resulting in a large number of operating hours per year. the peak of cooling loads should be covered by a conventional compression machine.
Renewable energies will play an increasingly important role in future buildings, given the strong need to restrict the release of co2 derived from conventional energy sources. Solar heating and cooling technology is one of the most important solutions on the demand side.
This technology provides market opportunity for many stakeholders, including building owners, designers, manufacturers, and installation companies.
Today, solutions for using solar collectors are being implemented. But in the future, the use of solutions for building photovoltaic modules in combination with heat, electric conductivity of pumps and vapor compression chillers will increase. (Due to the decrease in price PV for obtaining modules on the one hand and the need to increase to maximize power consumption, local electricity generation in order to minimize the negative effects of the net on the other).
REFERENCES
[1]. Bambrook, S.M., Sproul, A.B., Jacob, D. Design optimisation for a low energy home in Sydney. Energy and Buildings 43 (7), 2011, 1702–1711.
[2]. Biaou, A.L., Bernier, M.A. Achieving total domestic hot water production with renewable energy. Building and Environment 43 (4), 2008,651–660.
[3]. Bojic´, M., Nikolic´, N., Nikolic´, D., Skerlic´, J., Miletic´, I. Toward a positive-net-energy residential building in Serbian conditions. Applied Energy 88 (7),2011, 2407–2419.
[4]. Carrilho da Grac_a, G., Augusto, A., Lerer, M. Integration of photovoltaic panels in portuguese high schools: feasibility study. In: Proceedings of Eurosun, 2008, Lisbon, Portugal.
[5]. Carrilho da Grac_a, G., Lerer, Maria M., Paredes, Pedro C. WP 2, system and component characterisation REPORT – Passive House. NaturalWorks, Portugal,2006.
International organization of Scientific Research 30 | Page
[7]. Commission of the European Communities. Green paper – Facts sheet: A European Strategy forSustainable, Competitive and Secure Energy, Brussels,2016.
[8]. Marszal, A.J., Heiselberg, P., Bourrelle, P., Musall, E., Voss, K., Sartori, I., Napolitano, A. Zero energy building – a review of definitions and calculation methodologies. Energy and Buildings 43 (4),2011, 971–979.
[9]. Matuska, T., Sourek, B. Facade solar collectors. Solar Energy 80 (11),2006, 1443–1452.
[10]. Miller, W., Buys, L. Anatomy of a sub-tropical Positive Energy Home (PEH), Solar Energy, ISSN 0038-092X, doi: 10.1016/ j.solener.2011.09.028.