© 2017 IJSRSET | Volume 3 | Issue 5 | Print ISSN: 2395-1990 | Online ISSN : 2394-4099 Themed Section: Engineering and Technology
A Survey on Study of thermal Power Generation & Grid Stability Using
MATLAB
Syed Tahir Hussain
1, Varsha Mehar
2M. Tech scholar
1& Assistant Professor
2Department of Electrical Engineering, Bhabha College of Engineering (RKDF), Bhopal, India
ABSTRACT
This Research relate the study of a TPG unit, along with simulation studies to determine balance grid in a
PS. A brief analysis of Aurangabad S/Station has been made using MATLAB. A brief study of each
component & simulation of model also performed. The power exchange network has been study & control
by LDC on SCADA system, for control of true & imaginary power. Two parallel circuit lines, with two
transformers, are studied in the simulation model. A Fault is created in one line. Active & Imaginary
power of the normal also the fault created line are studied and graph with MATLAB.
Keywords: CADA, LDC, MATLAB, SCADA SYSTEM
I.
INTRODUCTION
The assessment of security of large scale, non-linear power grids is a challenging task expensive task. [1] targets at decreasing the computational cost, by utilizing a robust assessment toolbox for carrying out the risk assessment study. [2] proposes Indirect method for stabilizing power system working on fuzzy logic & basis parameters for stability of system. [3] presents the study and stimulation of power system balance on fuzzy logic parameters and compare with PID based stabilizer. Hardware model is also constructed on fuzzy parameters for power system stabilizer on laboratory scale & also demonstrated.[4] presents the tuning procedure for stabilize of power system installed on generating units of a power station in Iran. Design criteria has also presented for the stabilizer, along with some field test results. [5] describes a fuzzy logic based An PS stabilizer. The stabilizer uses accelerating power and deviation of speed as input variables of the controller. [6] proposes an adaptive fuzzy PS stabilizer. The balance consists of a predictor based on the generalized neuron (GN) technique, along with a fuzzy logic controller.
The present study considers a model of a PS substation. The substation has two parallel lines, with a transformer
each. A fault is induced in one of the parallel lines. The true and imaginary powers of both the lines are studied and plotted using MATLAB. Suggestions for getting better the balance of the power system are presented.
Plight Study:
According to the load and fluctuating frequency as the frequency is one big criteria for Continuity of the grid and for maintaining the grid stable. The working, Function & operation of LDC are studied, Where different case & modes are studied, The increase & decrease in generation also, studied the frequency graph.
Normal Mode Case:
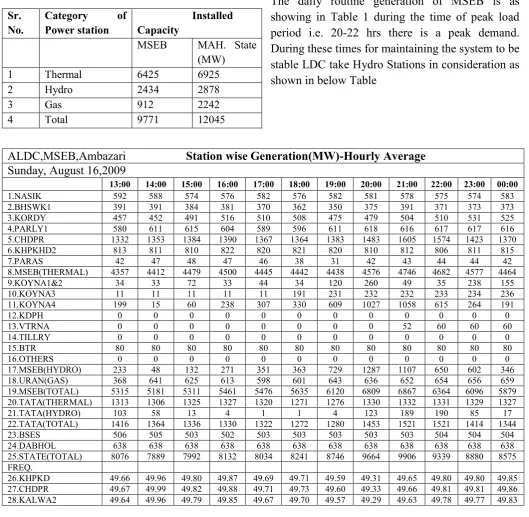
International Journal of Scientific Research in Science, Engineering and Technology (ijsrset.com) Table 1. Generating Capacity
Sr. No.
Category of Power station
Installed Capacity
MSEB MAH. State
(MW)
1 Thermal 6425 6925
2 Hydro 2434 2878
3 Gas 912 2242
4 Total 9771 12045
The daily routine generation of MSEB is as
showing in Table 1 during the time of peak load
period i.e. 20-22 hrs there is a peak demand.
During these times for maintaining the system to be
stable LDC take Hydro Stations in consideration as
shown in below Table
The frequency curve for 24 hrs in graph. At off load demand in the frequency fluctuate between 50Hz to
50.20Hz, while peak load the frequency fluctuating between 49.80-49.60HZ.This operation are performed
by LDC
ALDC,MSEB,Ambazari Station wise Generation(MW)-Hourly Average
Sunday, August 16,2009
13:00 14:00 15:00 16:00 17:00 18:00 19:00 20:00 21:00 22:00 23:00 00:00
1.NASIK 592 588 574 576 582 576 582 581 578 575 574 583
2.BHSWK1 391 391 384 381 370 362 350 375 391 371 373 373
3.KORDY 457 452 491 516 510 508 475 479 504 510 531 525
4.PARLY1 580 611 615 604 589 596 611 618 616 617 617 616
5.CHDPR 1332 1353 1384 1390 1367 1364 1383 1483 1605 1574 1423 1370
6.KHPKHD2 813 811 810 822 820 821 820 810 812 806 811 815
7.PARAS 42 47 48 47 46 38 31 42 43 44 44 42
8.MSEB(THERMAL) 4357 4412 4479 4500 4445 4442 4438 4576 4746 4682 4577 4464
9.KOYNA1&2 34 33 72 33 44 34 120 260 49 35 238 155
10.KOYNA3 11 11 11 11 11 191 231 232 232 233 234 236
11.KOYNA4 199 15 60 238 307 330 609 1027 1058 615 264 191
12.KDPH 0 0 0 0 0 0 0 0 0 0 0 0
13.VTRNA 0 0 0 0 0 0 0 0 52 60 60 60
14.TILLRY 0 0 0 0 0 0 0 0 0 0 0 0
15.BTR 80 80 80 80 80 80 80 80 80 80 80 80
16.OTHERS 0 0 0 0 0 0 0 0 0 0 0 0
17.MSEB(HYDRO) 233 48 132 271 351 363 729 1287 1107 650 602 346
18.URAN(GAS) 368 641 625 613 598 601 643 636 652 654 656 659
19.MSEB(TOTAL) 5315 5181 5311 5461 5476 5635 6120 6809 6867 6364 6096 5879 20.TATA(THERMAL) 1313 1306 1325 1327 1320 1271 1276 1330 1332 1331 1329 1327
21.TATA(HYDRO) 103 58 13 4 1 1 4 123 189 190 85 17
22.TATA(TOTAL) 1416 1364 1336 1330 1322 1272 1280 1453 1521 1521 1414 1344
23.BSES 506 505 503 502 503 503 503 503 503 504 504 504
24.DABHOL 638 638 638 638 638 638 638 638 638 638 638 638
25.STATE(TOTAL) 8076 7889 7992 8132 8034 8241 8746 9664 9906 9339 8880 8575 FREQ.
4.1
Alert Mode Case:
Another case which belongs to alert mode operation of L.D.C. Here contingency occurs due which Fault
in 500 MW units. Now looking over Tab. 4.3 Parly station goes out operation after the occurrence of fault.
Also Koradi and Khaperkheda switch off operation due to occurrence of fault or trip off of sub-stations.
Now the frequency also gets fluctuated below forty-nine point eighty Hz. 4.2
Now at such a time L.D. take Hydro station on Bar/consideration. Hydro stations met the demand of
thermal stations continue the frequency. Now still frequency is below appropriate level at this time some
power is withdrawal from central sector, from another states as per the ABT rules and the demand is met.
ALDC,MSEB,Ambazari Station wise Generation(MW)-Hourly Average
Tuesday, July 21,2009
01:00 02:00 03:00 04:00 05:00 06:00 07:00 08:00 09:00 10:00 11:00 12:00
1.NASIK 600 445 428 419 424 426 428 420 425 425 421 426 2.BHSWK1 307 288 260 234 189 211 202 191 159 116 104 102
3.KORDY 423 404 239 148 131 129 129 129 116 0 0 0
4.PARLY1 507 24 -1 -1 -1 -1 -1 -1 -1 -1 -1 -1
5.CHDPR 1247 1162 1158 1152 1144 1125 1124 1109 1096 1066 1017 1006
6.KHPKHD2 645 644 616 648 632 588 411 0 0 0 0 1
7.PARAS 18 0 0 0 0 0 0 0 0 0 0 0
8.MSEB(THERMAL) 3954 3108 2853 2755 2686 2624 2508 1954 1853 1785 1692 1689
International Journal of Scientific Research in Science, Engineering and Technology (ijsrset.com)
11.KOYNA4 -11 47 31 -10 -10 222 719 887 829 829 837 868
12.KDPH 0 0 0 0 0 0 0 0 0 0 0 0
13.VTRNA 0 0 0 0 0 0 0 0 0 0 0 0
14.TILLRY 0 0 0 0 0 0 0 0 0 0 0 0
15.BTR 80 80 80 80 80 80 80 80 80 80 80 80
16.OTHERS 0 0 0 0 0 0 0 0 0 0 0 0
17.MSEB(HYDRO) 23 124 87 28 23 414 1051 936 861 863 872 948 18.URAN(GAS) 388 312 317 319 318 301 302 282 268 299 243 221 19.MSEB(TOTAL) 4527 3930 3592 3294 3154 3049 3812 3516 3153 3176 3138 3045 20.TATA(THERMAL)
1096 960 901 850 852 920 1052 1203 1287 1298 1302 1306 21.TATA(HYDRO) 82 82 82 82 82 82 82 204 335 473 474 474 22.TATA(TOTAL) 1178 1042 963 932 934 1003 1134 1407 1621 1772 1775 1780 23.BSES 513 513 512 512 512 513 513 515 514 514 512 511
24.DABHOL 643 643 643 643 643 643 643 643 643 643 643 643 25.STATE(TOTAL) 7602 7602 7602 7602 7602 7602 7602 7602 7602 7602 7602 7602
FREQ.
26.KHPKD 49.49 49.27 49.54 49.71 49.72 49.35 49.19 49.45 49.45 49.43 49.44 49.31 27.CHDPR 49.51 49.28 49.55 49.72 49.73 49.37 49.20 49.47 49.46 49.44 49.46 49.33 28.KALWA2 49.48 49.24 49.52 49.69 49.70 49.34 49.17 49.44 49.43 49.41 49.43 49.29
ALDC,MSEB,Ambazari Station wise Generation(MW)-Hourly Average
Tuesday, July 21,2009
13:00 14:00 15:00 16:00 17:00 18:00 19:00 20:00 21:00 22:00 23:00 00:00
1.NASIK 424 437 431 429 427 426 419 415 410 416 399 412
2.BHSWK1 61 74 97 114 97 97 122 134 121 115 130 122
3.KORDY 0 0 0 0 0 0 0 0 0 0 0 0
4.PARLY1 -1 -1 -1 -1 -1 -1 -1 -1 -1 -1 -1 -1
5.CHDPR 999 1042 1052 1012 956 1024 1046 1064 1046 1078 1074 1077
6.KHPKHD2 1 1 1 1 1 1 1 1 6 81 109 159
7.PARAS 0 0 0 0 0 0 0 0 0 0 0 0
8.MSEB(THERMAL) 1635 1705 1711 1679 1647 1685 1722 1793 1731 1843 1858 1875
9.KOYNA1&2 34 34 34 34 34 34 39 259 502 287 59 263
10.KOYNA3 274 303 308 304 307 313 314 315 316 317 316 316
11.KOYNA4 829 829 828 829 828 829 906 1093 1131 1126 859 440
12.KDPH 0 0 0 0 0 0 0 0 0 0 0 0
13.VTRNA 0 0 0 0 0 0 0 0 0 0 0 0
14.TILLRY 0 0 0 0 0 0 0 0 0 0 0 0
15.BTR 80 80 80 80 80 80 80 80 80 80 80 80
16.OTHERS 0 0 0 0 0 0 0 0 0 0 0 0
17.MSEB(HYDRO) 863 863 863 863 863 863 945 1351 1632 1413 917 702
18.URAN(GAS) 224 225 225 179 167 179 186 186 196 253 358 396
19.MSEB(TOTAL) 3055 3130 3221 3189 3079 3115 3086 3418 3973 1003 3619 3073 20.TATA(THERMAL) 1306 1301 1290 1294 1261 1274 1270 1264 1263 1254 1217 1214
21.TATA(HYDRO) 474 474 373 249 252 302 329 355 328 244 183 81
22.TATA(TOTAL) 1779 1774 1663 1560 1513 1576 1599 1619 1591 1499 1401 1295
23.BSES 514 515 514 515 514 515 513 512 513 514 514 514
24.DABHOL 643 643 643 643 643 643 643 643 643 643 643 643
25.STATE(TOTAL) 7602 7602 7602 7602 7602 7602 7602 7602 7602 7602 7602 7602 FREQ.
26.KHPKD 49.58 49.66 49.62 49.67 49.64 49.59 49.62 49.43 49.24 49.34 49.44 49.37 27.CHDPR 49.60 49.67 49.64 49.69 49.66 49.66 49.61 49.63 49.44 49.24 49.46 49.38 28.KALWA2 49.57 49.64 49.60 49.66 49.62 49.58 49.60 49.41 49.22 49.32 49.42 49.35
In this way Tab.4.4 though there is loss of Energy from 3954 MW to 1875 MW i.e. nearly 1300 MW
power is loss still their no blackout occurred. In this way by performing such a operations stability is
maintained by L.D.
4.2
Emergency mode case
Another case in which the generation is as per routine and the load is off. Due to this switch off of load phenomenon of over voltage occurs which indicates that lesser demand related to generation.
At such situation LDC operator removes all the load from the loaded region. Even then also frequency is not in prescribe limit. High paying station are switch off. Ex cost of Paras Unit is high than Chandrapur. Then Chandrapur is low than Paras .Hence Paras unit highest priority and it should be turn off firstly. The frequency curve 4.3. Ti is seen that at some hours the frequency is above 50.20 Hz and at remaining hours it nearly equal to 50.20.Hz. In this way the stability is maintained. In this manner by various function are performed by Load Dispatched (L.D.) Continuity of overall grid system can be maintained.
International Journal of Scientific Research in Science, Engineering and Technology (ijsrset.com)
System Simulation
In this project we are studying simulation of SCADA SYSTEM. The simulation of this programs we have limited our vision to two transformer on which fault occurs. The fault created in simulation based on the data given by SCADA during real time fault. We display the output of simulation using different graphs for active power and reactive power also we display graphs of current of normal transformer and faulty transformer.
Actual Analysis
The transformation system has two quantities, quality and stability. The above quantity of electrical system are dependent of each other if one is done, other will also be.
When we are dealing with transmission lines, we have to generation system, it means generator supplying output, transmitting transferring to a load point through network.
Fig 1. shows line diagram of 400/220 KV Substation. In which 400 KV Main Bus-I and II voltage level shown. Third bus is Transfer Bus as per arrangement of BUS system. Close Square in Red colour shows status of BREAKER and round close circle shows STATUS of ISOLATOR. Close indications shows lines are in service. In green colour 220 KV bus shown in single line diagram.
Figure 1. Analysis of Substation
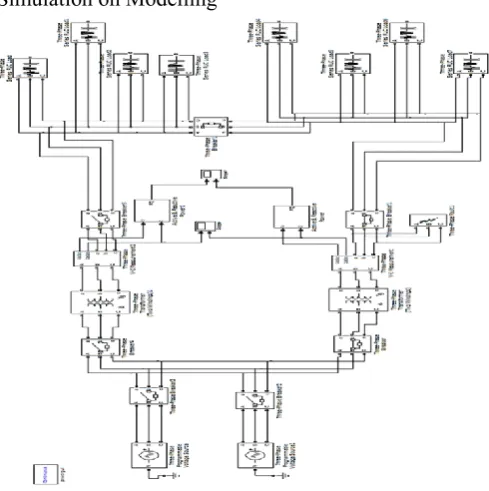
Simulation on Modelling
Here there are two three phase power sources a 400 KV, 50 Hz, A B C phase sequences. Which are attached to common bus 1 which is at 400 KV 50 Hz. Output of the bus is attached to the transformer X1 and X2 through CB3, CB4 respectively which is primary side CB transformer both the transformer are rated at 150 MW, 400 KV/ 200 KV, 50 Hz.
Through these measuring blocks we can measure the instantaneous quantity of current and voltage. Bus 2 is provided into two parts bus A and bus B.
Bus A is connected the load on transformer 1 and interconnected with bus B.
Similarly bus B is directly attached to the load on the transformer 2 and interconnected with bus A. Grid connection of bus A and bus B is done through the CB 5. For Measuring power measuring block is provided to the transformers also scope ic attached to study the graph.
Graph of Active & Reactive power
Figure 2. Description of graph Active & Reactive power
a) Active & Reactive power of X1 b) Active & Reactive power of X2
At t=0 sec tot=1 sec both the transformer feeding normal power. At t=1 sec when the fault is exist in system then True and Imaginary power of X1 get rise to upper value but when CB 5 get off then it start supplying normal load. After fault is cleared X2 again comes back and start supplying its normal load.
Actual graph of Real and Imaginary power of X1 & X2.
Figure 3. Graph Active & Reactive power
a) Active & Reactive power of normal transformer b) Active & Reactive power of abnormal transformer
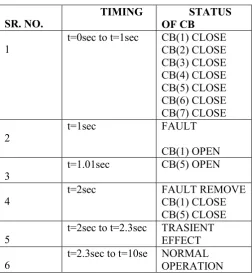
Timing instants and status of circuit breaker
SR. NO. TIMING OF CB STATUS
1 t=0sec to t=1sec CB(1) CLOSE CB(2) CLOSE CB(3) CLOSE CB(4) CLOSE CB(5) CLOSE CB(6) CLOSE CB(7) CLOSE
2 t=1sec FAULT
CB(1) OPEN
3 t=1.01sec CB(5) OPEN
4 t=2sec FAULT REMOVE CB(1) CLOSE
CB(5) CLOSE
5 t=2sec to t=2.3sec TRASIENT EFFECT
6 t=2.3sec to t=10se NORMAL OPERATION
Table 4. Timing instant and status of circuit breakers
II.
REFERENCES
[1].
T. L. Vu and K. T. Turitsyn, "A Framework
for Robust Assessment of Power Grid
Stability and Resiliency," IEEE Trans. on
Automatic Control, vol. 62, no. 3, Mar 2017.
[2].
N. Hossein-Zadeh and A. Kalam, "An
International Journal of Scientific Research in Science, Engineering and Technology (ijsrset.com)
Stabilizer," Electrical Power and Energy
Systems, 24 (2002).
[3].
S. A. Osaimi, A. Abdennour, A. A.
Al-Sulaiman, "Hardware implementation of a
fuzzy logic stabilizer on a laboratory scale
power system," Electrical Power Systems
Research 74 (2005).
[4].
M. Parniani and H. Lesani, "Application of
power system stabilizer at Bandar-Abbas
power station," IEEE Trans. on Power
Systems, vol. 9, no. 3, Aug 1994.
[5].
N. Hosseinzadeh and A. Kalam, "On-Line
Tuning of a Fuzzy Power System Stabiliser,"
Proceeding of International Conf. on Energy
Management and Power Delivery 1998.
[6].
D. K. Chaturvedi and O. P. Malik,
"Neurofuzzy Power System Stabilizer," IEEE
Trans. on Energy Conversion, vol. 23, no. 3,
Sep 2008.