*For correspondence. Email [email protected]; Tel. (858) 784 9871; Fax. (858) 784 2246.
© 2002 Caister Academic Press
Normalizing DNA Microarray Data
Martin Bilban*1,2, Lukas K. Buehler1, Steven Head1, Gernot Desoye2 and Vito Quaranta1
1The Scripps Research Institute, Department of Cell Biology, 10550 North Torrey Pines Road, La Jolla, CA 92037, USA
2Clinic of Obstetrics and Gynecology, University of Graz, Auenbruggerplatz 14, A-8036 Austria
Abstract
DNA microarrays are a powerful tool to investigate differential gene expression for thousands of genes simultaneously. Although DNA microarrays have been widely used to understand the critical events underlying growth, development, homeostasis, behavior and the onset of disease, the management of the resulting data has received little attention. Presently, the fluorescent dyes Cy3 and Cy5 are most often used to prepare labeled cDNA for microarray hybridizations. Raw microarray data are image files that have to be transformed into gene expression formats – a process that requires data manipulation due to systematic variations which may be attributed to differences in the physical and chemical dye characteristics. Since the goal of most microarray applications is to identify differences in transcript levels calculated from fluorescence ratios it is necessary to normalize fluorescence signals to compensate for systematic variations. Here, we will review current normalization strategies applied to cDNA microarrays and discuss their limits. We will show that experimental design determines normalization success.
Introduction
Spotted complementary DNA (cDNA) or oligonucleotide microarrays have become a popular technique to detect changes in gene expression in response to a wide variety of conditions including cancer, aging and development (Alizadeh et al., 2000; Bilban et al., 2000; Tanaka et al., 2000; Young, 2000). The mass of numbers produced by a single microarray experiment may amount to tens of thousands of data points for thousands of genes. However, to extract accurate biological information it is necessary to filter out experimental noise and correct for systematic errors confounding the raw data obtained by this complex technology. Potential sources of systematic errors include array surface chemistry, microarray printing, labeling methods, hybridization parameters, image analysis and
RNA isolation (Claverie, 1999; Schuchhardt et al., 2000; Lou et al., 2001; Tseng et al., 2001; Yue et al., 2001). Different types of experiments are required for assessing different types of errors. We will focus on artefacts generated during the process of labeling nucleic acids derived from the biological specimen (RNA extract) and review current protocols to eliminate those artifacts. With this review we will present the current conceptual framework for normalization of DNA microarray data and its dependence on the experimental setup. Our paper addressess investigators new to this field who wish to choose statistical analysis methods that best fit their microarray layout.
The Microarray Assay for Differential Gene Expression
DNA probes corresponding to the genes of interest are usually arranged in arrays on a glass slide or ‘chip’(Cheung et al., 1999; Duggan et al., 1999) . The source of genes on the chip (the ‘probes’) include PCR products amplified from fully sequenced cloned genes, collections of partially sequenced DNAs known as expressed sequence tags (ESTs) or randomly chosen cDNAs from desired libraries. More recently, oligonucleotides designed to hybridize to selected sets of gene transcripts have been used on spotted (Chambers et al., 1999; Stingley et al., 2000) or ink-jet fabricated (Hughes et al., 2001) microarrays. The DNA probes to be arrayed (typically 0.5 to 2.5 kb for PCR-amplified clones and 50-80 base pairs for oligonucleotides) are robotically printed on chemically pre-treated glass slides to ensure covalent or non-covalent attachment to the glass surface (Duggan et al., 1999) . The samples (the ‘targets’) for arrays are labeled representations of mRNA pools derived from tissue preparations or in vitro cell culture. Commonly, reverse transcription from an oligo-dT primer in the presence of fluorescent nucleotide analogues is used. The labeled cDNAs are pooled and hybridized to an individual array. After removing unbound target molecules, slides are scanned for fluorescence emission. Enzymatic incorporation of fluorescent nucleotides into the target cDNA during reverse transcription can be used to investigate transcript levels from 10 µg or more total RNA. Post-hybridization signal amplification can be applied to detect expression levels from as little as 50 ng of total RNA by deposition of colorimetric detectable molecules precipitated by enzymes ‘bound’ to the cDNA through the biotin-streptavidine interaction (Duggan et al., 1999). Linear sample amplification can be carried out by in vitro transcription, yielding up to 1000-fold amplification with reports that no biases are introduced (Luo et al., 1999).
58 Bilban et al.
sequences on the array. To maximize the reliability and precision with which we can quantitate differences in the abundance of each RNA species, we directly compare two samples by labeling them with spectrally distinct fluorescent dyes and mixing the two probes for simultaneous hybridization to one array (competitive binding). The relative representation of a gene in the two samples is assayed by measuring the ratio of the fluorescence intensities of the two dyes at the cognate target element. The ratio of the two signals at any element in an array, are relatively insensitive to most systematic errors because they affect both probe mixtures equivalently, except for fluorophore specific effects during label incorporation into cDNA and photobleaching during sample processing and laser scanning. Therefore, microarray-based methods are best used to assay the relative distribution of RNA transcripts among two or more samples.
Problems with Fluorescent Dyes
Differential gene expression profiling with DNA microarrays uses labeling of a test and reference RNA sample with spectrally distinct fluorophores. A large number of fluorescently-labeled deoxyribonucleotides are commercially available. Presently, the most often used fluorescent dyes are the cyanine based Cy3 and Cy5 (Amersham, Piscataway, NJ). Other fluorophores used less frequently in microarray experiments include fluorescein, rhodamin (Amersham), R110, TAMRA (Perkin-Elmer), Alexa dyes (Molecular Probes, Eugene, Or), and SpectrumOrange (Vysis, Downers Grove, Il) (Eisen and Brown, 1999). Fluorescent dyes compatible with current microarray formats should meet the following criteria: they should be spectrally well separated, incorporated with high specific activities with a variety of enzymes, and fluoresce brightly when dry, which simplifies image acquisition (Eisen and Brown, 1999).
Systematic variations arising from dual color labeling may be due to: (I) physical and chemical characteristics of the fluorophores, (II) hardware design, or (III) labeling methods. (I) It is well known that Cy3 and Cy5 exhibit different quantum yields. Furthermore, Cy5 has the disadvantage that it sometimes gives higher background levels on glass surfaces and is more sensitive to photobleaching than Cy3 (photobleaching is caused by intense light and occurs because the excited state of a molecule is generally much more chemically reactive than the ground state (van Hal et al., 2000). (II) Scanner hardware design may be a source of systematic error due to different reading efficiencies for Cy3 and Cy5. (III) Labeling method: The first two variations may be termed ‘overall’ or ‘general’ dye artifacts as they are not affected by the specific sequence context of the cDNA and affect all sequences to the same extent. Most studies have used direct incorporation of Cy3- or Cy5 modified nucleotide analogues that may introduce a gene or sequence-specific artifact (Bartosiewicz et al., 2000; Taniguchi et al., 2001; Tseng et al., 2001; Wurmbach et al., 2001). This difference in gene-specific incorporation efficiency manifests itself in a way that some genes produce consistently larger signals
when labeled with one dye compared to the other even in a homotypic hybridization (the same RNA sample labeled with the two fluorophores and hybridized to a single microarray) where normalized Cy3/Cy5 ratios should all be equal to one. Most efficiently, this type of experimental artifact can be identified and flagged by exchanging dyes on samples or using a different labeling approach, i.e. indirect incorporation of amino-allyl modified nucleotide analogues (such as amino allyl-dCTP) to which the dyes are subsequently chemically coupled (Wurmbach et al., 2001).
In summary, label incorporation and scanning artifacts result in different Cy3- and Cy5 fluorescence intensities even when equal amounts of Cy3- and Cy5-labeled cDNA are present. Before running statistical analyses or clustering algorithms it is therefore essential to identify and correct systematic sources of variation. Thus, with fluorescence signals properly normalized, the effect of systematic variations can be kept to a minimum increasing microarray data quality.
Normalization Strategies
Why normalization? Normalization is useful for a number of situations including: (i) within-slide comparison (ii) multiple-slide comparison, and (iii) paired-slide comparison for dye-exchange experiments (Yang et al., 2001a). Optimally, experimental design anticipates statistical verification of signal comparison across arrays. Genes can be spotted multiple times per array (‘application targeted arrays’), mRNA can be used on multiple arrays (for ‘genome-wide’ arrays), or mRNA samples may be taken from multiple specimen – to account for inherent biological variability. The latter comparison represents biological replicates while the first two are more accurately described as repeated measures useful to assess signal detection limits of microarrays.
Regardless of array design, normalization following image acquisition requires two sequential steps (Figure 1): selection and calibration of data derived from genes known not to be affected by the experimental conditions under investigation (‘invariant’ genes). Both the selection and calibration of such invariant genes is not trivial and the choice of sequences and their layout on microarray slides is critical for successful normalization and analysis.
Which Genes Should be Used for Normalization?
are expected to be invariant, non-differentially expressed genes may be selected by mathematical rather than biological criteria (Tseng et al., 2001) . The common assumption for all criteria is that they result in identification and selection of a sufficiently large number of non-differentially expressed genes that cover the full range of signal intensities.
(I) Global normalization: The assumption underlying this approach is that the total mass of mRNA labeled with either Cy3 or Cy5 is equal. While the intensity for any one spot may be higher in one channel than the other, when averaged over thousands of spots in the array, these fluctuations should average out. Consequently, the total integrated intensity across all the spots in the array should be equal and the ratio of the arithmetic mean equal to one. This approach has been used successfully for
genome-wide arrays that feature large sets of genes (i.e. >5,000) where under most experimental conditions less than 10 percent of all genes are expected to change in a biologically relevant way (Marton et al., 1998; Alizadeh et al., 2000; Roberts et al., 2000; Ross et al., 2000; Yue et al., 2001). (II) Housekeeping genes: In the past, the expression levels of housekeeping genes were assumed to be constant and were frequently used to normalize microarray expression data (Camerer et al., 2000) . However, more recent reports indicate that the expression levels of housekeeping genes can vary significantly (Welsh et al., 2001). Using housekeeping genes to normalize expression data could, therefore, lead to erroneous conclusions (Yu et al., 2000). Global normalization and normalization to housekeepers may be used when comparing similar samples or when not many changes are assumed. However, if the number of predetermined housekeeping genes is small or their intensities do not cover the full range of signal intensities, Figure 1. Normalization is an integral part in cDNA microarray data
processing for differential gene expression. Raw data are stored as 16-bit image files acquired in the Cy3 and Cy5 channel. Fluorescent intensities in each spot are subtracted from its local background or alternatively, a global background may be used instead if the background is uniform across the array. At this stage, spots giving weak intensities may be flagged and omitted from further analysis, which may improve normalization results (Yang et al., 2001b). To view differential gene expression, normalized data may then be viewed as scatter plots, Excel spreadsheets, false-color overlays, or may be further processed such as by clustering analysis.
60 Bilban et al.
this approach may not provide a good fit for non-linear normalization (Tseng et al., 2001).
(III) Exogenous control genes: In contrast, exogenous control genes to normalize microarray data is a universally applicable normalization strategy as it does not depend on assumptions like the ones described above. Obviously, external control RNAs should be chosen not to cross-hybridize with RNA from the organism being studied, but should be similar in their general characteristics (GC content, length, poly(A) tails) (Eickhoff et al., 1999). Many bacterial or plant genes can be used on human or rodent arrays, as there is limited homology at the nucleotide level between these organisms. By cloning these genes into bacterial plasmids with phage RNA polymerase binding sites and engineered poly(A) tails, large amounts of RNA can be made for each gene for incorporation at various experimental stages (Schena et al., 1996; Heller et al., 1997; Eisen and Brown, 1999; Seftor et al., 2001). The first application used a set of human genes to normalize data from a microarray containing 48 A. thaliana genes (Schena et al., 1995). For either of these selection methods, normalization results may be improved by flagging unreliable signals, e.g. eliminating weak signals that fall below a certain threshold (Yang et al., 2001b).
(IV) The rationale behind normalization with genomic DNA is that it represents a constant copy number for a given mass of DNA. For yeast gene expression arrays, total yeast genomic DNA has been used, however, for humans only a small fraction of the human genome is expressed yielding only low hybridization signals (DeRisi et al., 1997; Eisen and Brown, 1999; Iyer et al., 1999; Cunningham et al., 2000; Perou et al., 2000; Yang et al., 2001a).
(V) Non-differentially expressed genes may be estimated solely by mathematical algorithms instead of biological criteria. This may be achieved by a rank-invariant method that selects signals from spots where the difference of the rank of the Cy3 and Cy5 signals are very close to each other and where the rank of the mean of replicate spots is not within the highest/lowest ranks overall. Thus, while absolute signals may be different due to systematic errors, their ranks within the entire group are very similar indicating no change (Callow et al., 2000; Tseng et al., 2001). This strategy may avoid human bias and simply should be employed in the absence of prior knowledge about which genes are differentially expressed and which ones are not.
Linear or Non-Linear Normalization?
The second step entails the estimation of a normalization constant or function for either signals or ratios using any of the above set of invariant genes. To this end the data can be displayed for visual inspection to check for linearity over the entire signal intensity range. Most simply, a scatter plot of Cy3 vs. Cy5 will tell whether both signals increase to the same extent with increasing concentration of labeled cDNA. Alternatively, so-called M-A plots display a horizontally aligned scatter (i.e. a 45" clockwise rotation of
the log scaled coordinate system) offering a particularly intuitive inspection of the data for deviations from linearity. Here, M represents the log ratio of the two dyes and A the total log intensity of each spot (Tseng et al., 2001; Yang Y.H. et al., 2001). Displaying data as M-A plots is a very useful way to graphically illustrate intensity dependent patterns and demonstrate successful normalization.
Applying linear normalization assumes that methodical errors are independent of signal intensities. In this case, a simple scatter plot of Cy3 vs. Cy5 signals allows for the estimation of the slope of its linear regression curve which determines the normalization factor to adjust all Cy5 and Cy3 signals before ratios are calculated and analyzed. In many instances, a single normalization factor is used, e.g. the median or mean of the selected set of invariant genes, e.g. Cy3median = Cy5median = 1. Instead of choosing 1 as the median or mean, some arbitrary value can be selected (e.g. the mean signal intensity of an Affymetrix GeneChip™ is set to a fixed value such as 250 thus allowing chip to chip comparisons (Welsh et al., 2001). The data is usually scaled to a value reflecting the original signal range. Commonly, one of the channels (or slides) serves as the baseline while the corresponding signals are scaled to baseline using the normalization factor determined from the scatter plot analysis.
Normalization can also be applied directly to ratios instead of the absolute signals (see M-A plots). Normalization of ratios yields a distribution around 1 (0 for log ratios). Deviations from one serve as the normalization factor. Ratio normalization leaves the intensities uncalibrated (Kerr et al., 2000; Kerr and Churchill, 2001) . Thus, normalization of intensities before ratio determination is preferable, unless one accepts discarding information about absolute intensities. Intensity values can be used later in the analysis to distinguish specific from non-specific hybridization (ratio validation) (Mills and Gordon, 2001).
plots that do require a single normalization factor indicating that most of the bias (non-linearity) is due to differences in chemical and physical properties of the two dyes used during the labeling procedures, particularly for very low signals (Kerr et al., 2000).
Applications of Gene Expression Profiling in Cancer Biology: Genome-Wide Versus Focused Microarrays
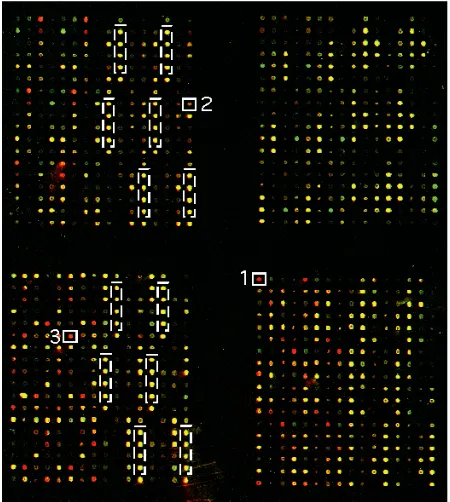
A variety of DNA array studies have demonstrated that large-scale gene expression profiles are valuable in both cancer diagnosis and prognosis and may be used for cancer classification (Alizadeh et al., 2000; Bittner et al., 2000; Ross et al., 2000; Snijders et al., 2000; Dhanasekaran et al., 2001). These microarray experiments strive to establish the ‘global view’ of the activity of all genes (i.e., the genome) in normal versus malignant tissue samples or model cell lines. This is particularly valuable for tumors because a correct (sub)classification of cancer is essential for guiding treatment. However, the scale of genome-wide microarrays causes several problems: Firstly, production of arrays can be slow and quality control is difficult for both academic and commercial suppliers. Secondly, the high expense of global arrays compels scientists to limit the number of arrays used hampering their efforts to determine statistically relevant sensitivity and specificity of their data (Lee et al., 2000; Wurmbach et al., 2001). Third, any single microarray output is subject to substantial variability. The statistical power of correctly assigning a gene as differentially regulated increases profoundly with replication. Therefore, to quantitatively describe gene expression, a ‘focused microarray system’ containing a selected set of genes (e.g. signaling pathway, enzyme class) may be preferable to obtain a true genotypic correlate of a particular phenotype. Contrary to ‘genome-wide’ chips, ‘focused microarrays’ can easily be fabricated in-house, are less expensive, readily available and facilitate high quality production, validation and data generation (Wurmbach et al., 2001). Application-targeted arrays and array reagents are already commercially available (e.g. Operon, Clontech, Incyte Pharmaceuticals, Affymetrix) for research in diverse areas such as cancer, stress and aging, toxicology, hematology, cell cycle, neurology and apoptosis. We have developed a focused microarray system for studying structural changes in the extracellular matrix (Seftor et al., 2001), which are necessary for cell migration during tissue remodeling and tumor invasion. Matrix metalloproteases (MMPs) and extracellular matrix (ECM) molecules have been recognized as key players in this process (Werb, 1997). The correlation of gene expression patterns with the variation in the phenotype of the cell can begin the process by which the function of a gene can be inferred. Thus, the patterns of expression of known genes can reveal novel phenotypic aspects of the cells and tissues studied. A comparison of highly vs. poorly invasive human melanoma cells with a focused microarray system revealed significant increases in the expression of MMPs and ECM molecules (Figure 2). This suggests that the aggressive cells have the potential to interact with and alter their extracellular environment differently than the poorly
invasive cells. Interactions between the ECM, cell-surface receptors, and the cytoskeleton establish a complex signaling mechanism that regulates gene transcription and ultimately may lead to changes in a cells’ motility (Seftor et al., 2001).
Which is the Best Method to Use?
Given the variety of normalization strategies presented above, which is the best method to use? The answer will depend primarily on the design of the microarrays used to generate the data as well as how much the resulting data set changes when one changes the normalization method. For example, if one performs a simple linear normalization based on 1) a set of candidate housekeeping genes and 2) global (average chip) signals and the calculated normalization factors are similar, then clearly both methods are equally appropriate (or inappropriate) for the particular data set in question and, therefore, either of the chosen methods will yield similar results. If the normalization factors vary significantly, then one method may be better than the other. The challenge is to figure out which one to use. If the data set is generated from a large microarray containing thousands of gene sequences reflecting a broad range of cellular activities, the global method may be the most applicable. If the data set was generated from a focused microarray such as a set of invasion-related sequences that may be expected to be up or down regulated as a group, the housekeeping gene-based normalization may be more appropriate than the global average normalization. Clearly, an understanding of the underlying biology is important in making these decisions. If one analyzes the expression levels of several of the housekeeping genes in the RNA samples used in the microarray experiment (such as quantitative PCR or ribonuclease protection assays) one can determine if the expression levels of these genes are changing. The normalization method chosen should then result in the data for these housekeeping genes reflecting what is shown in the non-chip based analysis.
The rank invariant (algorithmic selection) method can be used to accommodate non-linear microarray data. The resulting normalization function can then be used to look at housekeeping gene expression levels and determine, as described above, if the resulting data agrees with the non-array based measurements. It can certainly be argued that independent verification of expression levels in a set of candidate invariant genes is important to validate any chosen normalization strategy.
62 Bilban et al.
including Affymetrix GeneChip assays and commercial scale microarray service contractors such as Incyte Pharmaceuticals (Freemont, CA).
In conclusion, we have discussed systematic variations inherent to 2-color labeling experiments with the distinct fluorophores Cy3 and Cy5. By re-scaling fluorescence ratios with a factor calculated from ratios of either all genes or a set of control genes, however, it is possible to minimize distortion of fluorescence ratios. Among other normalization methods, exogenous nucleic acids can be used to determine important parameters in cDNA microarray experiments, such as normalization, input to output ratios, signal linearity, hybridization specificity and hybridization consistency across an array.
Acknowledgements
This work was supported by NIH grants GM46902 and CA47858 to Vito Quaranta and grants 13321-MED (Austrian Science Foundation), 8339 (Austrian National Bank Vienna) both to Gernot Desoye.
References
Alizadeh, A.A., Eisen, M.B., Davis, R.E., Ma, C., Lossos, I.S., Rosenwald, A., Boldrick, J.C., Sabet, H., Tran, T., Yu, X., Powell, J.I., Yang, L., Marti, G.E., Moore, T., Hudson, J., Jr., Lu, L., Lewis, D.B., Tibshirani, R., Sherlock, G., Chan, W.C., Greiner, T.C., Weisenburger, D.D., Armitage, J.O., Warnke, R., and Staudt, L.M. 2000. Distinct types of diffuse large B-cell lymphoma identified by gene expression profiling. Nature 403: 503-511. Bartosiewicz, M., Trounstine, M., Barker, D., Johnston, R.,
and Buckpitt, A. 2000. Development of a toxicological gene array and quantitative assessment of this technology. Arch. Biochem. Biophys. 376: 66-73. Bilban, M., Head, S., Desoye, G., and Quaranta, V. 2000.
DNA microarrays: a novel approach to investigate genomics in trophoblast invasion—a review. Placenta. 21: Suppl A. S99-105.
Bittner, M., Meltzer, P., Chen, Y., Jiang, Y., Seftor, E., Hendrix, M., Radmacher, M., Simon, R., Yakhini, Z., Ben Dor, A., Sampas, N., Dougherty, E., Wang, E., Marincola, F., Gooden, C., Lueders, J., Glatfelter, A., Pollock, P., Carpten, J., Gillanders, E., Leja, D., Dietrich, K., Beaudry, C., Berens, M., Alberts, D., and Sondak, V. 2000. Molecular classification of cutaneous malignant melanoma by gene expression profiling. Nature. 406: 536-540.
Callow, M.J., Dudoit, S., Gong, E.L., Speed, T.P., and Rubin, E.M. 2000. Microarray expression profiling identifies genes with altered expression in HDL-deficient mice. Genome Res. 10: 2022-2029.
Camerer, E., Gjernes, E., Wiiger, M., Pringle, S., and Prydz, H. 2000. Binding of factor VIIa to tissue factor on keratinocytes induces gene expression. J. Biol. Chem. 275: 6580-6585.
Chambers, J., Angulo, A., Amaratunga, D., Guo, H., Jiang, Y., Wan, J.S., Bittner, A., Frueh, K., Jackson, M.R.,
Peterson, P.A., Erlander, M.G., and Ghazal, P. 1999. DNA microarrays of the complex human cytomegalovirus genome: profiling kinetic class with drug sensitivity of viral gene expression. J. Virol. 73: 5757-5766.
Cheung, V.G., Morley, M., Aguilar, F., Massimi, A., Kucherlapati, R., and Childs, G. 1999. Making and reading microarrays. Nat. Genet. 21: 15-19.
Claverie, J.M. 1999. Computational methods for the identification of differential and coordinated gene expression. Hum. Mol. Genet. 8: 1821-1832.
Cunningham, M.J., Liang, S., Fuhrman, S., Seilhamer, J.J., and Somogyi, R. 2000. Gene expression microarray data analysis for toxicology profiling. Ann. N. Y. Acad. Sci. 919: 52-67.
DeRisi, J.L., Iyer, V.R., and Brown, P.O. 1997. Exploring the metabolic and genetic control of gene expression on a genomic scale. Science. 278: 680-686.
Dhanasekaran, S.M., Barrette, T.R., Ghosh, D., Shah, R., Varambally, S., Kurachi, K., Pienta, K.J., Rubin, M.A., and Chinnaiyan, A.M. 2001. Delineation of prognostic biomarkers in prostate cancer. Nature. 412: 822-826. Duggan, D.J., Bittner, M., Chen, Y., Meltzer, P., and Trent,
J.M. 1999. Expression profiling using cDNA microarrays. Nat. Genet. 21: 10-14.
Eickhoff, B., Korn, B., Schick, M., Poustka, A., and van der, B.J. 1999. Normalization of array hybridization experiments in differential gene expression analysis. Nucl. Acids Res. 27: e33.
Eisen, M.B. and Brown, P.O. 1999. DNA arrays for analysis of gene expression. Meth. Enzymol. 303: 179-205. Heller, R.A., Schena, M., Chai, A., Shalon, D., Bedilion, T.,
Gilmore, J., Woolley, D.E., and Davis, R.W. 1997. Discovery and analysis of inflammatory disease-related genes using cDNA microarrays. Proc. Natl. Acad. Sci. U.S.A. 94: 2150-2155.
Hughes, T.R., Mao, M., Jones, A.R., Burchard, J., Marton, M.J., Shannon, K.W., Lefkowitz, S.M., Ziman, M., Schelter, J.M., Meyer, M.R., Kobayashi, S., Davis, C., Dai, H., He, Y.D., Stephaniants, S.B., Cavet, G., Walker, W.L., West, A., Coffey, E., Shoemaker, D.D., Stoughton, R., Blanchard, A.P., Friend, S.H., and Linsley, P.S. 2001. Expression profiling using microarrays fabricated by an ink-jet oligonucleotide synthesizer. Nat. Biotechnol. 19: 342-347.
Iyer, V.R., Eisen, M.B., Ross, D.T., Schuler, G., Moore, T., Lee, J.C., Trent, J.M., Staudt, L.M., Hudson, J., Jr., Boguski, M.S., Lashkari, D., Shalon, D., Botstein, D., and Brown, P.O. 1999. The transcriptional program in the response of human fibroblasts to serum. Science. 283: 83-87.
Kerr, M.K. and Churchill, G.A. 2001. Statistical design and the analysis of gene expression microarray data. Genet. Res. 77: 123-128.
Kerr, M.K., Martin, M., and Churchill, G.A. 2000. Analysis of variance for gene expression microarray data. J. Comput. Biol. 7: 819-837.
Kerr, Afshari, Bennett, Bushel, Martinez, Walker and Churchill. 2001. Statistical analysis of a gene expression microarray experiment with replication. Statistica Sinica. In press.
Importance of replication in microarray gene expression studies: statistical methods and evidence from repetitive cDNA hybridizations. Proc. Natl. Acad. Sci. U.S.A. 97: 9834-9839.
Lou, X.J., Schena, M., Horrigan, F.T., Lawn, R.M., and Davis, R.W. 2001. Expression monitoring using cDNA microarrays. A general protocol. Meth. Mol. Biol. 175: 323-340.
Luo, L., Salunga, R.C., Guo, H., Bittner, A., Joy, K.C., Galindo, J.E., Xiao, H., Rogers, K.E., Wan, J.S., Jackson, M.R., and Erlander, M.G. 1999. Gene expression profiles of laser-captured adjacent neuronal subtypes. Nat. Med. 5: 117-122.
Marton, M.J., DeRisi, J.L., Bennett, H.A., Iyer, V.R., Meyer, M.R., Roberts, C.J., Stoughton, R., Burchard, J., Slade, D., Dai, H., Bassett, D.E., Jr., Hartwell, L.H., Brown, P.O., and Friend, S.H. 1998. Drug target validation and identification of secondary drug target effects using DNA microarrays. Nat. Med. 4: 1293-1301.
Mills, J.C. and Gordon, J.I. 2001. A new approach for filtering noise from high-density oligonucleotide microarray datasets. Nucl. Acids Res. 29: E72.
Perou, C.M., Sorlie, T., Eisen, M.B., Van de, R.M., Jeffrey, S.S., Rees, C.A., Pollack, J.R., Ross, D.T., Johnsen, H., Akslen, L.A., Fluge, O., Pergamenschikov, A., Williams, C., Zhu, S.X., Lonning, P.E., Borresen-Dale, A.L., Brown, P.O., and Botstein, D. 2000. Molecular portraits of human breast tumours. Nature. 406: 747-752.
Roberts, C.J., Nelson, B., Marton, M.J., Stoughton, R., Meyer, M.R., Bennett, H.A., He, Y.D., Dai, H., Walker, W.L., Hughes, T.R., Tyers, M., Boone, C., and Friend, S.H. 2000. Signaling and circuitry of multiple MAPK pathways revealed by a matrix of global gene expression profiles. Science. 287: 873-880.
Ross, D.T., Scherf, U., Eisen, M.B., Perou, C.M., Rees, C., Spellman, P., Iyer, V., Jeffrey, S.S., Van de, R.M., Waltham, M., Pergamenschikov, A., Lee, J.C., Lashkari, D., Shalon, D., Myers, T.G., Weinstein, J.N., Botstein, D., and Brown, P.O. 2000. Systematic variation in gene expression patterns in human cancer cell lines. Nat. Genet. 24: 227-235.
Schena, M., Shalon, D., Davis, R.W., and Brown, P.O. 1995. Quantitative monitoring of gene expression patterns with a complementary DNA microarray. Science 270: 467-470. Schena, M., Shalon, D., Heller, R., Chai, A., Brown, P.O., and Davis, R.W. 1996. Parallel human genome analysis: microarray-based expression monitoring of 1000 genes. Proc. Natl. Acad. Sci. U.S.A. 93: 10614-10619.
Schuchhardt, J., Beule, D., Malik, A., Wolski, E., Eickhoff, H., Lehrach, H., and Herzel, H. 2000. Normalization strategies for cDNA microarrays. Nucl. Acids Res. 28: E47.
Seftor, R.E., Seftor, E.A., Koshikawa, N., Meltzer, P.S., Gardner, L.M., Bilban, M., Stetler-Stevenson, W.G., Quaranta, V., and Hendrix, M.J. 2001. Cooperative interactions of laminin 5 gamma2 chain, matrix metalloproteinase-2, and membrane type-1-matrix/ metalloproteinase are required for mimicry of embryonic vasculogenesis by aggressive melanoma. Cancer Res. 61: 6322-6327.
Snijders, A.M., Meijer, G.A., Brakenhoff, R.H., van den
Brule, A.J., and van Diest, P.J. 2000. Microarray techniques in pathology: tool or toy? Mol. Pathol. 53, 289-294.
Stingley, S.W., Ramirez, J.J., Aguilar, S.A., Simmen, K., Sandri-Goldin, R.M., Ghazal, P., and Wagner, E.K. 2000. Global analysis of herpes simplex virus type 1 transcription using an oligonucleotide-based DNA microarray. J. Virol. 74: 9916-9927.
Tanaka, T.S., Jaradat, S.A., Lim, M.K., Kargul, G.J., Wang, X., Grahovac, M.J., Pantano, S., Sano, Y., Piao, Y., Nagaraja, R., Doi, H., Wood, W.H., III, Becker, K.G., and Ko, M.S. 2000. Genome-wide expression profiling of mid-gestation placenta and embryo using a 15, 000 mouse developmental cDNA microarray. Proc. Natl. Acad. Sci. U.S.A. 97: 9127-9132.
Taniguchi, M., Miura, K., Iwao, H., and Yamanaka, S. 2001. Quantitative assessment of DNA microarrays— comparison with Northern blot analyses. Genomics. 71: 34-39.
Tseng, G.C., Oh, M.K., Rohlin, L., Liao, J.C., and Wong, W.H. 2001. Issues in cDNA microarray analysis: quality filtering, channel normalization, models of variations and assessment of gene effects. Nucl. Acids Res. 29: 2549-2557.
van Hal, N.L., Vorst, O., van Houwelingen, A.M., Kok, E.J., Peijnenburg, A., Aharoni, A., van Tunen, A.J., and Keijer, J. 2000. The application of DNA microarrays in gene expression analysis. J. Biotechnol. 78: 271-280. Venables, W.N. and Ripley, B.D. 1998. Modern Applied
Statistics with S-PLUS. 2nd Edn. Springer, New York, NY. Welsh, J.B., Sapinoso, L.M., Su, A.I., Kern, S.G., Wang-Rodriguez, J., Moskaluk, C.A., Frierson, H.F., Jr., and Hampton, G.M. 2001. Analysis of gene expression identifies candidate markers and pharmacological targets in prostate cancer. Cancer Res. 61: 5974-5978. Werb, Z. 1997. ECM and cell surface proteolysis: regulating
cellular ecology. Cell. 91: 439-442.
Wurmbach, E., Yuen, T., Ebersole, B.J., and Sealfon, S.C. 2001. Gonadotropin releasing hormone receptor-coupled gene gene network organization. J. Biol. Chem. 276: 47195-47201.
Yang, Y.H., Dudoit, S., Luu, P., and Speed, T. P. 2001a. Normalization for cDNA microarray data. In: Microarrays: Optical Technologies and Informatics, Vol. 4266 of Proceedings of SPIE. M. L. Bittner, Y. Chen, A. N. Dorsel, and E. R. Dougherty eds. Spie Press. Bellingham, WA USA.
Yang, M.C., Ruan, Q.G., Yang, J.J., Eckenrode, S., Wu, S., McIndoe, R.A., and She, J.X. 2001b. A statistical method for flagging weak spots improves normalization and ratio estimates in microarrays. Physiol. Genomics. 7: 45-53.
Young, R.A. 2000. Biomedical discovery with DNA arrays. Cell. 102: 9-15.
Yu, Z., Ford, B.N., and Glickman, B.W. 2000. Identification of genes responsive to BPDE treatment in HeLa cells using cDNA expression assays. Environ. Mol. Mutagen. 36: 201-205.
64 Bilban et al.
• MALDI-TOF Mass Spectrometry in Microbiology
Edited by: M Kostrzewa, S Schubert (2016)
www.caister.com/malditof
• Aspergillus and Penicillium in the Post-genomic Era
Edited by: RP Vries, IB Gelber, MR Andersen (2016)
www.caister.com/aspergillus2
• The Bacteriocins: Current Knowledge and Future Prospects
Edited by: RL Dorit, SM Roy, MA Riley (2016)
www.caister.com/bacteriocins
• Omics in Plant Disease Resistance
Edited by: V Bhadauria (2016)
www.caister.com/opdr
• Acidophiles: Life in Extremely Acidic Environments
Edited by: R Quatrini, DB Johnson (2016)
www.caister.com/acidophiles
• Climate Change and Microbial Ecology: Current Research and Future Trends
Edited by: J Marxsen (2016)
www.caister.com/climate
• Biofilms in Bioremediation: Current Research and Emerging Technologies
Edited by: G Lear (2016)
www.caister.com/biorem
• Microalgae: Current Research and Applications
Edited by: MN Tsaloglou (2016)
www.caister.com/microalgae
• Gas Plasma Sterilization in Microbiology: Theory, Applications, Pitfalls and New Perspectives
Edited by: H Shintani, A Sakudo (2016)
www.caister.com/gasplasma
• Virus Evolution: Current Research and Future Directions
Edited by: SC Weaver, M Denison, M Roossinck, et al. (2016)
www.caister.com/virusevol
• Arboviruses: Molecular Biology, Evolution and Control
Edited by: N Vasilakis, DJ Gubler (2016)
www.caister.com/arbo
• Shigella: Molecular and Cellular Biology
Edited by: WD Picking, WL Picking (2016)
www.caister.com/shigella
• Aquatic Biofilms: Ecology, Water Quality and Wastewater Treatment
Edited by: AM Romaní, H Guasch, MD Balaguer (2016)
www.caister.com/aquaticbiofilms
• Alphaviruses: Current Biology
Edited by: S Mahalingam, L Herrero, B Herring (2016)
www.caister.com/alpha
• Thermophilic Microorganisms
Edited by: F Li (2015)
www.caister.com/thermophile
• Flow Cytometry in Microbiology: Technology and Applications
Edited by: MG Wilkinson (2015)
www.caister.com/flow
• Probiotics and Prebiotics: Current Research and Future Trends
Edited by: K Venema, AP Carmo (2015)
www.caister.com/probiotics
• Epigenetics: Current Research and Emerging Trends
Edited by: BP Chadwick (2015)
www.caister.com/epigenetics2015
• Corynebacterium glutamicum: From Systems Biology to Biotechnological Applications
Edited by: A Burkovski (2015)
www.caister.com/cory2
• Advanced Vaccine Research Methods for the Decade of Vaccines
Edited by: F Bagnoli, R Rappuoli (2015)
www.caister.com/vaccines
• Antifungals: From Genomics to Resistance and the Development of Novel Agents
Edited by: AT Coste, P Vandeputte (2015)
www.caister.com/antifungals
• Bacteria-Plant Interactions: Advanced Research and Future Trends
Edited by: J Murillo, BA Vinatzer, RW Jackson, et al. (2015)
www.caister.com/bacteria-plant
• Aeromonas
Edited by: J Graf (2015)
www.caister.com/aeromonas
• Antibiotics: Current Innovations and Future Trends
Edited by: S Sánchez, AL Demain (2015)
www.caister.com/antibiotics
• Leishmania: Current Biology and Control
Edited by: S Adak, R Datta (2015)
www.caister.com/leish2
• Acanthamoeba: Biology and Pathogenesis (2nd edition)
Author: NA Khan (2015)
www.caister.com/acanthamoeba2
• Microarrays: Current Technology, Innovations and Applications
Edited by: Z He (2014)
www.caister.com/microarrays2
• Metagenomics of the Microbial Nitrogen Cycle: Theory, Methods and Applications
Edited by: D Marco (2014)
www.caister.com/n2
Caister Academic Press is a leading academic publisher of
advanced texts in microbiology, molecular biology and medical research. Full details of all our publications at caister.com