DOI: 10.30954/0424-2513.2018.00150.19
©2018 New Delhi Publishers. All rights reserved
Cluster Analysis of Wine Market Segmentation – A Consumer
Based Study in the Mid-Atlantic USA
Ramu Govindasamy
1*, Surendran Arumugam
2, Jingkun Zhuang
1, Kathleen M. Kelley
3and Isaac Vellangany
11Department of Agricultural, Food and Resource Economics, Rutgers -The State University of New Jersey 2Imayam Institute of Agriculture & Technology, Thuraiyur, Tiruchirappalli, Tamil Nadu, India
3Department of Plant Science, The Pennsylvania State University, USA *Corresponding author: [email protected]
ABSTRACT
The U.S. wine market has been steadily increasing over the past 15 years. The number of wineries has increased from 2688 in 1999 to 8862 in 2016. About 7% of all those wineries are located in the Mid-Atlantic region, which includes New Jersey, New York, and Pennsylvania. However, competition has been rising as the market is growing. Many foreign wine companies from Europe, South America, and Oceania, are either selling or planning to sell their products to the fast-growing U.S. wine market. It is important to promote local wine industry in the U.S. In this connection, this study has attempted to predict the segment of Mid-Atlantic wine market - based on purchasing behavior, attitudes, and social demographic attributes. A Cluster Analysis used to segment the Mid-Atlantic wine market into four clusters namely Class 1 Detractors, Class 2 Enthusiasts, Class 3 Neutral and Class 4 Advocators. Class 1. Detractors are the cluster that is the most unlikely to buy local wine. Neatly, 67.4% of Detractors indicated that they had never obtained local wine before. 2. Enthusiasts and Class 4 Advocators are the target market of Mid-Atlantic local wineries and hence we should pay more attention to these two market segments. 74.5% of Class 2 indicated that they had bought wine from the Mid-Atlantic wine region. About 60% of Class 4 Advocators stated that they had purchased local wine before. The characteristics of Class 4 are very similar to Class 2. The chance of Class 3 Neutral to buy local wine is 50/50. They drink and buy wine more frequently than consumers in other clusters. Typically, we do not recommend Mid-Atlantic wineries to target this market segment, unless they want to expand their market beyond Class 2 and Class 4. The assessment of perception of consumers will help the producers, wholesalers, and retailers to target ultimate consumers and specific market segments.
Keywords: Wine, Purchase Behavior, Consumer Behavior, Logistic Regression, Cluster Analysis, Market Segmentation, Marketing Strategy, Decision Making, Mid-Atlantic, NY, NJ, PA.
In 1975, many considered the U.S. wine business still as a backwater — quiet but soon to make some big waves. The consumption estimated to
31.8 mhl (Millions of Hectolitres/1 Hectolitre =
100 liters) in 2016, confirmed its position as the top global consumer since 2011, and saw growing
domestic demand around 31.0 mhl compared with 2015 consumption (+2.5% of change) (OIV- International Organization of Vine and Wine, 2017).
The prediction of sales growth ranges from 10 to
14 per cent for the premium wine segment in 2017,
up from nine to 13 per cent in 2016 (McMillan,
2017). The research conducted related to wine consumption in several countries and the consumer
purchasing behavior (Bruwer et al. 2014, Goldsmith et al. 1998; Goldsmith and Hofacker, 1991; Orth and
Bourrain, 2005a).
In the U.S, wine consumer behavior exhibits different aspects of an individual that influence
the consumer’s final choice in the decision-making
accounted for the most significant volume of wine sales since 2010 (Wine Institute, 2014). A consumer’s perceptions, attitudes, and characteristics influence purchasing decision (Brager, 2014; Janeen et al. 2015). Similarly, wine consumer’s level of knowledge and
experience in purchasing wine can also affect their choice (Mitchell & Greatorex, 1989; O’Cass and McEwen, 2004; Miller and Chadee, 2008; Janeen et al. 2015). In addition, demographic characteristics
of consumers play a significant role in the wine consuming decision (Dodd, 1995; Dodd, Laverie, Wilcox, & Duhan, 2005; Johnson & Bastian, 2007;
Janeen et al. 2015). Likewise, People of different
marital status have differences in their alcohol consumption. The alcohol consumption either increases or decreases as people’s marital status
varies (Power, Rodgers, & Hope, 1999).
In particular, region was more important for high involvement consumers and price was more important for low involvement consumers. Many studies used simulated choices to measure the importance of price, region, brand, and awards
(Oliver, 1999; Lockshin et al. 2006; Miller and
Chadee, 2008; Ha and Jang, 2013). Previous
experience, personal recommendations, and the
taste of the wine were the significant factors, also
preferences based on age, involvement level, and
the geographical part influenced wine consumers purchasing decision (Casini et al. 2009; Janeen et al. 2015). Regarding wine purchasing, online wine
purchases were of higher priced wines, and the size of the shopping basket was more substantial in the online environment, probably because of the
shipping charges for 6 or 12 bottles. A review of the
postal code of the online purchasers compared to a separate sample of in-store purchasers showed the online purchasers tended to live in city centers, where parking and transporting wine would be difficult. The authors speculated that online
purchases were aimed at expensive and hard to find
wines, whereas in-store purchases were convenient
(Stening and Lockshin, 2001). In addition, there are differences among online wine buyers, where
some are very comfortable buying online, and
others are not (Bressolles and Durrieu (2010).
This contradicts the result of the study which
was published by Bruwer and Lesschaeve (2012) about the socio-demographic profile, attitudes, and perceptions of tourists at the winery (Alebaki and Iakovidou, 2011; Kolyesnikova and Dodd, 2008; Gill
et al. 2007). There is evidence that tourism benefits
winery substantially, but attracting tourists is similar to drawing any other type of buyer: higher involvement and heavier buyers are more likely to visit and buy wine.
In general, ranges of several factors affect consumers’ purchasing behavior, which leads to difference in
ways in which consumers’ approach wines.
Socio-demographic differences, personal characteristics,
and sensory preferences are essential to distinguish new from longer-term wine buyers. Therefore, it is crucial to understand consumers’ behavior for wine and it adds some commentary about the way forward and a discussion to provide the most usable results for the development of marketing in the Mid-Atlantic wine sector. Against this
background, this study has attempted to predict
the segment of Mid-Atlantic wine market based
on the purchasing behavior, attitudes, and social demographic attributes. The findings of this study may be useful to local wineries to understand better
the wine consumers purchasing behavior, beliefs, and social demographic characteristics to target specific wine market target in the mid-Atlantic region of the United States.
Methodology
The central research question is about how to target this wine market segment in the Mid-Atlantic region. We can refine this question into several small objectives. To identify the demographics and behaviors that describe Mid-Atlantic wine buyers. To identify wine consumers’ preferences on different wine attributes. To segment wine consumers into several groups and study the characteristics of each group. This study used the data that Penn State University collected via internet survey in 2009. This survey helped us to quantify consumer wine purchases and preferred varieties, identify the demographics and behaviors that describe Mid-Atlantic wine buyers. This study especially investigated consumer segmentation by
employing Cluster Analysis (Punj, 1983; Donald et al. 1997). More discussions were made on how to maintain business with current buyers, as well as how to target other less likely buyers by giving an understanding of their preferences.
The marketing cost is one of the concerns of local
the marketing strategy is dependent upon targeting an entire mass market. The importance of market segmentation is that it allows a business to target
consumers with specific needs and wants (Donald et al. 1997; Hofstede et al. 1999; Antreas, 2000;
Bruwer, J. & Li E., 2007; Torres & Kunc, 2016). In the end, this benefits the company because they can use their corporate resources more efficiently and make better strategic marketing decisions. In this section, we employed Cluster Analysis to class wine consumers into several groups. Different groups will have different demographics and preferences.
Many cluster analysis methods are available out there. We used the hclust function in R to achieve
the hierarchical clustering (Ward, 1963). We used
the Ward linkage when applying the hierarchical clustering. The hierarchical clustering method
defines the cluster distance between two clusters to
be the maximum distance between their individual components. At every stage of the clustering process, the two nearest groups were merged into a new cluster. The process is repeated until the whole data set is agglomerated into one single
cluster (Kaufman and Rousseeuw, 1990; Legendre and Legendre, 2012).
Two-Way Contingency and Chi-Square
Independence Test of Wine Consumer Clusters To study the differences between the four market segments, we performed Cluster Analysis, a two-way contingency table and Chi-square independence tests. The Chi-square independence test is to test
whether two variables are associated or not. In the case of the state variable, our hypotheses are:
H0: State and Wine Consumer Clusters are not
associated.
H1: State and Wine Consumer Clusters are
associated.
The idea behind the chi-square independence test is to compare the observed frequencies with the frequencies we would expect if the null hypothesis
of non-association is correct. Equation (1) is the test statistic used for this comparison. Represents the
expected frequencies whereas refers to observed
frequencies. Equation (2) was used to estimate E.
χ2 = Σ(O– E)2 / E …(1)
E = row* column / n …(2)
The two-way contingency table shows us the distribution of the data in each group, which allows
us to compare the difference of the levels in the
categorical variables in each group. Based on the
two-way contingency table, derived the Chi-square
tests to test if each of the variables is associated with the response variable.
RESULTS AND DISCUSSION
Fig. 1 is the dendrogram of our cluster analysis. From the dendrogram, it is not very clear about how many clusters can be chosen. It can be cut at
2, or 3 or 4 clusters.
Fig. 1: Dendrogram of Cluster Analysis
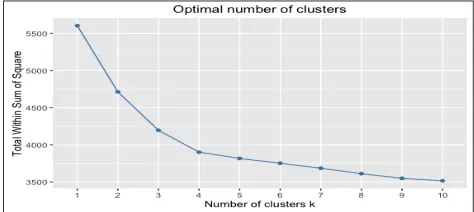
To decide the optimal number of clusters, we plotted
an elbow plot as shown in Fig. 2. The elbow is very clear; it appears at the fourth cluster.
Fig. 2: Elbow plot of optimal number of clusters
According to the elbow plot, we chose to keep four
clusters. We employed a simple ANOVA to test whether there were significant differences between any two classes. ANOVA results as below shows that there is significant difference at least between
two classes.
Df Sum Sq. Mean Sq. F value Pr(>F)
Class 3 5.71 1.9049 7.739 4.01E-05 ***
Fig. 3: Dendrogram of 4 clusters
Table 1 is a cross table of the BUY variable and wine
consumer clusters. 67.4% of Class1 do not buy local wine, which means Class-1 is very unlikely to buy
local wine, so we named this class as Detractors. 74.5% of Class-2 buys local wine. This is a very high percentage. We call Class-2 Enthusiasts. The
third class is considered as Neutral since about
50% of Class-3 buys local wine. The last class has 59.3% who purchases local wine. It is not as high as Class-2 but is still more likely to buy local wine compared to Class-1 and Class-3.
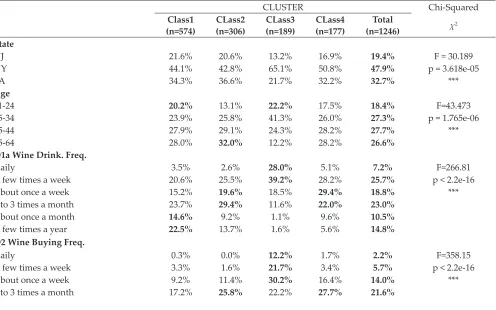
In Table 2, we can see that the Chi-Squared test
results for state, age, income, education, and marital
status are significantly related to the wine consumer
clusters.
Table 3 contain variables that were tested to be statistically significant. Demographics such as state,
age, gender, education, income, occupation and marital status are all associated with the market
Table 1: Cross table of BUY variable and clusters
BUY
Class1
Detractors
(n=574)
CLass2
Enthusiasts
(n=306)
CLass3
Neutral
(n=189)
CLass4
Advocators
(n=177)
Total (N=1246)
YES 32.6% 74.5% 49.2% 59.3% 49.2%
NO 67.4% 25.5% 50.8% 40.7% 50.8%
Table 2: Contingency Table and Independence Test of Wine Consumer Clusters
CLUSTER Chi-Squared
Class1
(n=574) CLass2 (n=306) (n=189)CLass3 (n=177)CLass4 (n=1246)Total χ2 State
NJ 21.6% 20.6% 13.2% 16.9% 19.4% F = 30.189
NY 44.1% 42.8% 65.1% 50.8% 47.9% p = 3.618e-05
PA 34.3% 36.6% 21.7% 32.2% 32.7% ***
Age
21-24 20.2% 13.1% 22.2% 17.5% 18.4% F=43.473
25-34 23.9% 25.8% 41.3% 26.0% 27.3% p = 1.765e-06
35-44 27.9% 29.1% 24.3% 28.2% 27.7% ***
45-64 28.0% 32.0% 12.2% 28.2% 26.6%
Q1a Wine Drink. Freq.
Daily 3.5% 2.6% 28.0% 5.1% 7.2% F=266.81
A few times a week 20.6% 25.5% 39.2% 28.2% 25.7% p < 2.2e-16
About once a week 15.2% 19.6% 18.5% 29.4% 18.8% ***
2 to 3 times a month 23.7% 29.4% 11.6% 22.0% 23.0%
About once a month 14.6% 9.2% 1.1% 9.6% 10.5%
A few times a year 22.5% 13.7% 1.6% 5.6% 14.8%
Q2 Wine Buying Freq.
Daily 0.3% 0.0% 12.2% 1.7% 2.2% F=358.15
A few times a week 3.3% 1.6% 21.7% 3.4% 5.7% p < 2.2e-16
About once a week 9.2% 11.4% 30.2% 16.4% 14.0% ***
Table 3: Profile of Wine Consumer Clusters
Class1 Detractors
Class2 Enthusiasts
Class3 Neutral
Class4 Advocators
State — More PA, less NY 63% is from NY 53% is from NY, less PA than average
Age — Oldest Youngest mid-age
Drinking Freq. Least frequent Slightly less frequent than average Most frequent, heavy wine drinkers Moderate wine drinkers
Buying Freq. Least frequent Slightly less frequent than average Most frequent. Moderate
First Drink was
wine 25%YES, lower than average (33%) 26% YES, lower than average 65% YES, 37% YES
Gender 75% female 65% female 37% female 58% female
Education lower higher higher higher
Family Income Lowest middle middle Highest
Occupation More retired and unemployed More retired and unemployed Less retired &unemployed Less retired and unemployed
Marital Status Slightly more married Slightly more single Somewhat more single
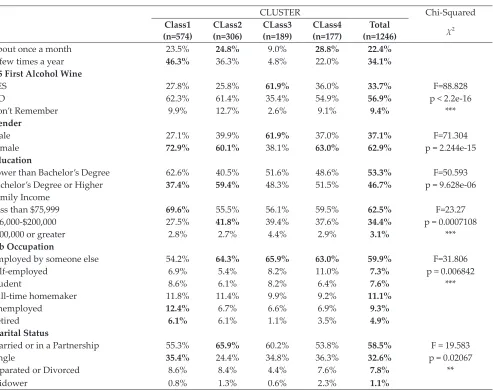
CLUSTER Chi-Squared
Class1
(n=574) CLass2 (n=306) (n=189)CLass3 (n=177)CLass4 (n=1246)Total χ2
About once a month 23.5% 24.8% 9.0% 28.8% 22.4%
A few times a year 46.3% 36.3% 4.8% 22.0% 34.1%
Q5 First Alcohol Wine
YES 27.8% 25.8% 61.9% 36.0% 33.7% F=88.828
NO 62.3% 61.4% 35.4% 54.9% 56.9% p < 2.2e-16
Don’t Remember 9.9% 12.7% 2.6% 9.1% 9.4% ***
Gender
Male 27.1% 39.9% 61.9% 37.0% 37.1% F=71.304
Female 72.9% 60.1% 38.1% 63.0% 62.9% p = 2.244e-15
Education
Lower than Bachelor’s Degree 62.6% 40.5% 51.6% 48.6% 53.3% F=50.593
Bachelor’s Degree or Higher 37.4% 59.4% 48.3% 51.5% 46.7% p = 9.628e-06
Family Income
Less than $75,999 69.6% 55.5% 56.1% 59.5% 62.5% F=23.27
$76,000-$200,000 27.5% 41.8% 39.4% 37.6% 34.4% p = 0.0007108
$200,000 or greater 2.8% 2.7% 4.4% 2.9% 3.1% ***
Job Occupation
Employed by someone else 54.2% 64.3% 65.9% 63.0% 59.9% F=31.806
Self-employed 6.9% 5.4% 8.2% 11.0% 7.3% p = 0.006842
Student 8.6% 6.1% 8.2% 6.4% 7.6% ***
Full-time homemaker 11.8% 11.4% 9.9% 9.2% 11.1%
Unemployed 12.4% 6.7% 6.6% 6.9% 9.3%
Retired 6.1% 6.1% 1.1% 3.5% 4.9%
Marital Status
Married or in a Partnership 55.3% 65.9% 60.2% 53.8% 58.5% F = 19.583
Single 35.4% 24.4% 34.8% 36.3% 32.6% p = 0.02067
Separated or Divorced 8.6% 8.4% 4.4% 7.6% 7.8% **
segments that we derived from Cluster Analysis.
There is a correlation between buying and drinking frequency with our market clusters.
Most of Class1 the Detractors are infrequent wine
drinkers. They tend to have lower education level
and less income. Most of Class2 the Enthusiasts are in their 40’s and 50’s. They are moderate wine
drinkers. Usually, they drink wine once a week or two to three times a month. They tend to have a higher education level and mid-level income. Many of them are married or in a partnership at least.
Class3 Neutral are frequent wine drinkers. Most of them are in their 20’s and 30’s. They also have a
higher education level and mid-level income like
Class2. Many of them are male. Class2 Advocators
are moderate wine drinkers. They tend to have a higher education level and the highest income compared to other classes. Many of them are single.
Class 2 the Enthusiasts and Class4, the Advocators,
are the target market of local wineries. If local
wineries want to target larger markets, Class3
the Neutral can also be a likely potential market.
However, Class1 the Detractors is the market
segment that local wineries should avoid.
CONCLUSION
We have employed cluster techniques to address local wine market segments in the Mid-Atlantic region. This paper classified local wine market
into four clusters namely Class1 Detractors, Class2 Enthusiasts, Class3 Neutral and Class4 Advocators.
Segment of Unlikely Buyers - Class1 Detractors
Class1 Detractors is the cluster that is the most
unlikely to buy local wine. Mid-Atlantic wineries should avoid this market segment when designing
marketing strategies. 67.4% of Class1 Detractors
indicated that they had never bought local wine
before. Consumers in this cluster are infrequent wine drinkers. Compared to other clusters, less of Class1 Detractors have a Bachelor’s degree. Besides,
they tend to have a lower income level.
Segments of Likely Buyers- Class2 Enthusiasts and Class4 Advocators
Class2 Enthusiasts and Class4 Advocators are
the target market of Mid-Atlantic local wineries.
More attention should be paid to these two market segments. Class2 Enthusiasts are the most likely
to purchase local wine compared to other three
clusters. 74.5% of Class2 indicated that they had
bought wine from the Mid-Atlantic wine region.
Most of the Class2 Enthusiasts are in their 40s or 50s. They are moderate wine drinkers (once a week, or 2 to 3 times a week). Many of them have
bachelor’s degree or a higher education level. They tend to have a mid-income level as well. About 60%
of Class4 Advocators stated that they had bought local wine before. The characteristics of Class4 are very similar to Class2. Many of them are moderate
wine drinkers with a Bachelor’s degree. However,
unlike many of Class2, they are married or in a partnership, while most of Class4 are single.
Segment of Neutral Buyers - Class3 Neutral
The chance of Class3 Neutral to buy local wine is 50/50. Most consumers in Class3 are males in their 20s or 30s. They drink and buy wine more
frequently than consumers in other clusters buy. Many of them hold a Bachelor’s degree and have a mid-income level. Typically, we do not recommend Mid-Atlantic wineries to target this market segment, unless they want to expand their market beyond
Class2 and Class4. The results provide implications
for wine market to target ultimate consumers and
specific market segments, including offering wine
brands with a wider array of varietals, various price tiers, creative packaging and sustainable messages in their presentation. However, further research will be needed to examine the relationships between on-farm wine production and location, land and operator characteristics, the mix of products and marketing outlets, and relative costs and returns associated with wine industries.
REFERENCES
Alebaki, M. and Iakovidou, O. 2011. Market segmentation in wine tourism: a comparison of approaches. Tourisms: An International Multidisciplinary Journal of Tourism,6: 123–140. Antreas D. Athanassopoulos, 2000. Customer Satisfaction
Cues To Support Market Segmentation and Explain Switching Behavior, Journal of Business Research, 47(3): 91-207.
Brager, D. 2014. Nielsen presentation on US off-premise wine sales, Wine Market Council 9th Annual Presentation of
US Wine Consumer Trends, Santa Rosa, CA, January-2014. Bressolles, G. and Durrieu, F. 2010. A typology of online
Bruwer, J., Buller, C., Saliba, A.J. and Li, E. 2014. Country-of-origin (COO) brand loyalty and related consumer behavior in the Japanese wine market, International Journal of Wine Business Research, 26(2): 97-119.
Bruwer, J. and Li, E. 2007. Wine-related lifestyle (WRL) market segmentation: Demographic and behavioral factors. Journal of Wine Research, 18(1): 19–34.
Bruwer, J. and Lesschaeve, I. 2012. Wine tourists’ destination region brand image perception and antecedents: conceptualization of a wines cape framework, Journal of Travel and Tourism Marketing, 29: 611–628.
Casini, L., Corsi, A.M. and Goodman, S. 2009. Consumer preferences of wine in Italy applying best-worst scaling,
International Journal of Wine Business Research,21: 64–78. Dodd, Tim H. 1995. Opportunities and pitfalls of tourism in
developing wine industry. International Journal of Wine Marketing, 7(1): 5-16.
Donald, R. Lichtenstein Scot Burton, Richard G. Netemeyer., 1997. An examination of deal proneness across sales promotion types: A consumer segmentation perspective,
Journal of Retailing,73(2): 283-297.
Gill, D., Byslma, B. and Ouschan, R. 2007. Customer perceived value in a cellar door visit: the impact on behavioral intentions, International Journal of Wine Business Research,
19: 257–275.
Goldsmith, R.E., d’Hauteville, F. and Flynn, L.R. 1998. Theory and measurement of consumer innovativeness: a transnational evaluation, European Journal of Marketing,
32(3/4): 340-353.
Goldsmith, R.E. and Hofacker, C.H. 1991. Measuring consumer innovativeness, Journal of the Academy of Marketing Science,19(3): 209-221.
Ha, J. and Jang, S.C. 2013. Determinants of diners’ variety seeking intentions”, Journal of Services Marketing, 27(2): 155-165.
Hofstede, F., Jan-Benedict, E.M. Steenkamp, and Wedel, M. 1999. International Market Segmentation Based on Consumer-Product Relations, Journal of Marketing Research, 36(1): 1-17.
Janeen E. Olsen, Tom Atkin, Liz Thach, Steve S. Cuellar, 2015. Variety seeking by wine consumers in the southern states of the US”, International Journal of Wine Business Research,
27(4): 260-280.
Johnson, Trent E. and Bastian, Susan, E.P. 2007. A preliminary study of the relationship between Australian wine consumers’ wine expertise and their wine purchasing and consumption behavior. Australian Journal of Grape and Wine Research, 13(3): 186-197.
Kaufman, L. and Rousseeuw, P.J. 1990. Finding Groups in Data: An Introduction to Cluster Analysis, Wiley. Kolyesnikova, N., Dodd, T.H., 2008. Effects of winery visitor
group size on gratitude and obligation, Journal of Travel Research 47, 104–112.
Legendre, P. and Legendre, L. 2012. Numerical Ecology, 3rd ed., Elsevier.
Lockshin, L., Jarvis, W., d’Hauteville, F., Perrouty, J. 2006. Using simulations from discrete choice experiments to measure consumer sensitivity to the brand, region, price, and awards in wine choice, Food Quality and Preference,
17: 166–178.
McMillan, Rob. 2017. State of the Wine Industry 2017, Silicon Valley Bank (SVB), Silicon Valley Bank Wine Division, St Helena, CA 94574.
Miller, K. and Chadee , D. 2008. The relevance and irrelevance of the brand for small and medium wine enterprises, Small Enterprise Research, 16(2): 32-44.
Mitchell, Vincent-Wayne, & Greatorex, Michael, 1989. Risk reducing strategies used in the purchase of wine in the UK. European Journal of Marketing, 23(9): 31-46.
O’Cass, A. and McEwen, H. 2004. Exploring consumer status and conspicuous consumption”, Journal of Consumer Behavior4(1): 25-39.
odd, Tim H, Laverie, Debra A, Wilcox, James F. and Duhan, Dale F. 2005. Differential effects of experience, subjective knowledge, and objective knowledge on sources of information used in consumer wine purchasing, Journal of Hospitality & Tourism Research, 29(1): 3-19.
OIV. 2017. International Organization of Vine and Wine trade press, Global Economic Vitiviniculture Data, International Organization of Vine and Wine, 18, Rue d’Aguesseau 75008 Paris, France – 24th October 2017.
Oliver, R.L. 1999. Whence consumer loyalty? Journal of Marketing, 63: 33-44.
Orth, U.R. and Bourrain, A. 2005a, Optimum stimulation level
theory and the differential impact of olfactory stimuli on consumer exploratory tendencies, Advances in Consumer Research, 32: 613-619.
Power, Chris, Rodgers, Bryan, & Hope, Steven. 1999. Heavy alcohol consumption and marital status: disentangling the relationship in a national study of young adults. Addiction,
94(10): 1477-1487.
Punj, G. and Stewart, D. 1983. Cluster Analysis in Marketing Research: Review and Suggestions for Application, Journal of Marketing Research, 20(2): 134-148.
Stening, S. and Lockshin, L. 2001. A Comparison of On-Line and In-Store Customers in the Wine Retail Sector. Special Wine Marketing Supplement to the Australian and New Zealand Wine Industry Journal,16(6): 138-144.
Torres, Juan Pablo & Martin H. Kunc., 2016. Market opportunity recognition in the Chilean wine industry: traditional versus relational marketing approaches, 19-33 | Received 24 Oct 2014.
Ward, J.H. 1963. Hierarchical grouping to optimize an objective function, Journal of the American Statistical Association,58: 236-244.
Wine Institute, 2016. 2015 California Wine Sales in U.S. Hit $31.9 Billion Retail Value, Jul 8, 2016, http://www. wineinstitute.org/resources/pressroom/07082016. Wine Institute. 2015. Wine Consumption in the U.S., August