World Maritime University
The Maritime Commons: Digital Repository of the World
Maritime University
World Maritime University Dissertations Dissertations
2016
Analysis of productivity in dredging project A case
study in Port of Tanjung Perak Surabaya –
Indonesia
Tiggi P. Hardya World Maritime University
Follow this and additional works at:http://commons.wmu.se/all_dissertations
This Thesis is brought to you courtesy of Maritime Commons. Open Access items may be downloaded for non-commercial, fair use academic purposes. No items may be hosted on another server or web site without express written permission from the World Maritime University. For more information, please [email protected].
Recommended Citation
Hardya, Tiggi P., "Analysis of productivity in dredging project A case study in Port of Tanjung Perak Surabaya – Indonesia" (2016).
WORLD MARITIME UNIVERSITY
Malmö, SwedenANALYSIS OF PRODUCTIVITY IN
DREDGING PROJECT
A case study in Port of Tanjung Perak
Surabaya - Indonesia
By
TIGGI PERKASA HARDYA
Indonesia
A dissertation submitted to the World Maritime University in partial
Fulfillment of the requirements for the award of the degree of
MASTER OF SCIENCE
In
MARITIME AFFAIRS
(PORT MANAGEMENT)
ii
DECLARATION
I certify that all the material in this dissertation that is not my own work has been identified, and that no material is included for which a degree has previously been conferred on me.
The contents of this dissertation reflect my own personal views, and are not necessarily endorsed by the University.
(Signature): ... (Date): ...
Supervised by: Professor Devinder Grewal, MS.c., Ph.D
World Maritime University
Assessor: Professor Michael Ircha, MPI., MPA., Ph.D
iii
ACKNOWLEDGMENTS
All praise and thanks are due to the Allah, the Almighty, the greatest of all, on whom ultimately we depend for sustenance and guidance. I would like to thank Almighty Allah for giving me opportunity, determination and strength to do my dissertation. His continuous grace and mercy was with me throughout my life and ever more during the tenure of my dissertation.
First and foremost I would like to thank and express my deep and sincere gratitude to my supervisor Professor Devinder Grewal Msc., Ph.D for his incessant support, encouragement and the guidance in the supervision of this dissertation. I have been extremely lucky to have a supervisor who cared so much about my work, and who responded to my questions and queries so promptly.
I would like also to convey my sincere thanks to Indonesia Port Corporation III (IPC III), especially to Mr Djarwo Surjanto (Former CEO of IPC III) and Mr Toto Heli Yanto (Human Capital and General Affair Director of IPC III) for sponsoring my studies here at World Maritime University. I must express my gratitude to Mr Margo Marsono (Former Senior Manager of Education and Training of IPC III), for giving me the excellent opportunity to continuing education to a higher level.
I would like to present my sincere thankfulness to my dear mother Dya Rintara and my deceased father Ir. Hardoyo Notobudoyo, who had passed away since a long time (I miss you dad), for their great role in my life and their numerous sacrifices for me and for my brothers. I warmly thank and appreciate my mother and father-in law (Drs. Titin Supriatin and Drs. Gaguk Supriyanto, MSi).
iv 1. Ms. Inger Battista, Ms. Anne Pazaver and Ms. Michele Galliford for the support
in giving linguistic advice;
2. Mr. Agus Mardaly (WMU Ph.D Candidate) and his family, for all the help, the attention, the advice and encouragement to complete a dissertation well;
3. Sokhdara SREY, Phicheyrithy SICH, Abdulhadi Embaia, Praveen Kumar Prabhala, and Gabriel Damilola, for the friendship, the meaningful discussion and conversation during our course at World Maritime University;
4. The Indonesian S16 students; Wardhani Pudji Rahmanto, Anwar Siregar, Nyoman Kajeng Sadnyana Putra, Achmad Noor Riduansyah, Aries Budhiman, Afif Amrullah, Syafiuddin, for the encouragement and support during process of writing this dissertation and also for the great time we had at World Maritime University;
5. All of the Indonesian S15, for the continues support during my studies here and share their valuable experiences. All of the Indonesian S17 students, for share the joy and pleasure;
6. All of the S16 students at World Maritime University, especially Port Management Specialization, for the great time we had during our course;
7. Mr. Danurwarsa, Mas Anton Laksmita, Mas Rudy Arbai, and Gus Yuliatmono Iffansyah Achmad, for the support and encouragement to pursue this degree. Anam Maritiem and Hafizhuddin Satriyo W, for supporting the dissertation data collection;
8. DR. Bertha Retno Sari MMRS, Tirta and Terry, Mas Robby and Ita, and Dek Nia, for the support and inspiration;
Last but not least, I would like also to extend my special thanks to my beloved wife, Ratna Dewi Ekasari, and my lovely daughters Afiyah Kamila Putri and Adzkia Nadhifa Putri, for their patience and great support during my absence.
“The two most important days in your life are the day you are born and the day you find out why.”
v
ABSTRACT
Title of Dissertation: ANALYSIS OF PRODUCTIVITY IN DREDGING
PROJECT; A CASE STUDY IN PORT OF TANJUNG PERAK SURABAYA - INDONESIA.
Degree: MSc
This dissertation is an assessment of the real productivity theory of a dredging project conducted in the port of Tanjung Perak Indonesia. The project was conducted in July 2012 and completed in December 2012 by Rukindo Corporation under the contract from the Indonesian Port Corporation III.
The assessment will analyse the gap between the proposed productivity of the dredgers by the contractor with the real productivity after the completion of the project that has taken into account the aspects that cause the delay of the project. It will combine the data from the literature reviews on the dredging operation with the actual data of the daily and weekly project report.
The researcher found that there is a difference of calculation of the productivity from the contractor with the actual productivity using the real productivity theory approach. The project productivity was influenced by several variable ranging from characteristics of the dredger to several project management issues. Several solutions will be proposed to accelerate the project and avoid the potential delay. The solution includes the usage of the TSHD 1000, TSHD 2900, TSHD 4000, TSHD 5000, grab clamshell 5.5 and grab clamshell 20.
The finding will seek to improve the planning of the dredging project in Indonesia Port Corporation III and in other cases where applicable.
KEYWORDS: Productivity Analysis, Dredging Operations, Real productivity
vi
Tables of Contents
1. Introduction ... 8
1.1. Background ... 8
1.2. Current condition of the port traffic ... 8
1.3. Aim and Objectives of the research. ... 13
1.3.1. Aim of the research ... 13
1.3.2. Objectives of the research ... 14
1.4. Methodology ... 14
1.5. Limitations of the Research ... 15
1.6. Structure of the Research ... 15
2. Geographical and business condition of the Port of Tanjung Perak ... 17
2.1. Background ... 17
2.2. Dredging contractual terms and conditions ... 19
2.1. Sedimentation ... 20
2.2. Productivity issues ... 21
2.3. Administrative delays ... 21
2.4. Management issues ... 21
2.5. Shipping Channel ... 22
2.6. Port water area ... 22
2.7. Port pilotage ... 23
2.8. Current, Wave and Wind ... 24
3. Literature of Dredging Project ... 27
3.1. Project Definition ... 27
3.2. Dredging Project Definition ... 27
3.2.1. Common Factors that affect the dredging project ... 28
3.2.2. Stages of The Dredging Planning ... 29
3.3. Dredging Equipment ... 32
vii
3.3.2. Estimation production of TSHD ... 38
3.3.3. Grab Dredger / Clamshell ... 41
3.3.4. Estimation production of grab clamshell ... 45
3.4. Duration of the project ... 49
3.5. Dredging Cost Estimation ... 49
3.5.1. Operating Cost ... 50
3.5.2. Mobilization and Demobilization ... 50
3.5.3. Crew and Labor ... 50
3.5.4. Fuel and Lubricants ... 51
3.5.5. Maintenance and Repair ... 51
3.5.6. Depreciation, Insurance, Overhead, Bonding and Profit ... 51
3.5.7. Additional Costs ... 52
4. Data processing and analysis ... 53
4.1. Analysis of the Dredgers Productivity ... 55
4.2. Kalimantan II ... 55
4.2.1. Loading time ... 59
4.2.2. Sailing time ... 59
4.2.3. Discharging time ... 59
4.2.4. Delay time ... 60
4.2.5. Delay factor ... 60
4.2.6. Operational factor ... 60
4.2.7. Mechanical breakdown factor ... 60
4.2.8. Maximum potential productivity ... 61
4.2.9. Real productivity ... 61
4.2.10. Achievement of the project duration by the existing TSHD ... 63
4.2.11. Productivity of other alternative TSHD ... 65
4.2.12. Delay factor Information of TSHD ... 71
4.3. Tondano ... 72
4.3.1. Productive Unit ... 75
viii
4.3.3. Nominal uninterrupted output ... 75
4.3.4. Delay Factor ... 76
4.3.5. Maximum potential productivity ... 77
4.3.6. Real productivity ... 78
4.3.7. Achievement of the project duration by the existing Clamshell ... 79
4.3.8. Productivity of another alternative Clamshell ... 81
4.3.9. Productivity of Danau Laut Tawar ... 81
4.3.10. Delay factor Information of Grab Clamshell ... 86
5. Estimated cost of the dredging project ... 87
6. Conclusion and Recommendation... 89
6.1. Trailing Suction Hopper Dredger ... 89
6.2. Grab Clamshell Dredger ... 90
APPENDIX A : TRAILING SUCTION HOPPER DREDGER AND GRAB CLAMSHELL PRODUCTION ... 92
APPENDIX B : TRAILING SUCTION HOPPER DREDGE AND GRAB CLAMSHELL COST ESTIMATION ... 109
List of Tables
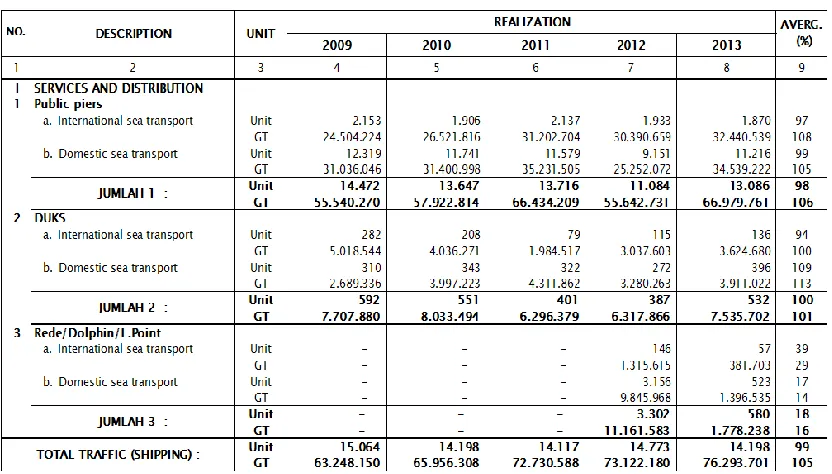
Table 1. Ship traffic based on type shipping and distribution ... 9
Table 2. Ship traffic by type of ships ... 10
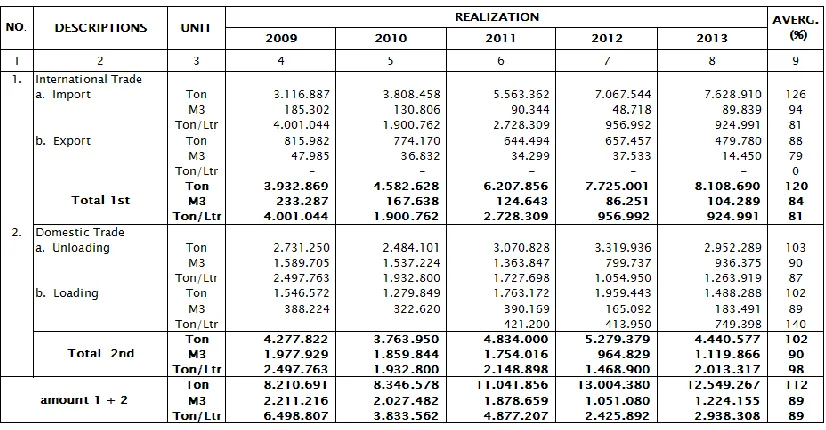
Table 3. The influx of goods based on the trade and distribution ... 10
Table 4. Flow goods based packaging and distribution ... 11
Table 5. Container Flows ... 12
Table 6. The flow of passengers ... 13
Table 7. The flow of animal ... 13
Table 8. Depth design of port basin ... 26
Table 9. Bulking factor, B, for various soil ... 39
types when excavated by mechanical dredger ... 39
Table 10. Operational factor, fo for given personal ratings (valid for good climate) ... 41
Table 11. Relationship between the type of grab bucket crane with dredged soil types ... 45
Table 12. Grab dredger, modification factor, fm, ... 46
for various soil types and bucket sizes ... 46
Table 13. Summary of the grab clamshell, variety of bucket fill factor, fm ... 49
Table 14. List of specification dredger types TSHD owned by PT Rukindo ... 53
ii Table 16. List of specification dredger types cutter suction
owned by PT Rukindo ... 54
Table 17. Auxiliary ship for dredgers owned by PT Rukindo ... 54
Table 18. Predominant Soil Type ... 54
Table 19. Shear capacity for soil types ... 55
Table 20. Estimates TSHD dredging cycle per day ... 56
(based on estimated contractors) ... 56
Table 21. Summary of work time dredging projects by Kalimantan II ... 59
Table 22. Data entry section for Kalimantan II productivity ... 63
Table 23. Comparisons of estimates production capacity ... 65
Table 24. Comparisonss of estimated production capacity ... 66
Table 25. Estimates of other alternative TSHD production capacity ... 68
Table 26. Factors causing delays ... 71
Table 27. Estimates grab clamshell dredging cycle per day (based on estimated contractors) ... 72
Table 28. Summary progress of productivity Tondano ... 74
Table 29. Data entry section for Tondano productivity ... 79
Table 30. Comparisons of estimates production capacity ... 80
Table 31. Factors causing delays ... 86
iii
Table A-1. Project site information used in estimate dredger productivity ... 92
Table A-2. Summary of the Project calculation dredged by TSHD ... 94
Table A-3. Summary of the project calculation Dredged ... 95
Table A-4. Comparison of alternative productivity ... 95
Table A-5. Analysis for accelerating achievement of the project by TSHD ... 96
Table A-6. Summary of the project calculation dredged by clamshell ... 99
Table A-7. Analysis for accelerating achievement of the project by clamshell ... 100
Table A-8. Summary of daily reports for time delays project of TSHD ... 102
Table A-8. Continued ... 103
Table A-8. Continued ... 104
Table A-8. Continued ... 105
Table A-8. Continued ... 106
Table A-9. Results of laboratory test for the type of soil in the dredging project ... 107
Table A-10. Results of laboratory test for the concentration of silt ... 108
Table B-1. Results of laboratory test for the concentration of silt ... 109
Table B-1. Continued ... 110
Table B-1. Continued ... 111
Table B-2. Results of laboratory test for the concentration of silt ... 112
iv
Table B-2. Continued ... 114
Table B-3. Analysis unit price of dredging by TSHD ... 114
Table B-4. Analysis unit price of dredging by Clamshell ... 115
Table B-5. The estimated cost of mobilization/demobilization by TSHD ... 115
List of Figures
Figure 1. Indonesian port territorial division ... 17
Figure 2. Conditions around the entrance port of Tanjung Perak ... 18
Figure 3. Conditions shipping channel toward the port of Tanjung Perak ... 23
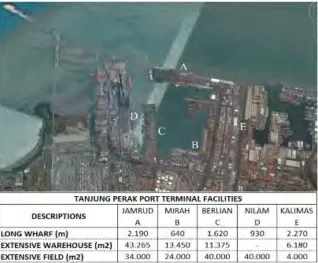
Figure 4. Tanjung Perak Port Layout ... 24
Figure 5. Tanjung Perak Port Layout ... 25
Figure 6. Flowchart of dredging activities planning procedure ... 30
Figure 7. Classification of Types Dredgers (adapted from Tsinker, 2004) ... 33
Figure 8. Operation Cycle of Trailing Suction Hopper Dredge (Adapted from Hollinberger, 2010) ... 36
Figure 9. Typical Characteristics Components of Trailing Suction Hopper Dredge (Adapted from Agerschou, 2004) ... 37
Figure 10. Distribution of Bucket Sizes in the United States, Multiply by 0.765 for m3 (Source Adair, 2005) .. 42
Figure 11. Mechanical dredge in Port of Tanjung Perak Indonesia, 2012 ... 43
Figure 12. Operation Cycle of Grab Dredger (Source Bray et al., 1997) ... 44
Figure 13. Clamshell bucket in operation (adapted from de Heer, 1989) ... 45
Figure 14. Grab dredger: nominal output,Pnom, for various bucket sizes and dredger characteristics (Source Bray et al., 1997) ... 46
Figure 15. Timeline of dredging project by TSHD ... 64
vi
Figure 17. Comparison of production capacity for any real TSHD alternative ... 69
Figure 18. Comparison of production capacity for any real alternative ... 70
Figure 19. Grab dredger nominal output Pnom, for various bucket sizes and dredger characteristics (Source Bray et al., 1997) ... 76
Figure 20. Timeline of dredging project by Clamshell ... 80
Figure 21. Comparison of other Clamshell real production capacity theory ... 83
Figure 22. Comparison of production capacity for any ... 83
real Clamshell alternative ... 83
vii
LIST OF ABREVIATIONS
CA : CHARTERING AGREEMENT GT : GROSS TONNAGE
IDR : INDONESIAN RUPIAH
IPC : INDONESIA PORT CORPORATION III mLWS : MEAN LOW WATER SPRINGS
SOC : STATE OWN COMPANY
1.
Introduction
1.1.Background
Indonesia Port Corporation III, widely known as IPC III or Pelindo III is a state owned corporation responsible for managing the ports and harbours in the area of Central Java, East Java, Bali, South Kalimantan, Central Kalimantan, West Nusa Tenggara and East Nusa Tenggara. The operation is coordinated from the main office in the port of Tanjung Perak Surabaya, Indonesia. As one of the state owned corporation in the maritime domain, IPC III takes an active role in supporting the current administration’s program especially in anticipating the user needs and improving the quality of the marine services. Several measures have been taken in order to ensure the progress, among them is to increase the depth of the Port basin to cater the operation of larger vessels with an investment of approximately $6.25 million (The Annual Report of Indonesian Port Corporation III , 2011 - 2014). Although the maintenance dredging has already conducted in the Port annually to maintain the current depth capacity, the new dredging project will be implemented as part of the long-term infrastructure development plan.
The purpose of a development plan is to review the overall status of the Port of Tanjung Perak, the second largest port in Indonesia. The port plays a crucial role in the sea transport services, stevedoring and container handling. The growth in the last few years has justified the need for upgrading such facilities, improving the equipment in cargo handling and easing traffic congestion in the shipping lanes. The volume of shipping traffic in port of Tanjung Perak was 14,198 in 2013. The number continues to grow each year by almost 10%.
1.2.Current condition of the port traffic
9 port of Tanjung Perak also acts as the transshipment point in international trade and domestic trade activities.
Table 1 below shows the statistic of ship traffic in the port of Tanjung Perak between 2009 and 2012. The figure shows the number of units on public terminals decreased by an average of growth each year falling by 2% from 14,472 units to 13,086 units. Meanwhile, in units of GT the number increased with an average growth of 6% each year from 55,540,270 million GT, and then increase to 66,979,761 GT. The changes were mainly caused by the increase traffic of container ships including passenger ships in the Public wharf, although the port basin at that time was still in the implementation phase of the port dredging project.
Table 1. Ship traffic based on type shipping and distribution
10 Then for tanker fuel, unit basis dropped by an average of 13% and an average GT grew by 3%.
Table 2. Ship traffic by type of ships
Table 3. The influx of goods based on the trade and distribution
11 1,224,155, or an average fell by 11% annually; this was due to a decrease in the activity of loading and unloading plywood, molding and the displacement pattern of transporting goods to the type of cargo containers.
12 The volume of the flow of goods to 2013 on a public pier amounted to 11,486,360 million tons or an average increase of 14% and amounted to 1,224,155 m3 or fell by an average of 11%. The shifting patterns of general cargo freight container led to this decline.
The volumetric movement of containers from 2009 to 2013 are as follows:
Table 5. Container Flows
Volume handled until 2013 reaching 623,146 boxes at an average increase of 20% annually, and in units amounted to 665,145 TEU's achieved TEU's, at an average increase of 21% annually.
13
Table 6. The flow of passengers
Table 7. The flow of animal
Flows of animals up to 2013 realized as much as 24,173 animals or or an average increase of 8% annually.
1.3.Aim and Objectives of the research.
In order to guide the structure of the research, I have set up the aim and objectives of the study as follows:
1.3.1. Aim of the research
14 the reason behind the phenomenon and suggest a better approach in calculating the productivity of the dredging operation.
1.3.2. Objectives of the research
The objectives of the research are;
To analyze the real productivity of dredgers working on the project site (Port of Tanjung Perak basin);
To identify the problems in dredge operations;
To propose alternative solutions in improving the productivity of dredging operations.
1.4.Methodology
This research will use the quantitative analysis method, by reviewing the implementation of the dredging project at Tanjung Perak Port in 2012. The data will be collected from available sources such as contract of the project, weekly project reports, and drawing projects. The analysis will further perform calculations on the theory of real productivity of existing dredger according to the findings in data collections and then analyze the volume and the rest time of execution of project based on project data. Then, it will aim to determine the type of alternative dredger fleet owned by the contractor in accordance with the material and location of dredging, calculating productivity dredgers alternative based on approach method and project data. Further, the acceleration time will be calculated based on the real productivity theory of the existing dredging and alternative solutions including financial costs. The aim, therefore, will be to present a wide range of alternative solutions based on the analysis. Raw data for the objective will be obtained from the following sources:
15 b) PT Rukindo, daily and weekly Report on The implementation of Port Dredging
Project Tanjung Perak Surabaya.
c) Annual report of IPC III from 2011 through 2014: reports uptake of investment within a year.
d) Regulation of the Minister of Transportation of the Republic of Indonesia No. KM. 70 In the year 2010, regarding standard costs in 2011 in the ministry of transportation.
1.5.Limitations of the Research
Scope and limits the discussion of problems in this research are:
a) The analysis is restricted to the port dredging project of Tanjung Perak Surabaya for 2012-2013.
b) Discussion on dredgers is limited to the dredgers held in the inventory of PT Rukindo as the local contractor.
c) The calculation of the acceleration of the work using an alternative addition of dredgers based on analysis of the selection of dredgers that can generate higher productivity.
d) Calculation of the financial cost of each alternative solution is based on the rules that apply to the Regulation Minister of Transportation of the Republic of Indonesia No. KM. 70 In the year 2010, regarding standard costs in 2011 in the ministry of transportation.
1.6.Structure of the Research
The research will cover the following subjects:
a) Introduction. Covering the background of the research, scope of work, the methodology used, an objective that will be achieved and structure and organization of the research
16 of dredgers used, estimation of productivity dredgers, consideration of the reduction factor, dredging operation and type of soil dredged.
c) Analysis. Analysis of the productivity and cost estimate calculations are based on a case study of delay in dredging in the Port of Tanjung Perak Surabaya. This chapter will present an analysis of project delays that occurred in the project, plus information related to the type of dredgers involved in the project, and the calculation of the productivity of each kind of dredger including the kind of dredger. In addition, the calculation of estimated achievement of the project according to the type dredgers and cost calculation will be based on the type of dredger selected.
d) Recommendations. Following the findings of an analysis of the possibility of acceleration of the implementation of dredging, recommendations will be proposed with the aim of improving the performance of dredging in the area of IPC;
17
2.
Geographical and business condition of the Port of Tanjung
Perak
2.1.Background
Ports are places for the ship to moor, anchor, embark or disembark passengers, loading or unloading of goods and are equipped with the safety of shipping and port supporting activities as well as the displacement of intra and inter-modal transport (Bichou, 2009). A port is also a gateway to a country as a connecting infrastructure in the form of import-export goods flow between regions, ship traffic, both foreign and domestic, as well as; the flow of animals and animal products and plants.
IPC III is an SOC that is involved in port and harbor services in Seventh Indonesian province including 43 ports covering Central Java, East Java, Bali, West Nusa Tenggara, East Nusa Tenggara, Central Kalimantan and South Kalimantan.
Figure 1. Indonesian port territorial division
18
Figure 2. Conditions around the entrance port of Tanjung Perak
19 method with high productivity. The designated area for dumping dredged material by OP, is approximately 6 nautical miles from Port of Tanjung Perak. The dumping ground is located in the following coordinate;
07º 10’ 28”S, 112º 45’ 58”E 07º 11’ 31”S, 112º 45’ 57”E
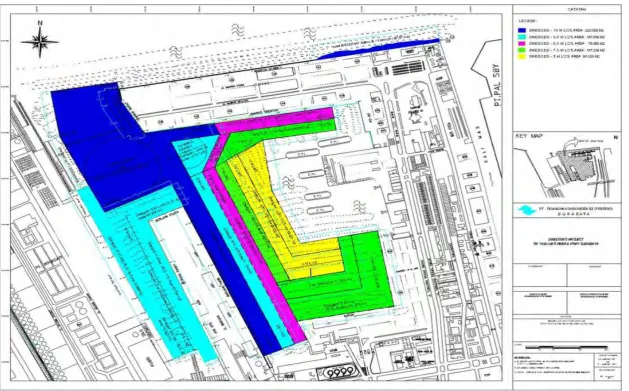
2.2.Dredging contractual terms and conditions
The general description contained in the dredging project contract, states the type of work namely dredging, transporting and disposal of dredging material. In addition, dredging location in the port of Tanjung Perak Surabaya, along with the area to be dredged (Figure 1), and the depth details (Table 8). Furthermore, the type of material, along with the siltation rate of 10%. Also, the general obligations and rights of the both parties are as follows;
1.5.1 Obligations of the owner of the project (PT Pelindo III);
Giving an advance and the periodic payments based on the progress of the project as agreed;
Carring out the pre-dredge sounding;
Carrying the final sounding together with the contractor;
Coordinating with contractors to smooth the process of implementation of the work.
1.5.2 Project owner rights:
Conducting supervision or put the officer as monitors the implementation of the work;
Giving warning of omission conducted by the contractor; Receiving periodic reports of work.
1.5.3 Obligations of project implementers (contractors)
20 Executing the project by using a type of trailing suction hopper dredger dredger (TSHD) and a clamshell with a number of tools are sufficient and in good condition and ready for operation (working);
Proposing the replacement of the type and number of dredgers if necessary from the project site and must be approved by the project owner;
Repairing any damage to dredger and does not bother project implementation schedule has been agreed;
Completing any kind of project activity with occupational safety and health equipment for all workers involved in the project.
1.5.4 Rights of contractor:
Accept payments on the results of the dredging in accordance with the agreed rules;
Give priority related to the place and time in conducting the dredging operations.
1.5.5 Several parameters affecting the unit price of dredger are as follows: The distance dispose which affects the trip;
The base price of the fuel economics of High Speed Diesel (HSD) solar taken from Indonesian state-owned oil company (PT Pertamina).
HSD diesel economical price basis used in the project is from the average data the previous year of IDR 8,108, - / litre.
2.1.Sedimentation
21 being carried out in collaboration with PT Rukindo, a state-owned dredging company and the work is planned for 150 calendar days.
2.2.Productivity issues
In the past, it has been observed that during the implementation of dredging work by local contractors, the productivity was very low. This was because the age of the dredger was based on a ship’s particular documents and despite the old age of the vessel, the productivity was being reflected very high. Other factors contributing to the low productivity were the ship traffic, the level of expertise of the crew, and the level of maintenance of the ship and inability of the crew to adjust with the local weather. Delays in the implementation of this work are extremely detrimental to the owner of the port because it can cause congestion, vessel queues become longer and lead to far-reaching effects for the economy.
2.3.Administrative delays
Delays in the implementation of the dredging project in the IPC region are often caused by the low productivity performance of local contractors as well as the difficulty of obtaining a license for dredging project from the government, which eventually leads to the project not being completed according to the contractual obligations thereby resulting in the termination of contracts. As for some of the existing dredging projects in the port area of IPC III, such as the dredging project at the Port of Tanjung Perak for 2012-2013, with a total contract value of IDR 60 billion (physical realization of the target of the fourth quarter of 2013 only 75%) and dredging the pond in TPKS front dock Semarang in 2012-2013 with a total contract value of IDR 22 billion Rupiah (physical realization of the target of the fourth quarter of 2013 only 30%). (Annual Report of Indonesian IPC III, 2011 - 2014).
2.4.Management issues
22 port congestion. Further in-depth observations are needed to determine the cause of the delay in the implementation of this dredging project. In addition, ways and means have to be devised for on-time completion by improving the productivity of dredging and accelerating the project to finish on schedule. For issues concerning the above, particularly the dredging project at Tanjung Perak Port, all stakeholders should plan to control the risk of possible delays in the execution of work by reviewing capacity production vis a vis dredger age and maintenance. In addition, an approach for the analysis of productivity vis a vis the dredging equipment being employed on the dredging project through calculations needs to be adopted as the best approach.
In general, the environmental conditions around the port of Tanjung Perak as follows;
2.5.Shipping Channel
The Western shipping channel is the main route to enter the port of Tanjung Perak (Figure 3), which is 25 nautical miles in length, 100 meters wide with depths varying between 9.7 to 12 mLWS. The navigable channel has been equipped with 24 buoys and a pilotage station in Karang Jamuang serving 24/7, throughout the year. The other channel, the East shipping channel is 22.5 nautical miles in length, 200 meters wide with a depth of between 2.5 to 5 mLWS and along this pathway has been equipped with 8 buoys.
2.6.Port water area
The port of Tanjung Perak has extensive outer port water area extending to 15.5563 million m2 and 784,000 m2 respectively, as well as a well-marked anchorage area defined by the following coordinates;
23
Figure 3. Conditions shipping channel toward the port of Tanjung Perak
2.7.Port pilotage
24
Figure 4. Tanjung Perak port layout
2.8.Current, Wave and Wind
27
3.
Literature of Dredging Project
3.1.Project Definition
A project is defined as a business / activity of complex, non-routine, limited by time, budget, resources, and performance specifications that are designed to meet the needs of consumers and have several characteristics (Lester & Lester, 2007). The characteristics of a project by lester definition include:
1. Having a particular purpose;
2. Having a point (early) and a certain point; 3. Involving multiple departments and professions;
4. Often doing something that has never been done before; 5. Having specific time, cost and performance requirements.
Another aspect, which is crucial in project, is scheduling. It is an important thing in a project because scheduling provides information about the timetable and progress of the project in terms of resources in the form of performance fees, labor, equipment and material as well as the duration of the project and progress plan for the project completion time (Mubarak, 2015).
3.2. Dredging Project Definition
28 3.2.1. Common Factors that affect the dredging project
There are several factors that can affect the dredging project. Some of the factors are classified as technical factors while the others are classified as management factors. (Dredging for Navigation: A handbook for port and waterways authorities, 1991): 1. Technical Factors
a. The existence of wrecks. Wrecks are usually the remainders of a ship or any others object found in the sea (floating, submerged or sunken). Large wrecks usually floating and can be mapped. Small ones often move freely in the water and hard to detect with the bare eyes. A surveillance by magnetometer or side scans sonar detection will be able to detect the wrecks that are not visible and not found in nautical maps. The inclusions of possible wrecks in a dredging project is important to be taken into consideration in the planning due to potential increase in the cost and safety measures required during the operations.
b. The ruins / debris
Ruins/ debris is any object that is floating in the sea that are not part of a ship. Ruins/Debris can lead to many disadvantages in the use of hydraulic dredgers. The problems of ruins/debris can be solved by using the tool grabs, a clause shape mechanism that can be install as an extention of the dredger.
c. The content of the base.
This problem occurs in dredging tool buckets, grabs, hopper, wheel cutters and pipeline. The high density of the soil can cause the high intensity of adhesion (stickiness). As a result, the effectiveness of the tool is disrupted, it reduceses the work productivity and would be problematic in the employment contract.
d. Coating base.
29 2. Management Factor
a. The condition of the contract agreement
The contract agreement related to the knowledge and ability to execute the work in the use of the latest technological tools. Technology evolves over time and the implementing work should be able to cope with the technical development in the field of dredging.
b. Methods of measurement and certification work.
The executor of the dredging work should be professional and trustworthy. Professional means that the executor must be certified and knowledgeable in the dredging works. He/she has to obtain sufficient experience of the dynamic challenges in the field.
c. Rules agreed on payments.
Every job, have a system of payment varying according to the agreement between the operators and users dredging services. Therefore, the work rules that have been agreed by both parties must be complied with and implemented as a whole.
d. The relationship between the employer and the contractor.
Their proper relationship that should exist between the employer and the contractor as the executor will have an impact both on the implementation of work.
3.2.2. Stages of The Dredging Planning
30
Figure 6. Flowchart of dredging activities planning procedure
According to Huston (1970), in order to support the investigation process of sedimentation either soil or stone, it requires the measurement of submerged land through hydrography, taking soundings before and after dredging. The site investigations also include hydrography, side-scan sonar surveys, sub bottom profile surveys, geotechnical investigations and laboratory testing work based on soil boring. The geotechnical data are used to evaluate the dredging characteristic of the material and to assess its impact related to other purposes such as reclamation or environmental concern. Historical bathymetric data and dredging records should also be reviewed, where available, to help assess the local sedimentation rates and estimate long-term maintenance dredging requirements. The geotechnical data are used to evaluate the dredging characteristic of the material and to evaluate its performance as fill for reclamation or as dredge spoil. This analysis may be supplemented by hydrodynamic and sedimentation transport numerical model studies to evaluate future deposition pattern and rates (Tsinker, 2004). Hydrograph survey is usually conducted by the contractor as the executor of the work. While the owner also performed similar work through a civil engineer consultant in order to confirm the finding by the contractor (Huston, 1970).
31 results of physical hydraulic model tests of the port performance and navigation simulation studies to confirm the design of the entrance channel and turning basin. In calculating the dredging quantities, an allowance should be included to account for over dredging beyond the nominal design dredge depth. This can be a critical component of the total dredge volume for dredging in relatively deep water where only a thin layer of sediment needs to be removed (Tsinker, 2004).
According to the Bray et al. (1997), hydrography or sounding on dredging activities should be conducted in four stages of processing, i.e.,
1. Pre-dredge Sounding
An initial survey undertaken prior to the dredging work is held, and the resulting data is used as the basis for calculating the volume of material to be dredged in the intended location.
2. Check Sounding
Check sounding is a measurement or survey to see the results from the temporary work areas that have been dredged and the resulting data is used to control implementation of the dredging at the site. Determination of the measurement time period depends on the duration of the project and the type of dredgers are used. As for the term of analysis carried out regularly either twice a month or a maximum of four times a month as needed.
3. Progress Sounding
Progress sounding is conducted to be reported to the owner and as the requirements for a contractor in billing. In sounding progress is made in accordance with the need for billing. During the implementation of the progress sounding, there is the owner come to accompany.
4. Final Sounding
32 3.3. Dredging Equipment
Generally, the selection of dredging equipment for the implementation of certain projects is based on the availability of fleet of dredgers owned by the contractor as a candidate for the project implementation (Pullar & Hughes, 2009). Therefore, it is not easy to decide the dredging equipment in ideal way, as desired by the project owner.
There are several aspect that need to be consider by the contractor in term of he contract, content and layout of the dredging project.
a) The effectiveness of dredging equipment adapted to the type of sedimentation. b) The ability of dredging equipment to transport sediment from the dredging area
to the disposal site.
c) The flexibility in the work of dredging related to the weather conditions at the project site.
d) Considerations of environmental aspect at the disposal site. e) The efficiency of the project.
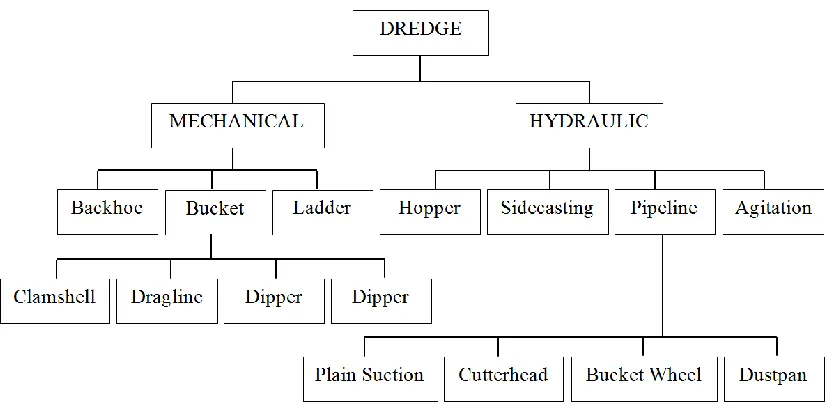
33 1992). In addition, thera are many others of other types of dredgers that refers to the workings or type of dredged material.
Figure 7. Classification of types dredgers (adapted from Tsinker, 2004)
According to the method of excavation / demolition material, the dredger is divided into two types (Herbich, 1992).
1. Mechanical Dredger
Mechanical means the works are done by way of digging or cutting. Excavation work will be done by using a bucket with many different forms. The effectiveness of these operations depends on the power that is channeled to the bucket / blade as well as the shape of the outskirts / blade bucket stuck on the ground. Due to the large forced needed to cope with the rigors of the land, there are several type of the bucket that are used, such as ;
a) Shovel shape at the Dipper Dredger; b) Shape backhoe on Dredger;
c) Form chain on Dredger bucket; d) Shape grab on Dredger;
34 Job cuts are usually carried out by using a blade by way of "slicing" in order for the results of the excavation to be separated from the original soil mass.
2. Hydraulic Dredger
A hydraulic dredger is operated using using water power. The force from the water jet can be directed toward the dredgers or away from the dredgers. The water jet will take the mixture of water and soil which is drawn by the dredger. The process of soil lifted hydraulically / pneumatic is with a centrifugal pump, with a jet pump, by utilizing the air (airlift) and with pump seabed. Centrifugal pumps used to raise (vertical) and "transport" (horizontal). Characteristics of the selected pump should be adjusted to the workload. The dredging pump is not much different from the large water pumps, only impeller designed so as to allow chunks rather large to pass them. Pump-jet typically is a tool system that uses centrifugal pumps. Jet-water at high pressure leads into the suction pipe. Jet-water flow with a mixture of water and soil into a suction pipe and tube venture-energy jet of water is converted into a "high-pressure water" (pressure head).The dredger effectiveness depends on the speed of the water jet and the characteristics of the material. Suction head shape assortment, includes:
a) Head-suction-flat as the Suction Dredger;
b) Ship-pull like the Trailing Suction Hopper Dredger; c) Dust pan head as in Dustpan Dredger.
Sometimes ship-pull dust pan head was equipped with a jet of water to help the "exploitation" easier.
3.3.1. Trailing suction hopper dredgers (TSHD)
35 a category of the hydraulic dredger, the hopper dredgers utilize a centrifugal pump to entrain sediment in water for removal and transport. When the vessel is above the desired dredge site; the dragarms are lowered from the side until the draghead rests on the water floor and then the centrifugal pump are energized. In this stage, the vessel is moving forward slowly which is typically to two knots to allow the water to flow in the draghead and up to the dragarms. The water in the draghead then begins to erode the sediment, and the slurry moves up in the dragarm and achieves a certain threshold of material content. Next, physically, the dredging material is a combination of water and sediment is also known as slurry, and the slurry is kept in the hopper section of the ship.
Tsinker (2004) described that the dredging is done by hydraulic dredger fleet TSHD or other types sedimentation with composition solids concentration is 20% and the remaining 80% is water. Dragheads that relies on the erosive flow of water is commonly used more than those that are equipped with water jets or mechanical scrapers to break harder materials. Once the capacity of the slurry in the hopper reaches the between 750 to 10,000 cubic meters (1,000 to 13,000 cubic yards), a maintenance work need to be done to clear the sedimentations that have been attached to the inner side of the suction pipe (Bray et al., 1997).
In order to maximize the concentration of sediment in the bin hopper, sometimes it is possible to continue loading hopper over the intended times to initially fill with slurry mixture. However, at the time the sediment have reached the maximum of the bin the pumps have to be stopped in order to prevent the overflow of sediment back into the water Bray et al. (1997). The practice in the field, will be different from one location to another based on the existing existing government regulations and the nature of the sediment.
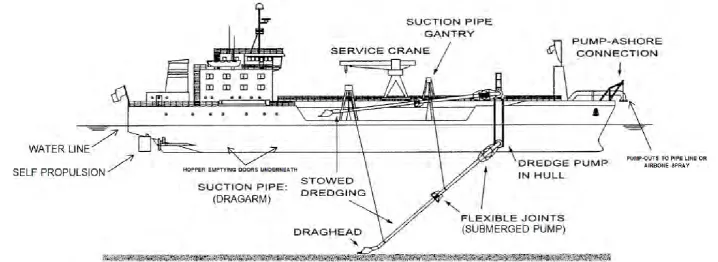
36 hopper quickly. A shown in Figure 8, the full cycle of TSHD after which the dredged sediment is dumped on landfill sites and back again to its original location to return dredging again and repeat all the stages of the cycle sail, load, sail, and unload. This can simply be described as the production cycle. The production cycle of THSD depends on the specifications and site characteristics. The cycle can last for less than an hour, up to several hours.
Hopper dredger or TSHD are commonly used for maintenance dredging which is to remove the accumulated material from the navigation channels that have previously been dredged (De Heer, 1989). The reason is for this is that the draghead is very effective for less hard material. Self-propulsion is another unique part of the hopper dredge because it allows easy navigation, maneuvering, and traffic avoidance. Moreover, it can eliminate most of the mobilization/demobilization costs related to other dredgers such as cutter-suction, mechanical bucket or dipper-types that can require tow services to get to a project site, and as well as other miscellaneous support for vessels during operation.
Figure 8. Operation cycle of trailing suction hopper dredger (Adapted from
3.3.2. Estimation production of TSHD
Production of a dredger can be estimated through a variety of ways depending on the types of dredgers used (Adair, 2005). The terms of productivity have several variations of understanding. As for the production, which takes into sub-cycle dredgers as output per hour is commonly known by the nominal theoretical production (Pnom) which expressed the amount of productivity in the technical specification documents in this respect is the capacity hopper. However, in the execution of dredging this production could not be achieved because there are some external influences. Therefore, corrective measures are required regarding this production, which can represent actual performance. Further, a simple understanding of the productivity hopper dredger can be interpreted as follows;
max Total cycle timeTotal load (1)
Where the total load is the capacity of the hopper dredger and the total cycle time is the time in one cycle of dredging activity (Bray, 1997). In addition, Wowtschke (2016) described where the components total load can be obtained from the calculation of the multiplication of the CH or the maximum capacity of the hopper dredger which is expressed in cubic meters then multiplied by fe or proportion factor of the hopper filled by the sediment, which is further divided by the result of multiplying B or bulking factor with tload, tturn, tsail, and td which denotes the discrepancies component of the dredging cycle and is expressed in hours. So that now the estimates of productivity dredger can be defined to be;
max tload tturn fe tsail td (2)
39 dredging and transportation to be placed on the dumping area (dredging cycle). The changes are caused by natural factors such as the material shrinkage due to loss of the water component and void. In other words, the dry density of dredging material is increased from its previous condition. So, in the end, this form of further improvement is expressed as a ratio or a comparison of the two volumes. Table 9 shows the typical variation of the value used in the calculation of the reduction, including types of hydraulic dredgers whose level of bulking factors also varies depending on the density of dredging material.
Table 9. Bulking factor, B, for various soil
types when excavated by mechanical dredger
40 number of turns and the time needed for the dredge to make a turn. Further, the complexity of the conditions of environmental dredging projects such as the size of the area of dredging and soil conditions and other factors will require more than one turn and in the end would increase non-productive time work (Bray, 1997). Sailing time, tsail, is the cycle time for dredgers to sail from location of the dredging project to the dumping area and back to the starting place (Wowtschke, 2016). Finally, the time required by the dredger to dump the dredging materials is incorporated; In addition, it also depends on the whether the method used as the TSHD uses bottom-dumped, then the default td is 0.1 hrs.
However, in the execution of dredging there are times when the ideal situation is difficult to achieve continuously which includes the operational efficiency of the crew, the traffic around the project site and, the weather and the condition of machinery (Bray, 1997). So, it is no longer as it had been expected. Thus, it is further expressed by Bray et al. (1997), the real productivity theory is defined by including all of these components as the reduction factor as described below;
max fd fo fb (3)
Where P is the real production expressed in cubic meters. The delay factor (fd) is the reduction factor of productivity dredger due to bad weather and obstructions in the maritime traffic. Furthermore, fd described by the total available working time is reduced by total time lost because of the delay (due to maritime traffic obstruction and weather), So it can be expressed by the following equation;
fd Total working time available Total working time available time lost due to traffic during working hours (4)
41
Table 10. Operational factor, fo for given personal ratings (valid for good climate)
The mechanical breakdown factor (fb) is the reduction factor due to the level of failure or damage which cannot be avoided from the equipment that leads to a work stoppage. Theoretically, the machine has been used continuously, which will require good maintenance periodically so that the machine can still work well. However, after several years of damage, this would occur due to wear and tear and this cannot be unavoidable and if damage occurs, then productivity will decreases (Bray, 1997). De Heer et al. (1989) explained that the fb was defined by calculating the age level of dredgers, which will continuously fall by 1% per year (after the first 5 years of the new age), down to 0.85 before overhaul (typically 20 years).
3.3.3. Grab Dredger / Clamshell
According to Bray et al. (1997), there are five classifications of mechanical dredgers. A backhoe dredger is the one where the backhoe is attached to the barge or vessel to dredger the soil. A dipper dredger uses a rigid arm with a bucket to cut through the sediment. A bucket ladder is the one that uses a chain of buckets on a belt to dredge the soil. The dragline dredge puts the bucket in the sediment and drags the bucket back toward the vessel. Lastly, the grabber dredger uses a bottom opening bucket at the end of a crane.
self-42 propelled grab dredger, which has its own hoppers or barge. Both kinds of these grabber dredgers are the same in a sense that they use grab to excavate the sediment, but the difference is that they have a different method of transportation.
The clamshell is the most common form of grab bucket. A two-sided bucket is dropped into the bottom of the water so that it enters the soil. This is crucial because if the edges of the bucket do not penetrate the soil correctly, the bucket will get empty soil when the edges close. Two wires are used in the dredging method, the hoist wire and the closing wire. The hoist wire is used to move the wire up and down, while the closing wire is used to close the bucket. It should be noted that bucket size is an important characteristic in the mechanical dredgers. Adair (2005), provides a description (Figure 10 ) of the different bucket sizes used in the United States in 2003. From Figure 10, it is very clear that the size of the bucket 15 yd3 is the most frequently used. There are also several more sizes between 15 and 30 yd3 (11 and 23m3). A few bucket sizes are bigger than 30yd3 (23m3). The largest bucket is 50 yd3.
Figure 10. Distribution of bucket sizes in the united states, multiply by 0.765
43 Figure 11 shows a mechanical clamshell dredger in the port basin of the port of Tanjung Perak Surabaya. In the picture, it can be seen that there are many principal components of the mechanical dredger. The dredger is a crane-like structure. In the dredging process, the crane puts the buckets above the desired location and lowers the bucket into the bottom of the waterway. When the bucket closes, it collects sediment. The crane raises the bucket out of the water and positions it over the barge. The bucket is opened, and then the dredged material is discharged in the barge. This cycle is then repeated until the desired depth is achieved.
Figure 11. Mechanical dredge in port of Tanjung Perak Indonesia, 2012
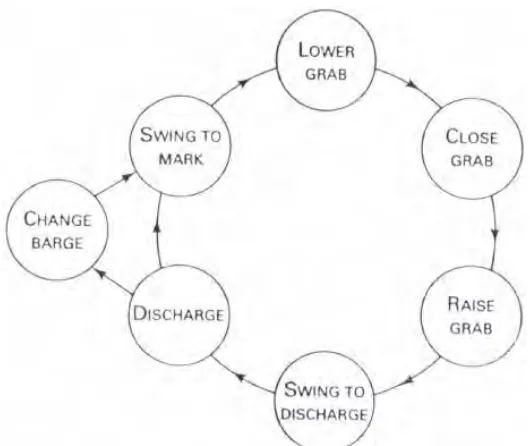
44 toward the point of dredger, which will depend on the angle of the swing. Then the grab is lowered or the grab bucket is directed downwards at an open position, so it will depend on the type of material dredged. Then, the grab or bucket is raised and reappointed in the closed position with contents inside; it depends on the speed of the lift. After that, the swing to discharge or grab is directed toward the hopper, and this will depend on the angle of the swing, and at the end it is discharged.
Figure 12. Operation cycle of grab dredger (Source Bray et al., 1997)
45
Figure 13. Clamshell bucket in operation (adapted from De Heer, 1989)
3.3.4. Estimation production of grab clamshell
The productivity of a clamshell grab dredger can be calculated by first determining several contributing factors in order to represent the actual performance of the dredgers. Bray et al. (1997) have simplified the calculation by providing a curve fitting to determine a nominal production (Pnom) which has been adjusted to the bucket fill factor or modification factor (fm) and the basis of a productive unit (Ub) which represents the capacity of the bucket (C), which should be adjusted to the digability of the soil.
Table 11. Relationship between the type of
grab bucket crane with dredged soil types
46
Table 12. Grab dredger, modification factor, fm,
for various soil types and bucket sizes
Once the grab bucket capacity has been calculated, and the bucket fill factors are determined, they can be used as a supporting parameter in determining the nominal production (Pnom) through the following curve fitting;
Figure 14. Grab clamshell: nominal output,Pnom, for various bucket sizes and
47 Furthermore, nominal production could be delayed due to several reasons such as the time required to advancing the dredger (fa). Therefore, Bray et al. (1997) has defined this to be as follows;
fa 1
1 ta x pnom z
(5)
In the equation (5) above, A is the average area dredge, and z is the average thickness of the material, while tea is the time required (hours) to advance to the next dredging position and B is the bulking factor that is dependent on the sediment type and water content (see Table 12). Another delayed reason is the time for the changing hopper barge (fh) and this is expressed in the following;
fh 1
1 th x fa x nom x
(6)
All of the parameters in equation (5) above are the same as in equation (6) by the addition of th is the time required (hours) to change hoppers, and the hopper capacity H in meters. After all the delay factors are (fa, fh) has been taken into account, then the maximum potential output (Pmax) can be calculated using a nominal production (Pnom) as supporting parameters.
max fa x fh x nom (7)
48
fo x fb x max (8)
Overall, this method works well, but only for small-sized buckets Therefore, another approach for larger bucket sizes is also needed. De Heer (1989) has another approach in calculating production of the clamshell grab with different supporting parameters. As for the calculations, it is as follows;
nom Tcycle in sec. x 3600 (9)
Where C is the bucket capacity, Tcycle is the total time needed to dredge of sedimentation until emptied and moved to another location to backfill the bucket to be emptied again (Adair, 2004). De Heer (1989) explains that for dredging depths up to 10 meters with a slewing angle of the crane by 180 degrees, the cycle time may be used for 90 seconds.
Furthermore, Adair (2004) has developed a calculation equation of bucket fill factor (fm) for different size bucket adapted to various types of soil. as for hard soil sediment, or stone types, the calculation can as follows;
fm 0.1443 n 0.25 (10)
49
Table 13. Summary of the grab clamshell, variety of bucket fill factor, fm
Meanwhile, with the approach to the size of a large bucket (Adair, 2004), the nominal production (Pnom) in equation (9) is developed as follows;
nom 3600 Tcycle f m (11)
3.4.Duration of the project
The productivity of the dredgers that have been obtained through the calculation of actual production was decisive in the proper length of the project (ideal) or known as productive duration. A mistake in the estimated productive duration (over-estimation) is a major cause of failure of a project (Turner, 1986). Ultimately, the actual production capacity theory will then be used as a basis for determining the approximate duration of the remaining projects, including the duration of the delay.
3.5.Dredging Cost Estimation
50 crew and labor, fuel and lubricants, repair and maintenance, depreciation and insurance. In the case of the dredging operations in Indonesia, the authority has to abide to positive law of Indonesia. The considerations and additional information that are presented in this research are intended for comparative study and informational literature review.
3.5.1. Operating Cost
In the calculation of the cost of the dredging operation, it is important to know in advance the duration of the project. The real production level of dredgers are expressed in cubic meters per hour, and the volume to be dredged by each type of dredger. The cost of the dredging operation, it may consist of several factors such as the crew of the dredger, fuel, lubricants, and routine maintenance repairs, insurance, depreciation and profit (Tsinker, 2004). Then the cost of the various factors above is summed to obtain the operating costs.
3.5.2. Mobilization and Demobilization
Dredging costs of mobilization and demobilization depends on dredging fleet transportation costs to and from the project site. In fact, it is quite difficult to estimate the cost due to several factors that are not easy to be ascertained such as function of the distance itself, the crew and the lost cost resulting from the discontinuation of temporary to set-up. In addition, according to Randal (2000) in reality, no two dredgers that have to distance away to and from the project site are exactly the same.
3.5.3. Crew and Labor
51 As for the need for the number of crew, this depends on the type of dredger and the size of the vessel, automation equipment, and trip duration.
3.5.4. Fuel and Lubricants
The cost of fuel is very volatile in the marketplace. In addition, the cost factor has a fairly large portion of the cost calculation components and it is sensitive because it follows other factors such as distance and, the engine power to dredge and others. So it is necessary to limit well for the expenses of these factors. Furthermore, many different types of the machines, which work on dredgers and ancillary equipment in any dredging will cause the consumption of lubricant to be large as well. Generally argued by Tsinker (2004), in practice, the requirement for lubricant is calculated at 10% of the total cost of fuel.
3.5.5. Maintenance and Repair
Bray et al. (1997), described that by its nature maintenance is divided into two categories: routine maintenance and repairs. Tsinker (2004), however, argues that all necessary repairs during the duration of the project also included in the category of maintenance, such as replacing worn engine parts, damaged pipes, hoses, and electrical consumables. Lubrication of equipment is part of the maintenance repairs, which are minor maintenance. In addition, the major repair is anything that does not occur within the duration of the project but is still included in the contract with a small percentage of the actual maintenance costs. As to the daily cost of minor and major repairs for a trailing suction hopper dredge can be found by multiplying the capital cost of the dredge by 0.000135 and 0.000275 respectively (Bray et al., 1997).
3.5.6. Depreciation, Insurance, Overhead, Bonding and Profit
52 multiplied by 0.025 and divided by the number of working days per year. Meanwhile, overhead is nine percent of the working costs already established to this point. Furthermore, Belesimo (2000), advises that project bonding may cost between 1.0 and 1.5 percent of the working cost. On the basis of these descriptions, overhead and bonding can be combined to an additional ten percent on top of the determined operating costs. Eventually, each individual contractor will determine its own profits in accordance with the type of work.
3.5.7. Additional Costs
53
4.
Data processing and analysis
In the dredger fleet for the dredging works of the port basin at Tanjung Perak Port, most of the dredgers will be procured domestically. The following Table 14 up to Table 17 gives the list of active dredgers owned and operated by PT RUKINDO, a state-owned dredging company.
Table 14. List of specification dredger types TSHD owned by PT Rukindo
Table 15. List of specification dredger types clamshell owned by PT Rukindo
No. Name of Ship Year Built Overall Length (m) Moulded Breadth (m) Moulded Depth (m) Loaded Draught (m) Dredging Depth (m) Hopper Capacity
(m3)
1 Bali II 1993 124.4 18.04 8.05 7 30 5,000
2 Aru II 1994 124.4 18.04 8.05 7 30 5,000
3 Irian Jaya 1981 109.88 18.04 8.05 6.33 20 4,000
4 Kalimantan II 1983 109.88 18.04 8.05 6.33 20 4,000
5 Sulawesi II 1974 92.5 16 8 7.33 20 2,900
6 Betuah 1978 92 16 8 7.33 20 2,900
7 Seram 1981 92 16 8 7.3 20 2,900
8 Halmahera 1983 92.5 16 8 7.33 20 2,900
9 Timor 1981 95 18.4 7 3 20 2,000
10 Banda 198 71.1 14 4.9 4.05 14 1,000
11 Natuna 1984 71.1 14 4.9 4.05 14 1,000
No. Name of Ship Year Built Overall Length (m) Moulded Breadth (m) Moulded Depth (m) Grab Capacity
(m3)
Dredging Depth (m)
Dredging Capacity
(m3)
1 Danau Laut
Tawar 1974 54 23 4.5 20 25
-2 Batur 1984 28 13 2.6 5.5 20 300
3 Ranau 1984 28 13 2.6 5.5 20 300
4 Poso 1984 28 13 2.6 5.5 20 300
54
Table 16. List of specification dredger types cutter suction owned by PT Rukindo
Source: Website of PT (Persero) Pengerukan Indonesia, www.rukindo.co.id (2010).
The clamshell dredgers (Non-Hopper) is operated in the radius of 2.5 meters up to five meters from the edge of the wharf, while TSHD is operated beyond the limit of the clamshell dredgers.
Table 17. Auxiliary ship for dredgers owned by PT Rukindo
With regard to the types of soil in the dredging area of the port of Tanjung Perak, samples have been taken for laboratory test result (Appendix A, Table A-9). The result indicated that the silt content in the soil samples is 60%, sand content 5%, and clay content 35% with no evidence of gravel.
The grain size distribution test which was done in the laboratory using the soil samples taken coordinates 07o11.968’S and 112o43.722’E, shows that the soil predominantly consist of granules silts and clays.
Table 18. Predominant Soil Type
No. Name of Ship Year Built Overall (m)Length Breadth (m)Moulded Depth (m)Moulded Draught (m)Loaded Depth (m)Dredging Dredging Capacity (m3/hr)
1 Batang Anai 1994 93 18.5 7 5 24 1,200
2 Kapuas 30 1976 43.17 13.41 2.9 1.9 17.68 600
No. Name of Ship Hopper
Capacity (m3) Speed (Knots) LOA (m) LBP (m) Moulded Breadth Height (m)
1 SB Seroja 500 5 46.58 44.52 9.75 3.66
2 SB 54 500 5 50.3 49.1 9.5 3.75
No. Name of Ship Draught (m) Gross Tonnage (Tons) TonnageNett Engine Main (HP)
Depth Dredger
(m)
Producti on Year
1 SB Seroja 1.8 518 156 2 x 480 10 1985
2 SB 54 2 528 158 2 x 370 10 1984
Granules soil More than 35% where the smooth material is more than 0.06 cm
55
Table 19. Shear capacity for soil types
Table 18 shows that that strong value (N) of sediment in the port basin ranges from 4 s / d 10. The value indicated that the threshold for determining the dredging slope is between 1: 3 to 1: 4 (selected slope 1: 4).
4.1.Analysis of the Dredgers Productivity
At the port dredging project of Tanjung Perak in 2012, an outline of the work is divided into two which is based dredgers working on the location and amount of certain sedimentation stipulated in the employment contract. The number of as much as 907,049 m3 of the sediment is carried by the type TSHD (Kalimantan II) with a capacity of 4,000 m3 and other sediments of as much as 283,546 m3 are carried by the clamshell dredger (Tondano) with a capacity of 5.5 m3 with two ships assisted self-propelled hopper with a capacity of 500 m3. Both are existing dredgers working on dredging in the port area of Tanjung Perak. The dredged area-adjusted with the results in 2012 included the sounding depth plan.
4.2.Kalimantan II
Kalimantan II is a type of dredger Trailing Suction Hopper Dredger (TSHD) which is a type of Hydraulic dredgers (Facts About: Trailing Suction Hopper Dredgers - IADC Dredging, 2014). Productivity is calculated in units of cubic meters per hour by considering transport capacity, sailing time, discharging time, unloading time, and several other reduction factors that can influence. However, in the calculation of this analysis, all the things that need to be considered in accordance with the literature review will be adjusted with the type and availability of data that have been obtained from the contractor from daily, weekly and monthly report projects. While there is a lack of data needed for this calculation, it will be overcame by assumption.
Silt type or silty sand Quick Test Loose 200 - 220
Dense 250 - 300