IJSRSET1624211 | Received : 25 August 2016 | Accepted : 05 Sep. 2016 | September-October-2016 [(2)5: 01-08]
© 2016 IJSRSET | Volume 2 | Issue 5 | Print ISSN: 2395-1990 | Online ISSN : 2394-4099 Themed Section: Engineering and Technology
1
Performance Analysis of RFID Tag Detection with Smart Antenna
Using Adaptive Power Allocation
Maliha Mahbub
Department of Computer Science and Engineering, Stamford University Bangladesh, Dhaka, Bangladesh
ABSTRACT
This paper proposes a novel approach to optimize the tag detection, coverage problem and power allocation issues of the RFID reader and tags. We have investigated the effects of variable localization of RFID tags from reader and power loss, inefficiency and distance constraints caused due to equal power allocations to the tags. As an improvement to the situation, implementation of adaptive algorithm has been proposed which could estimate the variable distances of tag from the reader and distribute power to tags based on this calculation. We have proposed the implementation of smart antenna instead of traditional antenna in RFID system addressing the above-cited problems. Results from mathematical analysis and simulation has been included which demonstrate that our proposed scheme shows a significant improvement over the traditional approaches of tag detection and power allocation techniques of RFID systems.
Keywords: RFID, Adaptive Algorithm, Smart Antenna, Reader, Tag , Tag Detection & Power Allocation
I.
INTRODUCTION
A. Background/Rationale
Radio Frequency Identification (RFID) is a without line-of-sight, low-power and low-cost radio communication technology that is used for automatically tracking and identifying objects. This technology comprises of the following major components: RFID transceivers or readers, RFID transponders or tags, Transmitting and receiving antenna.
The basic tracking and identification is based on communication between reader and tags. RFID tags are mainly attached to the objects which are to be identified and authenticated. These tags contain electronically stored information in integrated circuits which are scanned by the transceivers or readers and an antenna for receiving and transmitting the signal. In recent technology, RFID tags are mainly classified into two broad categories: Active or battery-attached tags and Passive tags. Active tags require a power source—they’re either connected to a powered source or use energy stored in an integrated battery which makes them very expensive. On the other hand,
passive tags are doing require batteries or maintenance, they work by power provided by the reader [1]. RFID readers can read information stored in no line of sight RFID tags in their vicinity and communicate it to central database system through wired or wireless interface.
Over the last few years, RFID has drawn a great deal of attention and it is now widely believed that RFID can bring revolutionary changes. Some of the major retailers have already invested significantly in RFID and mandated their manufacturers to place tags on goods and products such as Wal-Mart.[2]. Although also have been many issues that needs to be worked with regarding the efficient use and implementation of RFID such as reader collision, tag collision, tag coverage, tag reporting problems, specially with passive RFID tags.
B. Statement of the Problem
antenna, it detects the activation signal from the antenna. That "wakes up" the RFID chip, and it transmits the information on its microchip to be picked up by the scanning antenna.
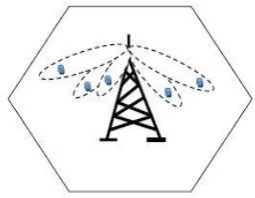
Figure 1. Main components of a RFID system.
However, this can be a little difficult while using RFID in a wide area which requires coverage for a number of available tags in the scanning field of antenna which are located at different locations and are constantly moving. Localization of tags can be tricky as the general antennas used for RFID transmit and receive equal powers to and from the tags. While one tag may be at a greater distance than other tags, it may require more power than other tags from the antenna to be tracked. As the antenna provides fixed amount of power to all tags located within its coverage area, so tag coverage areas become limited in terms of their distance from reader antenna. This also results in power loss as same power is allocated to near located and far located tags, which is not much efficient.
A smart antenna system is composed of an array of multiple antenna elements and coherent transceivers with advanced digital signal processing algorithms. Instead of a single fixed beam pattern from a traditional antenna, the smart antenna can dynamically generate multiple beam patterns, each of them is pointed to a particular receiver or in our case, tags and such beam patterns can adapt to increase or decrease the beam coverage area intelligently.
Figure 2. Reader to tag distance power coverage
Smart antennas use adaptive algorithm to determine the power required for a particular area of the
corresponding tag. That means, instead of transmitting equal power to all tags in the coverage area like a regular antenna, the smart antenna can provide arbitrary power to different tags based on their respective distances from the reader antenna. This could significantly reduce power loss, improve the performance and detect tags efficiently. Smart antennas known as adaptive array antennas, multiple antennas to identify the direction of arrival (DOA) of the signal (in this case, the signal from tag), and use it to calculate beam forming vectors, to track and locate the antenna beam on the mobile/target.
C. Objective of the Research
The main aim of our paper is to propose a solution to the following issues:
Duplicate tag reporting by several reader antennas within same area
Reader-to-tag interference which occurs when more than one reader try to read the same tag simultaneously.
Optimal tag coverage problem which arises due to variable locations of tags within the antenna overage area for passive tags.
Efficient power consumption and distribution between reader antennas and tag.
Figure 3. Radiation /beam forming pattern of Smart antenna
allocation to tags relative to their locations in coverage area by using adaptive antennas.
II.
METHODS AND MATERIAL
1. Wireless sensor Literature Review
As use of RFID tracking and identification has experienced a significant growth over recent years, there have been proposals and researches based on localizing and power efficiency of scanning and energy efficient tags.
An analytical approach for multi-stage rectifiers, which provides design tradeoffs as well as a set of design rules to improve power efficiency of the rectifier [3].
While work by Kim et al estimate the direction of arrival by tracking the receive signal strength of two directional antennas depending on their orientation, the phase difference at distinct array elements is considered for direction of arrival estimation in this work [4].
Additionally, several authors, proposed to install multiple readers and apply reader-to-tag distance estimation to localize an RFID tag [5].
There has also been research based on use of LANDMARC is an indoor localization system using RFID technology, which introduces the concept of reference tag to reduce the number of deployed RFID readers and optimized localization of tags [6].
Salonen et al show a phased array realization for blindly scanning an area with a beam [7].
Another paper presents an algorithm for redundant reader elimination for directional antenna. It uses a radio propagation model and also accounts for loss due to multipath fading to model communication between a reader and a tag[8].
Very recently, Nikitin published a comparison of different techniques of DOA estimation by utilizing a phase difference. They propose to exploit a phase difference of a) multiple consecutive measurements of a moving tag (time domain), b) multiple consecutive measurements of a static tag with different carrier
frequencies (frequency domain), and c) multiple receive antennas (spatial domain)[9].
2. Proposed System
For long reading distances, power efficient antennas are crucial and their efficiency is directly proportional to the maximum reading distance of both semi-active and passive tags. This section includes an in-depth investigation of the requirements for the antenna part of HF RFID passive tags, with focus on antenna design, characterization and optimization from the perspectives of relation between antenna height and coverage area, tag-to-antenna distance and reader sensitivity. In this paper we have suggested the application of Smart Antenna (also known as adaptive array antennas or multiple antennas). To optimize the power supplied by antenna with respect to the current location of tags, we have proposed the use of Adaptive Power Control Algorithm.
A. Tag Detection
In case of a passive RFID system, information is sent to and read from RFID Tag by a reader using radio waves. The antenna in RFID reader transmits power to detect the tag in the coverage area of antenna. This power varies based on the distance of tag from the antenna. Data collected from tags is then passed through communication interfaces (cable or wireless) to host computer systems.
B. Power Distribution
control algorithm and transmits power to tags based on this calculation.
For this calculation we are using Hata propagation model for the path loss calculations. The parameters and constraints of this model is the most adaptive with our case. The parameters of this model are the frequency (150MHz-1500MHz), the T-R (transmitter-receiver) separation, effective receiver antenna height, and effective transmitter antenna height and correction factor for effective antenna height which is a function of the size of coverage area.
As we are working with RFID reader/tag, these parameters can be mapped to Hata model as frequency of RFID we are working with is 433 MHz, T-R separation as the distance between reader and tag, effective transmitter antenna height as reader antenna height and effective receiver height as tag antenna height.
C. Application of Adaptive Power Control Algorithm
For dealing with varying distances of the tags and the power transmitted to them based on the calculations of the distance to determine the received power of the tag, we have used Adaptive Power Control Algorithm. An adaptive algorithm or basically adaptive control system is an intelligent system where the information about a system is obtained while the process is still operating (run time) and based on the refreshed information, special interventions or adaptations are made to fulfill the control goal. [14] An adaptive control algorithm fulfills this goal by parameter estimation based on recently received data or inputs. In our case, we have worked with Water Filling algorithm, which is a common adaptive power control algorithm[10].
3. Working Methodology
As we are working with Radio Transmission we need to consider following factors such as path loss due to propagation, multipath propagation and fading of signals.
When radio wave travels from transmitter to receiver, as the interaction between antenna and tag is not line of sight and reflections from multiple objects, the electromagnetic waves travel along different paths of varying lengths.
The interaction between these waves causes
multipath fading and the strengths of the waves decrease as the distance between the transmitter and receiver increases. This also leads to path loss. Small scale fading is mainly the fluctuation of phase, amplitude or the multipath delay of a radio signal over the traveling distance of the signal. It is mainly caused by the interference between two or more versions of the transmitted signal that arrive at the receiver at different times.
Path loss can be defined as the reduction in power of an electromagnetic as it travels through space from transmitter to receiver and vice versa.
There are various propagation models which are used to define the path loss pattern such as free space propagation, Okumara, Hata models, Longley-Rice Model. For our analysis, we have used PCS extension of Hata model. For illustrating why we chose Hata model, as for example, let us consider Longley Rice model. This model is used for outdoor propagation but this is used for point to point communication, not multipath propagation. Moreover, this model does not provide any correction factor for environmental factors or obstacles such as buildings. The PCS extension of Hata model on the other hand provides necessary correctional factors and considers multipath propagation and consists of parameter within the range well suited for our work [11].
A. PCS extension Hata Model
Hata model is one of the most appropriate a path loss model which formulates the path loss provided by Okumara model. This model presents urban area propagation loss as a standard formula and also provides the appropriate correctional equation required to adjust the formula for adapting other situations as well.
While this model is valid for large cell communication system, but not suited for personal communication system with smaller cell radius (1 Km). As we are working with tags and readers which work with a comparatively smaller area, we have used PCS extension of Hata model for our analysis.
L(dB) = 46.3+ 33.9 logfc – 13.82loghte- a(hre) +
(44.9-6.55hte) logd
a(hre) = (1.1logfc - 0.7) hre - (1.56logfc - 0.8) dB
Pr = Pt -L
Where, L is path loss , hre is receiver antenna height
(tag height), hte is transmitter antenna height (reader
height) , fc is reader frequency ,d is T-R separation
distance( reader coverage area), Pr is received power ,
Pt is transmitted power, a(hre) is the receiver antenna
correction factor.
B. Water Filling Algorithm
We have used water filling algorithm for the intelligent power allocations to the corresponding receiver tag based on their T-R separation distance to compensate for the received power impairments.
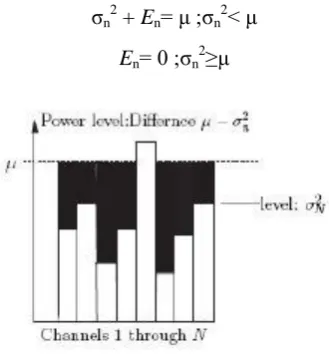
σn 2
+ En= μ ;σn 2< μ
En= 0 ;σn 2≥μ
Figure 4. Water Filling Algorithm
Hij is the channel gain fromTxi to Rxj with E|(hij)| 2
= 1
Hij=
Initialize Qi = 0, i = 1… K.
repeat;
for j = 1 to K;
Q’z =∑ HjQjHj
T
+ Qz
Qi = argmaxQ log|HjQHi T+ Q’
z |
end;
until the desired accuracy is reached;
Here, Q = error factor, e = error rate, σ = accepted level of power to be increased or decreased
C. Flow chart of Adaptive power control algorithm
Figure 5. Flow chart of adaptive power control algorithm
III.
SIMULATION AND RESULT DISCUSSION
A. Table of Parameters
Here lists of all parameters we have used are noted with respective units[12].
Table 1. List of parameters and units.
Parameters Values Units
RFID reader frequency
433 MHz
Transmitter Antenna Height
10 Meter
Receiver Antenna Height
2 Meter
Reader Sensitivity -95 dBm
Tx Power 1 Watt
Rx Power
Tx-Path loss
dBm
Path loss ~110 dB
T-R Separation Distance
500 Meter
B. Simulation and Result
The simulation and result with test cases are given below.
Figure 6. Received power vs T-R separation distance
This graph shows the graphical evolution of received power of for different tags against the T-R separation distance using the PCS extension of Hata model. We have considered three tags here with different distances from the reader. The reader sensitivity is -95 dBm. So, only the values above this level are acceptable.
In case of = 433 MHz, = 10 m, d=.5 km, =2 m We have found, 1.087 dB, L (dB) = 109.225 dB, = -106.225 dBm.
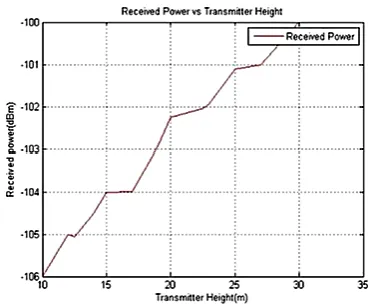
Figure 7. Received power vs Transmitter height
This graph shows the graphical evolution of received power for different tags against transmitter height using the PCS extension of Hata model. As the transmitter antenna height increases, the received power of tag antenna increases simultaneously.
In this case = 433 MHz = 10 m, d=.5 km, =2 m We have found, 1.087 dB, L (dB) = 109.225 dB, = -106.225 dBm.
Figure 7. Received power vs receiver height
This graph shows the graphical evolution of received power for different tags against receiver height using the PCS extension of Hata model. As the transmitter antenna height increases, the received power of tag antenna increases simultaneously. Here we found a straight line.
In this case = 433 MHz = 10 m, d=.5 km , =1m We have found, 1.1 dB, L (dB) = 111.41 dB, = -108.41 dBm.
C. Testing Table
Here we have provided the mathematical analysis and calculations for our implementation by using possible values or test cases for simulation.
Table 2. RFID reader transmit power received at the receiving end at variable T-R separation distance
T-R Seperation Distance Km
Received Power dBm
0.50 -106.225
0.45 -104.47
0.40 -102.50
0.35 -100.28
0.30 -97.717
0.25 -94.68
0.20 -90.96
0.15 -86.17
0.10 -79.41
Table 3. Testing result for variable Transmitter Antenna Height
Transmitter Height( )m Received Power( ) dBm
10 -106
12.5 -105.07
14 -104
15 -104
17 -103.99
19 -102.92
20 -102
22.5 -102.05
23 -101.93
25 -101
27 -101.11
32 -100.24
Table 4. Testing Results of variable Receiver Antenna Height
Receiver Height( ) m
Received Power( ) dBm
1 -108.41
1.5 -107.31
1.75 -106.77
2 -106.22
2.5 -105.12
2.75 -105.62
3 -104.02
D. Adaptive Power Control Algorithm
Here we are using Water Fillinginging algorithm to distribute 1 W (1W= 3dBm) power to three tags where the power is arbitrarily divided into these three tags eventually providing the farthest tag with the maximum received power. The following graphs show significant improvement over the graph using non adaptive approach.
1) Simulation Graphs
Figure 9. Received power vs T-R(km) using Adaptive Algorithm for Tag 1.(Pt=2.40 dBm)
This graph shows the improvement of the received power vs T-R distance graph using Adaptive Algorithm for tag 1.While with the non-adaptive approach, the total power (3dBm) is transmitted to the tag and with adaptive algorithm, the power transmitted to tag 1 is 2.40dBm. As we can see from the graph the T-R coverage distance for 2.40 transmitted powers has increased than the coverage area for 3 dBm transmitted power.
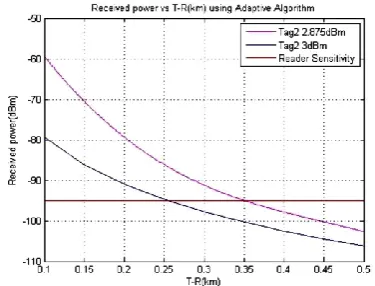
Figure 10. Received power vs T-R (km) using Adaptive Algorithm for Tag 2.(Pt=2.875 dBm, =433
MHz)
This graph shows the improvement of the received power vs T-R distance graph using Adaptive Algorithm for tag 3.While with the non-adaptive approach, the total power (3dBm) is transmitted to the tag and with adaptive algorithm, the power transmitted to tag 1 is 2.70dBm. As we can see from the graph the T-R coverage distance for 2.70 transmitted powers has increased than the coverage area for 3 dBm transmitted power.
Figure 11. Received power vs T-R(km) using Adaptive Algorithm for Tag 3 (Pt=2.70 dBm, =433
This graph shows the improvement of the received power vs T-R distance graph using Adaptive Algorithm for tag 3.While with the non-adaptive approach, the total power (3dBm) is transmitted to the tag and with adaptive algorithm, the power transmitted to tag 1 is 2.70dBm. As we can see from the graph the T-R coverage distance for 2.70 transmitted powers has increased than the coverage area for 3 dBm transmitted power.
Figure 12. Received power vs T-R(km) using Adaptive Algorithm for All Tags (433 MHz)
This graph represents the graphical improvement of all three tags using Adaptive algorithm over the non-adaptive approach. This demonstrates the improvement of distance coverage of all three tags we have taken as test cases using adaptive approach show an effective improvement over non-adaptive approach.
IV.
CONCLUSION
This paper addressed the effects of variable localization of passive RFID tags from reader to tag and the related issues such as power loss, inefficient tag detection, coverage area and distance constraints caused due to equal power distribution to the tags from reader. As possible optimal solution to said constraints, a novel scheme has been proposed which includes the use of smart antenna and adaptive algorithm to optimize and improve the power allocation and distance coverage of RFID system. For testing and simulations, we have run test cases (in this case 3 tags) which has shown significant improvement on the distance coverage and power allocation. This could result in power allocation to tags based on their power requirements with respect to the distance off tags from power source (reader antenna). As per our simulations and results, it can be inferred that using
adaptive power control algorithm by implementing Smart Antenna in RFID system could result in an overall improvement of the system. The next step of our proposal is to actually implement the proposed solution in practice to run the simulation using real data.
V.
REFERENCES
[1] Nazish Irfan and Mustapha C.E. Yagoub Khelifa Hettak(2012), ―Efficient, Approach for Redundant Reader Elimination for Directional Antenna in RFID Networks‖, International Journal of RFID Security and Cryptography (IJRFIDSC),‖ Volume 1, Issues ½. [2] Y. Bendavid, S. F. Wamba, and L. A. Lefebvre(2006),
―Proof of Concept of an RFID-Enabled Supply Chain in a B2B e- Commerce Environment‖, in Proceedings of the 8th International Conference on Electronic Commerce(ICEC’06), pp. 564-568.
[3] SHU-Yi Wong, Chunhong Chen(2006), ―Power Efficient Multi-Stage CMOS Rectifier Design For UHF RFID TAGS‖ Department of Electrical and Computer Engineering, University of Windsor, Ontario, Canada. [4] M. Kim and N. Y. Chong(2009), ―Direction sensing
RFID reader for mobile robot navigation.‖, IEEE Transactions on Automation Science and Engineering‖, 6(1):44–54.
[5] L. M. Ni, Y. Liu, Y. C. Lau, and A. P. Patil(2004), ―LANDMARC: indoor location sensing using active RFID‖, Wireless Networks,10:701–710, Springer Netherlands.
[6] G. Jin, X. Lu, and M. Park(2006), ―An indoor localization mechanism using active RFID tag‖ In Proc. of the IEEE International Conference on Sensor Networks, Ubiquitous, and Trustworthy Computing. Korea University, Seoul 136-701, Korea, IEEE. [7] P. Salonen, M. Keskilammi, L. Sydanheimo and M.
Kivikoski(2000), ―An intelligent 2.45 GHz beam-scanning array for modern RFID reader‖, In Proc. of the IEEE International Conference on PhasedArray Systems and Technology.
[8] P. V. Nikitin, R. Martinez, S. Ramamurthy, H. Leland, G. Spiess and K. V. S. Rao(2010), ―Phase based spatial identification of UHF RFID tags‖. In Proc of the IEEE International Conference on RFID.
[9] Prof Zoran Vukic(2000), ―A tutorial on adaptive control: The self tuning approach‖, University of Zagreb, Croatia, Faculty of Electrical Engineering and Computing. Pp.3-4, March 23, 2000.
[10] Theodore S. Rappaport,‖Wirless Communication‖. Pp. 110-120, 3rd edition 2006.
[11] IoanDor Landau, ―Adaptive Control: Algorithms, Analysis and Applications (Communications and Control Engineering)‖ pp. 69-80, 2nd edition.