R E S E A R C H A R T I C L E
Open Access
Development and validation of a Diabetes
Risk Score for screening undiagnosed
diabetes in Sri Lanka (SLDRISK)
P. Katulanda
1,2*, N. R. Hill
3, I. Stratton
4, R. Sheriff
2, S. D. N. De Silva
2and D. R. Matthews
1Abstract
Background:Screening for undiagnosed diabetes is not widely undertaken due to the high costs and invasiveness of blood sampling. Simple non-invasive tools to identify high risk individuals can facilitate screening. The main objectives of this study are to develop and validate a risk score for screening undiagnosed diabetes among Sri Lankan adults and to compare its performance with the Cambridge Risk Score (CRS), the Indian Diabetes Risk Score (IDRS) and three other Asian risk scores.
Methods:Data were available from a representative sample of 4276 adults without diagnosed diabetes. In a jack-knife approach two thirds of the sample was used for the development of the risk score and the remainder for the validation. Age, waist circumference, BMI, hypertension, balanitis or vulvitis, family history of diabetes, gestational diabetes, physical activity and osmotic symptoms were significantly associated with undiagnosed diabetes (age most to osmotic symptoms least). Individual scores were generated for these factors using the beta coefficient values obtained in multiple logistic regression. A cut-off value of sum = 31 was determined by ROC curve analysis.
Results:The area under the ROC curve of the risk score for prevalent diabetes was 0.78 (CI 0.73–0.82). In the sample 36.3 % were above the cut-off of 31. A risk score above 31 gave a sensitivity, specificity, positive predictive value and negative predictive value of 77.9, 65.6, 9.4 and 98.3 % respectively. For Sri Lankans the AUC for the CRS and IDRS were 0.72 and 0.66 repectively.
Conclusions:This simple non-invasive screening tool can identify 80 % of undiagnosed diabetes by selecting 40 % of Sri Lankan adults for confirmatory blood investigations.
Keywords:Diabetes, Screening, Risk score, Sri Lanka, South Asian
Background
Diabetes mellitus is increasing worldwide [1]. Type 2 diabetes accounts for over 90 % of prevalent cases in high risk populations such as South Asians and Pima Indians [2, 3]. Among those with type 2 diabetes 30 to 76 % remain undiagnosed according to different estimates [2, 4–7]. In a national level epidemiological study conducted in 2006 in Sri Lanka, the diabetes prevalence was reported as 10.3 % with 36 % remaining
undiagnosed [2]. Early diagnosis is important as in the United Kingdom Prospective Diabetes Study (UKPDS), 37 % of those newly diagnosed with type 2 diabetes had retinopathy [8]. A cross-sectional study in Sri Lanka reported 15 % retinopathy and 25 % neuropathy in newly diagnosed diabetic subjects [9]. These data suggest that type 2 diabetes may remain undiagnosed for many years leading to adverse diabetes related outcomes.
Early diagnosis and optimisation of therapy may improve outcomes in patients with diabetes, as tight control of blood glucose and blood pressure has been shown to reduce the incidence of microvascular complications in type 2 diabetic subjects [10, 11] and control of lipids reduces macrovascular disease and * Correspondence:prasad.katulanda@yahoo.com
1
Oxford Centre for Diabetes, Endocrinology and Metabolism, University of Oxford, Oxford, UK
2Diabetes Research Unit, Department of Clinical Medicine, Faculty of
Medicine, University of Colombo, Colombo 08, Sri Lanka Full list of author information is available at the end of the article
mortality in people with diabetes [12]. This reduction of risk of microvascular complications, myocardial infarc-ton and death from any cause persisted in 10 years of post-trial followup [13]. Since the diagnosis of diabetes requires invasive blood sampling and laboratory investi-gations, there is an ongoing debate about the benefit and the potential harm of screening for diabetes [14–17]. A recent study from UK has reported limited psychological impact on patients from screening for diabetes [18]. We hypothesise that if sensitive, specific and low cost tools (that are non-invasive) can be developed, large scale community level diabetes screening can be undertaken with a potential for the improvement of outcomes in otherwise undiagnosed people.
Questionnaire based risk screening tools have been developed for the detection of diabetes in other popula-tions [16, 19–21]. The aim of this study was to develop and validate a screening tool for undiagnosed diabetes in Sri Lanka based on demographic information. The per-formance of the risk tools developed for White Europeans in the UK by Griifin et al. [16] and Asian Indians by Rama-chandran et al. [22] were compared with our risk score.
Methods
Data from 4276 subjects without previously diagnosed diabetes from the Sri Lanka Diabetes and Cardiovascular Study (SLDCS) were used for risk score development and validation. SLDCS was a nationally representative study conducted in seven out of the nine provinces in Sri Lanka using a probability cluster-sampling technique. The study was approved by the Ethical Review Commit-tee of the Faculty of Medicine–University of Colombo. Informed written consent was obtained from all partici-pants. The sampling and data collection of this study has been reported previously [2]. Two thirds of this study population were randomly selected for the devel-opment of the risk score. The remaining third of the subjects were used for validation.
We used methods adopted for the development of the Finnish and Cambridge Risk scores [16, 21, 22]. We performed univariate regression analysis to select vari-ables that were associated with undiagnosed diabetes. Variables that could be easily measured in the commu-nity with minimal expertise and resources were included. We did not include area of residence, occupation and income. Multiple logistic regression analysis was carried out with newly diagnosed diabetes as the dependent variable and those variables identified from the univari-ate analyses at significance level <0.05.
Theβcoefficient values obtained in the logistic regres-sion analysis (without stepwise elimination) were used to derive a risk score. The sum ofβcoefficients in multiple regression analysis can be used to derive cumulative regression coefficients [23]. Data were analysed using
SPSS version 14 (SPSS Inc, Chicago IL, USA). Similar methods have been adopted in the development of the Finnish and Cambridge Risk scores [16, 21, 22]. The score was based on the beta coefficient multiplied by a factor of ten to allow integer scores. The total score was calculated as the sum of the individual weighted scores.
Diabetes was diagnosed using the 1989 WHO criteria using fasting and 2-h OGTT plasma glucose [24]. Physical activity was recorded (all activities including occupational, daily living and leisure time) using the short format of International Physical Activity Questionnaire (IPAQ) and categorised as low, moderate and active according to the IPAQ categorisation [25]. Hypertension was diagnosed when systolic blood pressure was ≥140 mmMg/ diastolic blood pressure ≥90 mmMg or if the subjects were on antihypertensive medications [26]. Balanitis was defined as persistent itching or soreness of the glans penis and vulvitis as persistent itching, soreness and discharge from the vulva. Frequent thirst, polyuria and nocturia were considered as osmotic symptoms.
The performance of the risk score in detecting preva-lent undiagnosed diabetes was evaluated using receiver-operating characteristic (ROC) curve analysis. The risk score value with combined highest sensitivity and specifi-city was considered the optimal cut-off value. The risk score was validated in the remaining one third of the population. The performance of the Cambridge Risk Score (CRS), the Indian Diabetes Risk Score (IDRS), two Chinese risk scores and a Thai risk score [16, 22, 27–29] when applied to the Sri Lankan population were compared with the newly derived risk score (SLDSRISK).
Results
In the 4276 subjects 196 had newly diagnosed diabetes. Metabolic, anthropometric and lifestyle characteristics are shown in Table 1. Women had higher mean 2-h plasma glucose and BMI compared to men (p< 0.001). They also had higher prevalence of physical inactivity (p< 0.001) and infections in the genital area compared to men (p< 0.001). Table 2 compares development and validation cohorts which shows no significant difference in the two groups with regard to any of the parameters.
Model development
and specificity. The risk score (Sri Lanka Diabetes Risk Score–SLDRISK) is available as a supplementary file.
Model validation
When we applied SLDRISK to the remaining one third of the sample (cohort 1450 people, 68 with newly diag-nosed Type 2 diabetes, 38.9 % had a score above 31 (risk-score positive). The risk score has a sensitivity of 77.9 % and a specificity of 63.0 %. The score has a positive predictive value (PPV) of 9.4 % and a negative predictive value (NPV) of 98.3 % for predicting prevalent
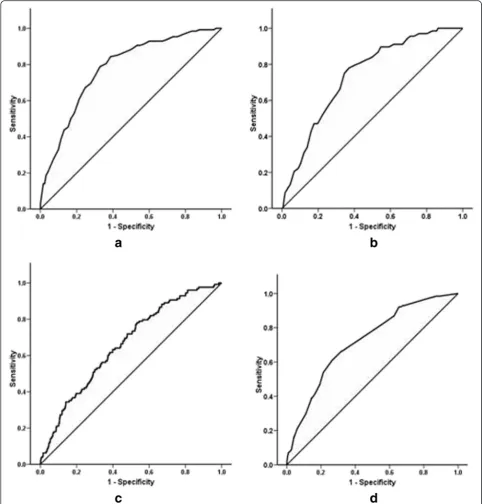
diabetes in the remaining one third of the subjects (Fig. 1a). The ROC curve analysis in the validation sample showed an AUC of 0.74.
Comparison of SLDRISK with Cambridge, Indian, Chineses and Thai Diabetes Risk Scores
The AUC of the CRS when applied to the Sri Lanka sample was 0.66 (0.62–0.71) with the cut-off for optimum combined sensitivity and specificity being 0.052 (Fig. 1c). Accordingly, the sensitivity, specificity, PPV and NPV for the CRS were 54.4, 59.3, 6.2 and 96.4 % (Table 4). The AUC of the IDRS was 0.72 (0.68–0.76) (Fig. 1d). The optimal cut-off for the IDRS was 21.5. The sensitivity, specificity, PPV and NPV of IDRS were 66.2, 66.1, 8.8 and 97.5 % respectively.
Two Chineses risk scores and a Thai risk score were also applied to the Sri Lanka sample. The optimal cut-offs for risk scores 1 [27], 2 [28] and 3 [29] were 7.5, Table 1Characteristics of the sample according to gender
Male Female All *pvalue
n
Age (years) 45.5 (15.8) 45.0 (14.5) 45.2 (15.1) 0.363
FPG (mmol/l) 4.9 (1.0) 4.8 (1.2) 4.9 (1.1) 0.375
2-h PG (mmol/l) 5.7 (2.9) 6.4 (2.8) 6.1 (2.8) < 0.001
BMI (kg/m2) 20.9 (3.7) 22.0 (4.5) 21.6 (4.2) < 0.001
Waist circumference (cm) 77.4 (10.8) 76.1 (12.1) 76.6 (11.6) < 0.001
Male sex (%) – – 40.0 –
Physical inactivity (%) 14.5 7.9 10.5 < 0.001
Family history of diabetes (%)
21.3 24.5 23.2 0.016
Hypertension (%) 24.3 24.5 24.4 0.955
Gestational diabetes (%) 1.2 – –
Osmotic symptoms (%) 14.1 13.6 13.8 0.661
Balanitis or vulvitis (%) 1.1 5.4 3.7 < 0.001
*pvalue–between male and female
Table 2Characteristics of the sample according to development and validation cohort
Development Validation All *pvalue
n
Age (years) 45.3 (15.1) 45.1 (14.9) 45.2 (15.1) 0.743
FPG (mmol/l) 4.9 (1.1) 4.9 (1.2) 4.9 (1.1) 0.796
2-h PG (mmol/l) 6.1 (2.9) 6.2 (2.8) 6.1 (2.8) 0.796
BMI (kg/m2) 21.6 (4.3) 21.6 (4.2) 21.6 (4.2) 0.815
Waist circumference (cm)
76.6 (11.8) 76.6 (11.3) 76.6 (11.6) 0.994
Male sex (%) 39.6 40.5 40.0 0.560
Physical inactivity (%) 10.7 10.2 10.5 0.971
Family history of diabetes (%)
23.3 23.2 23.2 0.971
Hypertension (%) 24.6 24.1 24.4 0.706
Gestational diabetes (%)
0.7 0.8 0.7 0.979
Osmotic symptoms (%) 13.0 15.4 13.8 0.027
Balanitis or vulvitis (%) 3.6 3.9 3.7 0.677
*pvalue–between development and validation
Table 3Multiple logistic regression analysis and individual scores for variables included in the risk score
Variables
(pvalue for diabetes)
Category Odds ratio (95 % CI)
β Contribution to Risk Score (10 ×β)
Age (years) (p= 0.000)
<30 Reference 0
30–39 2.6 (0.9–7.8) 0.95 10
40–49 4.8 (1.7–13.7) 1.57 16 ≥50 5.0 (1.8–14.2) 1.61 16 BMI (kg/m2)
(p= 0.000)
<18.5 Reference 0
18.5–22.9 1.7 (0.7–3.9) 0.52 5 ≥23.0 2.1 (0.8–5.2) 0.72 7 Waist circumference
(cm) (p= 0.000)
F < 70 / M <75
Reference 0
F (70–79)/M (75–84)
1.9 (0.9–4.1) 0.65 7
F≥80/M≥ 85
2.9 (1.3–6.6) 1.00 10
Hypertension (p= 0.000)
Absent Reference 0
Present 2.3 (1.6–3.4) 0.84 8
Family history of diabetes (p= 0.000)
Present Reference 0
Absent 1.7 (1.1–2.5) 0.52 5
Physical activity level (p= 0.008)
Sufficiently active
Reference 0
Moderately active
1.2 (0.8–1.8) 0.17 2
Inactive 1.4 (0.8–2.4) 0.32 3
Gestational diabetes (p= 0.270)
Absent Reference 0
Present 1.4 (0.3–6.8) 0.36 4
Balanitis or vulvitis (p= 0.034)
Absent Reference 0
Present 2.0 (0.9–4.4) 0.71 7
Osmotic symptoms (p= 0.024)
Absent Reference 0
27.5 and 6.5 respectively. SLDRISK performed better than all these other Asian risk scores in predicting prevalent diabetes in Sri Lankan population (Table 5).
Discussion
In this study we have developed and validated a tool for community level screening of undiagnosed diabetes in a high risk South Asian population. The SLDRISK can be
used by local health care workers in a village setting or in health centres wihtout needing hospital or laboratory support. It can be used with minimal expertise. The AUC of 0.78 for the SLDRISK indicated satisfactory predictabil-ity of prevalent undiagnosed diabetes in Sri Lankan adults. The score would detect 78 % of those with undiagnosed diabetes in the community by identifying 39 % of risk score positive adults in the general population. This
non-Fig. 1ROC curves for SLDRISK, CRS and IDRS.aandbshows SLDRISK on cohorts 1 and 2 respectively.cshows the CRS on cohort 1.
invasive tool has the potential to be used for targeting individuals for definitive diabetes diagnostic screening at a population level.
Many systematic reviews have been done over the years on diabetic risk scores. Collins et al. reviewed 39 similar studies done before 2011 [30]. Age, Family history of diabetes, hypertension, BMI and waist circumference were the most frequenly used risk predictors in those studies. All these risk predictors are included in our study as well.
The CRS risk score which showed an AUC of 0.80 for the White Europeans was less predictive for the Sri Lankan population (AUC 0.66). The positive predictive value of CRS for Sri Lankans at an optimal cut-off value of 0.052 was 6.2 % compared to 9.4 % in the SLDRISK. The IDRS performed comparable to the SLDRISK in Sri Lankans (AUC 0.72 vs. 0.78, PPV 8.8 vs. 9.4). This highlights the importance of using ethnic specific tools in epidemiology and disease screening. In the SLDRISK we have used common diabetes symptoms that were not used in the CRS and the IDRS to increase the sensitivity of the risk score.
Our projections of diabetes in Sri Lanka indicate a prevalence of 13.9 % in 2030 [2]. Other countries in South Asia like India, Pakistan and Bangladesh are also having high prevalence of diabetes [31–37]. This has necessitated effective primary and secondary preventive measures to prevent the rising prevalence as well as diabetes related adverse health outcomes in this ethnic group. Therefore, low cost and non-invasive epidemio-logical tools such as SLDRISK are of particular value in South Asian countries with limited healthcare resources and high disease burden.
Conclusions
In conclusion, we have developed and validated a simple, low-cost and a non-invasive tool for stepwise commu-nity level screening of undiagnosed diabetes in a high risk South Asian population in Sri Lanka. Our risk score is comparable to the one developed for Asian Indians by Ramachandran et al. and can be used in Sri Lanka and perhaps among other South Asians for community level screening programmes for diabetes.
Abbreviations
CRS, Cambridge Risk Score; IDRS, Indian Diabetes Risk Score; BMI, body mass index; ROC, receiver operating characteristic; AUC, area under the curve; SLDCS, Sri Lanka Diabetes and Cardiovascular Study; IPAQ, International Physical Activity Questionnaire; SLDRISK, Sri Lanka Diabetes Risk Score
Acknowledgements
The additional support provided from the Oxford Centre for Diabetes Endocrinology and Metabolism, UK and the NIHR Biomedical Research Centre Programme is gratefully acknowledged. PK is a Commonwealth Postgraduate Scholar. We thank the Diabetes Association of Sri Lanka and the World Health Organization Office in Colombo for the support for lipid assays. The authors thank all individuals and institutions who helped and worked for the SLDCS (http://www.ocdem.ox.ac.uk/_asset/file/annual-report-2010.pdf).
Funding
The National Science Foundation of Sri Lanka was the main source of funding for the SLDCS. Funding body did not interfere with design of the study, data collection, data interpretation or writning the manuscript.
Availability of data and materials
The datasets during and/or analysed during the current study available from the corresponding author on reasonable request.
Authors’contributions
PK developed the research methodology and coordinated data collection and reviewed final manscript. NRH contributed to develop research methodology and to write the manuscript. IS analysed data and reviewed manuscript. RS was involved in developing research methodology and coordinated data analysis and reviewed manuscript. SDNDS contributed to results and discussion parts of the paper, contributed to data analysis and coordinated submission process. DRM coordinated OCDEM in research partnership reviewed the manuscript and developed research concept. All authors read and approved the final manuscript.
Competing interests
The authors declare that they have no competing interests.
Consent for publication
Not applicable.
Ethics approval and consent to participate
The study was approved by the Ethical Review Committee of the Faculty of Medicine–University of Colombo. Informed written consent was obtained from all participants.
Author details
1
Oxford Centre for Diabetes, Endocrinology and Metabolism, University of Oxford, Oxford, UK.2Diabetes Research Unit, Department of Clinical
Medicine, Faculty of Medicine, University of Colombo, Colombo 08, Sri Lanka.
3Nuffield Department of Primary Care Health Sciences, University of Oxford,
Oxford, UK.4Gloucestershire Hospitals NHS Foundation Trust, Gloucester, UK.
Received: 6 February 2016 Accepted: 15 July 2016
Table 4The performance of SLDRISK, CRS and the IDRS in the Sri Lankan adult population
SLDRISK IDRS CRS
AUC 0.78 0.72 0.66
Sensitivity (%) 77.9 66.2 54.4
Specificity (%) 65.6 66.1 59.3
Positive predictive value (%) 9.4 8.8 6.2
Negative predictive value (%) 98.3 97.5 96.4
Table 5The performance of SLDRISK compared to two Chinese risk scores and a Thai risk score in the Sri Lankan adult
population
SLDRISK RS 1 [27] RS 2 [28] RS 3 [29]
AUC 0.78 0.70 0.77 0.76
Sensitivity (%) 77.9 65.5 71.0 62.2
Specificity (%) 65.6 64.9 73.0 69.5
Positive predictive value (%) 9.4 7.7 11.1 8.7
References
1. Wild S, et al. Global prevalence of diabetes: estimates for the year 2000 and projections for 2030. Diabetes Care. 2004;27(5):1047–53.
2. Katulanda P, et al. Prevalence and projections of diabetes and pre-diabetes in adults in Sri Lanka—Sri Lanka Diabetes, Cardiovascular Study (SLDCS). Diabet Med. 2008;25(3):1062–9.
3. Sicree R, Shaw J, Zimmet P. Diabetes and impaired glucose tolerance. In: Gan D, editor. Diabetes atlas. Belgium: International Diabetes Federation; 2006. p. 22–37.
4. Aekplakorn W, et al. Prevalence and management of diabetes and associated risk factors by regions of Thailand: Third National Health Examination Survey 2004. Diabetes Care. 2007;30(8):2007–12. 5. Cowie CC, et al. Prevalence of diabetes and impaired fasting glucose in
adults in the U.S. population: National Health And Nutrition Examination Survey 1999–2002. Diabetes Care. 2006;29(6):1263–8.
6. Gu D, et al. Prevalence of diabetes and impaired fasting glucose in the Chinese adult population: International Collaborative Study of
Cardiovascular Disease in Asia (InterASIA). Diabetologia. 2003;46(9):1190–8. 7. Ramachandran A, et al. Temporal changes in prevalence of diabetes and
impaired glucose tolerance associated with lifestyle transition occurring in the rural population in India. Diabetologia. 2004;47(5):860–5.
8. Kohner EM, Aldington SJ, Stratton IM, Manley SE, Holman RR, Matthews DR, et al. United Kingdom Prospective Diabetes Study, 30: diabetic retinopathy at diagnosis of non-insulin-dependent diabetes mellitus and associated risk factors. Arch Ophthalmol. 1998;116(3):297–303.
9. Weerasuriya N, et al. Long-term complications in newly diagnosed Sri Lankan patients with type 2 diabetes mellitus. QJM. 1998;91(6):439–43. 10. UKPDS. Intensive blood-glucose control with sulphonylureas or insulin compared with conventional treatment and risk of complications in patients with type 2 diabetes (UKPDS 33). UK Prospective Diabetes Study (UKPDS) Group. Lancet. 1998;352(9131):837–53.
11. UKPDS. Tight blood pressure control and risk of macrovascular and microvascular complications in type 2 diabetes: UKPDS 38. UK Prospective Diabetes Study Group. BMJ. 1998;317(7160):703–13.
12. Collins R, et al. MRC/BHF Heart Protection Study of cholesterol-lowering with simvastatin in 5963 people with diabetes: a randomised placebo-controlled trial. Lancet. 2003;361(9374):2005–16.
13. Holman RR, et al. 10-year follow-up of intensive glucose control in type 2 diabetes. N Engl J Med. 2008;359(15):1577–89.
14. Echouffo-Tcheugui JB, Sargeant LA, Griffin SJ. We should continue talking about screening for Type 2 diabetes. Diabet Med. 2007;24(8):924. author reply 924–5. 15. Engelgau MM, Narayan KM, Herman WH. Screening for type 2 diabetes.
Diabetes Care. 2000;23(10):1563–80.
16. Griffin SJ, et al. Diabetes risk score: towards earlier detection of type 2 diabetes in general practice. Diabetes Metab Res Rev. 2000;16(3):164–71. 17. Stephens JW, Williams R. Time to stop talking about screening for diabetes?
Diabet Med. 2006;23(11):1163–4.
18. Eborall HC, et al. Psychological impact of screening for type 2 diabetes: controlled trial and comparative study embedded in the ADDITION (Cambridge) randomised controlled trial. BMJ. 2007;335(7618):486. 19. Al-Lawati JA, Tuomilehto J. Diabetes risk score in Oman: a tool to identify
prevalent type 2 diabetes among Arabs of the Middle East. Diabetes Res Clin Pract. 2007;77(3):438–44.
20. Glumer C, et al. A Danish diabetes risk score for targeted screening: the Inter99 study. Diabetes Care. 2004;27(3):727–33.
21. Lindstrom J, Tuomilehto J. The diabetes risk score: a practical tool to predict type 2 diabetes risk. Diabetes Care. 2003;26(3):725–31.
22. Ramachandran A, et al. Derivation and validation of diabetes risk score for urban Asian Indians. Diabetes Res Clin Pract. 2005;70(1):63–70.
23. Kirkwood BR, Sterne JAC. Goodness of fit and regression diagnostics. In: Essential medical statistics. Malden: Blackwell Science; 2003. p. 107–17. 24. Alberti KG, Zimmet PZ. Definition, diagnosis and classification of diabetes mellitus
and its complications. Part 1: diagnosis and classification of diabetes mellitus provisional report of a WHO consultation. Diabet Med. 1998;15(7):539–53. 25. Craig CL, et al. International physical activity questionnaire: 12-country
reliability and validity. Med Sci Sports Exerc. 2003;35(8):1381–95.
26. Chobanian AV, et al. The seventh report of the Joint National Committee on Prevention, Detection, Evaluation, and Treatment of High Blood Pressure: the JNC 7 report. JAMA. 2003;289(19):2560–72.
27. Ko G, et al. A simple risk score to identify southern Chinese at high risk of diabetes. Diabet Med. 2010;27:644–9.
28. Zhou X, et al. Nonlaboratory-based risk assessment algorithm for undiagnosed type 2 diabetes developed on a nation-wide diabetes survey. Diabetes Care. 2013;36(12):3944–52.
29. Aekplakorn W, et al. A risk score for predicting incident diabetes in the Thai population. Diabetes Care. 2006;29(8):1872–7.
30. Collins GS, et al. Developing risk prediction models for type 2 diabetes: a systematic review of methodology and reporting. BMC Med. 2011;9:103. 31. Hussain A, et al. Type 2 diabetes in rural and urban population: diverse
prevalence and associated risk factors in Bangladesh. Diabet Med. 2005; 22(7):931–6.
32. Mohan V, Farooq S, Deepa M. Prevalence of fibrocalculous pancreatic diabetes in Chennai in South India. JOP. 2008;9(4):489–92.
33. Mohan V, et al. Urban rural differences in prevalence of self-reported diabetes in India–the WHO-ICMR Indian NCD risk factor surveillance. Diabetes Res Clin Pract. 2008;80(1):159–68.
34. Ramachandran A, et al. High prevalence of diabetes and cardiovascular risk factors associated with urbanization in India. Diabetes Care. 2008;31(5):893–8. 35. Seshiah V, et al. Prevalence of gestational diabetes mellitus in South India
(Tamil Nadu)–a community based study. J Assoc Physicians India. 2008;56:329–33.
36. Shera AS, Jawad F, Maqsood A. Prevalence of diabetes in Pakistan. Diabetes Res Clin Pract. 2007;76(2):219–22.
37. Zargar AH, et al. Prevalence of diabetes mellitus and other abnormalities of glucose tolerance in young adults aged 20–40 years in North India (Kashmir Valley). Diabetes Res Clin Pract. 2008;82(2):276–81.
• We accept pre-submission inquiries
• Our selector tool helps you to find the most relevant journal
• We provide round the clock customer support
• Convenient online submission
• Thorough peer review
• Inclusion in PubMed and all major indexing services
• Maximum visibility for your research
Submit your manuscript at www.biomedcentral.com/submit