R E S E A R C H A R T I C L E
Open Access
Correcting the predictive validity of a
selection test for the effect of indirect
range restriction
Stefan Zimmermann
*, Dietrich Klusmann and Wolfgang Hampe
Abstract
Background:The validity of selection tests is underestimated if it is determined by simply calculating the predictor-outcome correlation found in the admitted group. This correlation is usually attenuated by two factors: (1) the combination of selection variables which can compensate for each other and (2) range restriction in predictor and outcome due to the absence of outcome measures for rejected applicants.
Methods:Here we demonstrate the logic of these artifacts in a situation typical for student selection tests and compare four different methods for their correction: two formulas for the correction of direct and indirect range restriction, expectation maximization algorithm (EM) and multiple imputation by chained equations (MICE). First we show with simulated data how a realistic estimation of predictive validity could be achieved; second we apply the same methods to empirical data from one medical school.
Results:The results of the four methods are very similar except for the direct range restriction formula which underestimated validity.
Conclusion:For practical purposes Thorndike’s case C formula is a relatively straightforward solution to the range restriction problem, provided distributional assumptions are met. With EM and MICE more precision is obtained when distributional requirements are not met, but access to a sophisticated statistical package such as R is needed. The use of true score correlation has its own problems and does not seem to provide a better correction than other methods.
Keywords:Predictive validity, Student selection, Range restriction, Suppression, Mice, EM
The problem
If the predictive validity of an admission test is low, its employment is hard to justify. Therefore a trustworthy estimation of predictive validity is needed. The predict-ive validity of a test is defined as the correlation of its scores with an outcome criterion. However in many test situations this correlation is not directly calculable. Here we consider two complications which lead to an under-estimation of predictive validity:
1. The selection decision is based on multiple criteria, which can compensate for each other. This generates a negative correlation between predictors which attenuates the predictor-outcome correlation for each of them.
2. As outcome data are not available for rejected appli-cants the range of predictors as well as of the criterion variable is restricted and this attenuates the predictor-outcome-correlation.
Both problems are often ignored or treated superfi-cially. This seems to reflect a lack of communication between psychometric statisticians and applied re-searchers, who may feel deterred by the multitude of methods offered and their seemingly inscrutable subtle-ties [1]. In this article we will describe the problems of calculating predictive validity in an illustrative scenario using artificial data, then demonstrate methods for their solution, and finally apply these methods to real data from an entrance test for medical school which is used in combination with high school GPA (hGPA) in Germany. We hope that applied researchers will find * Correspondence:[email protected]
Department of Biochemistry and Molecular Cell Biology, University Medical Center Hamburg-Eppendorf, Martinistraße 52, D-20246 Hamburg, Germany
this account helpful for their understanding of artifact correction in validity estimation and finally adopt one of the proposed solutions in their own research.
Illustrative scenario
Let’s imagine a situation typical for student selection: Two selection variables X1 (for example an entrance
test) and X2(for example hGPA) are combined into a
se-lection score Z = X1+ X2. Applicants are admitted
ac-cording to their rank order on Z. In the following, we present artificial data generated to illustrate the scenario. We use the software R with the package MASS [2] to draw data points for X1, X2, and Y from a standard
nor-mal random distribution (mean = 0, sd = 1) restricted to yield the following correlations:ρyx1∣a ¼:60,ρyx2∣a¼:20, andρx1x2∣a¼:00, (N= 1000 applicants).
Following the terminology of McManus [3] the total sample of all test takers is called“applicants”, and the se-lected subgroup (here 20% of applicants) is called “ in-cumbents” because this group usually is entitled to something, e.g. a study place. In this article we denote applicants witha, incumbents withi. Examples:ryx1∣a is
the correlation between the outcome Y (study success) and the predictor X1(test) in the applicants,ryx1•2∣i is the
correlation between the outcome Y and the predictor X1
in the incumbents after the linear effect of X2 (hGPA)
has been removed from X1. X1is the predictor of
inter-est - we want to know how well the tinter-est performs in pre-dicting the outcome Y independent of X2. While X1and
X2are measured in all applicants, the outcome variable
Y is only measured in the incumbents. Thus,ryx1 is only
defined in the incumbents (ryx1∣i), as we do not have
data about the outcome from the rejected applicants. Still we want to know the relationship between X1and Y
in the unrestricted sample (ryx1∣a).
Compensatory selection
Here we demonstrate why compensatory selection is a factor that attenuates the estimation of predictive valid-ity. If two measures are combined into a sum that is used for the selection decision, e.g. a test score for nat-ural science knowledge (X1), and high school grade point
average (hGPA) (X2) a low test score might be
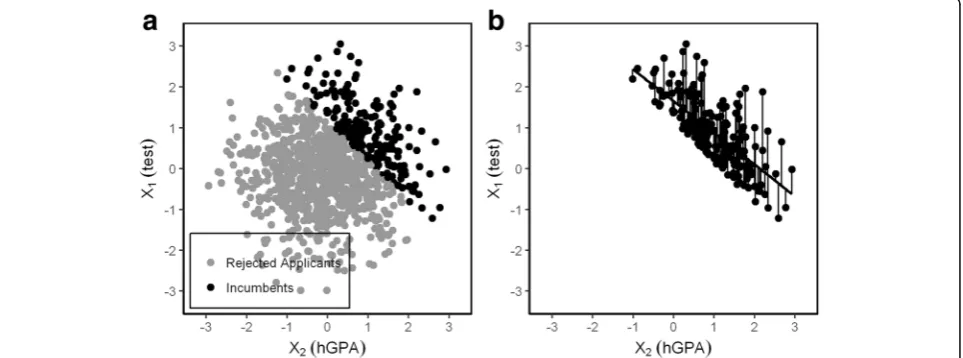
compen-sated by a high hGPA and vice versa. Only if both mea-sures are low an applicant will be rejected which creates a negative correlationrx1x2∣iin the incumbents (Fig. 1).
The negative correlation has repercussions for predict-ive validity: the negatpredict-ive correlation rx1x2∣i generated by
the selection procedure diminishes the correlations of each of the two predictors with the outcome Y - a sup-pressor effect occurs. A supsup-pressor variable is a variable, which increases the predictive validity of another vari-able (or a set of varivari-ables) by its inclusion in a regression equation. It improves predictability by purging some ir-relevant variance from other predictors [4].
Reciprocal suppression is the case we are concerned with: Two negatively correlated predictors act as suppres-sors for each other. Reciprocal supression has been thor-oughly analyzed by Lutz [5] and Conger [6]. In our case the origin of the negative correlation is clear: It is the compensatory selection rule that has eliminated all appli-cants with low values in both variables from the sample. The correlation of X1and X2in the unrestricted sample of
applicants is almost zero (rx1x2∣a ¼0:01 ), but in the
Fig. 1aScattergram of X1and X2. 20% of 1000 applicants are selected by the sum of X1and X2; the circular cloud representing all
applicants is divided by a diagonal line that separates the top right area from the bottom left area.bThis generates a negative correlation between X1and X2in the incumbentsðrx1x2∣i¼−0:71Þ. Residuals of X1after the linear effect of X2is removed. They are
expressed as deviations from the regression line: The residuum of X1when the influence of X2is removed is the observed X1value
restricted sample of incumbents it is negative (rx1x2∣i¼−
0:71 ) because whenever the value of one variable is low the value of the other variable must be moderately high at least - otherwise the applicant would have been rejected. This has implications for the relation of both predictors X1and X2to the outcome Y within the incumbents.
An applicant with a low hGPA (X2) can still be
ac-cepted if her entrance test result (X1) is superior. A low
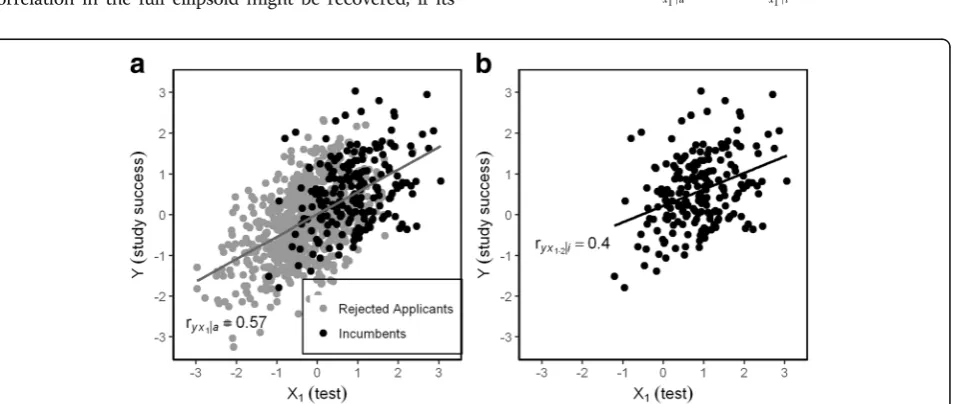
hGPA would predict less study success (Y), whereas a high test results would predict more study success. Thus the negative relation between the test score and hGPA would mask the predictive power of the test. This also goes vice versa, if entrance test and hGPA change places. Multiple regression removes the effect of reciprocal sup-pression as it shows the independent contribution of each predictor after controlling for all other predictors (similar to the calculation of the residuals in Fig. 1). The beta coefficients of the two predictors exceed their first order correlations with the criterion (Fig. 2). However beta coefficients are not correlations, but weights which determine how much Y is expected to respond if X1
changes one unit of a standard deviation. This is espe-cially helpful if we want to compare the influence of multiple variables that possess different measurement units [7]. As we need to assess the validity of X1 as a
unique predictor the semipartial correlation is more suit-able because it represents the correlation of the residuals of X1after the linear effect of X2has been taken out [8].
The semipartial coefficient has the same numerator as the standardized regression coefficient β but a slightly
different denominator, ffiffiffiffiffiffiffiffiffiffiffiffiffiffi1−r2
x1x2
q
instead of the square of
this term, 1−r2
x1x2. While the semipartial coefficient is
bound between −1 and +1, the standardized regression coefficient is not. The semipartial correlationsryx1•2∣iand
ryx1•2∣i not only correct for the compensatory selection
procedure but for any effect X2may have on X1and vice
versa. So our first step to the correction of the empirical predictor-outcome correlation is to exclude the effect of reciprocal suppression by computing the semipartial cor-relation. Instead of ryx1∣i¼:37 we obtain ryx1•2∣i¼:40 as
an estimation of predictive validity corrected for com-pensatory selection. This still deviates from the true cor-relation which we know because we work with artificial data: ryx1∣a¼0:57: The difference between ryx1•2∣i¼:40
and ryx1∣a¼0:57 must be attributed to the effect of
range restriction.
Range restriction
Correlations derived from the subgroup of selected ap-plicants are often simply reported as indicators of pre-dictive validity without correcting for the effects of multiple selection variables and range restriction [9]. This error has been observed more than half a century before: Cyril Burt exposed the “time-honoured fallacy”, of,“judging the efficiency of [an] examination as a mean of selection by stating its efficiency as a means of pre-dicting the order of merit within the selected group”, [10] p. 2. This is an instance of the fallacy of compos-ition, which arises whenever one infers that something is true of the whole from the fact that it is true of some part of the whole, in this case the correlation coefficient for the whole group of applicants taken erroneously as identical to the correlation coefficient for the admitted applicants. McManus deplores the widespread tolerance for this fallacy and the consequential misinterpretation of findings: “Even in prestigious journals a naïve inter-pretation can be made that selection measures, such as A-level grades, are actually of little value”[3], p. 4.
Many studies in the field of predictive validity do not cor-rect for range restriction. For example a recent article on
Fig. 2Relations between X1, X2, and Y in applicants and incumbents for 20% selection rate.ryx1: first order correlation,βyx1: beta coefficient,ryx1•2:
the validity of the UKCAT reports uncorrected predictor-outcome correlations as validity coefficients [11]. Such coef-ficients are typically very low and lead to disappointing con-clusions about the predictive validity of a test or attempts to shrug off such conclusions. As attenuation due to range restriction is inversely associated with the selection rate its omission is particularly detrimental in highly selective ad-mission procedures as in selection for medical school. Arti-ficially low validity coefficients are not in the interest of most research teams, so why does this happen? Perhaps some researchers do not know that range restriction is a problem, or they know, but feel uneasy about remedial ac-tion because it feels like arbitrarily jacking up a correlaac-tion coefficient or“armchair magnification”[10], p. 13. However corrected correlations are less biased than uncorrected cor-relations, even when assumptions are not met fully [12, 13]. Correction for range restriction is recommended by the So-ciety for Industrial and Organizational Psychology as a mat-ter of routine [14].
How can we estimate the predictive validity for all appli-cants if we have no outcome data for a large part of the sample? A multitude of methods have been developed to achieve this feat in a variety of testing situations [1]. The menu of suitable methods comprises multiple correction formulas using different sets of assumptions as well as maximum likelihood methods of missing value imputa-tions such as Bayesian Monte Carlo methods [15–17].
Imagine an ellipsoid of points in two-dimensional space representing the unknown predictor/outcome cor-relation in the total sample (Fig. 3a). If the lower part of the ellipsoid is removed by a selection rule, only the black points at the right side remain and this cloud cor-responds to a correlation coefficient much lower than the one that corresponds to the full ellipsoid (Fig. 3b). The correlation in the full ellipsoid might be recovered, if its
shape continued from the known black points to the right to the unknown gray points to the left in an orderly way.
We will consider four methods for correcting the ef-fect of range restriction:
1. Thorndike’s case A formula for selection with a single variable
2. Thorndike’s case C formula for indirect selection 3. Expectation Maximization (EM)
4. Multiple imputation if missing values by chained equations (MICE)
Methods 2–4 handle indirect range restriction, so a correction for the effect of reciprocal suppression due to compensatory selection is not necessary. We included this analysis for clarification, not with the intention to use the semipartial correlationryx1•2∣i, albeit with one
ex-ception: In Thorndike’s case A formula we replace X1by
the residual X1•2, thusryx1∣ibyryx1•2∣iin order to account
for the suppression caused by X2.
Thorndike’s case A formula [18] is widely used for the correction of range restriction. This formula estimates the correlation in the non-restricted sample (non-restricted correlation), if three coefficients are given: (1) the re-stricted correlation ryx1∣i (2) the restricted standard
devi-ation SDx1∣i and (3) the non-restricted variance SDx1∣a:It
works in a situation where the performance of a single predictor X1is evaluated with an outcome Y.
Thorndike’s case A formula depends on two assump-tions [19]:
1. Linearity.ba¼ ryx1∣a
SD2
x1∣a¼bi¼
ryx1∣i
SD2 x1∣i
2. Homoscedasticity. The error varianceein Y is the difference between the observed Y value and the expected value in Y that the regression model implies. Homoscedasticity requires the error varianceeto be equal for the applicants and the incumbents:
SD2e∣a¼SD2y∣a 1−r2yx1∣a
¼SD2e∣i¼SD2y∣i 1−r2yx1∣i
Let u¼SDx1∣a
SDx1∣i be the ratio of unrestricted to restricted
standard deviation.
Then the estimation of the unrestricted correlation ryx1∣a follows unambiguously from assumptions (a) and
(b). After some transformation (see [20]) the result is: ryx1∣a¼
uryx1∣i ffiffiffiffiffiffiffiffiffiffiffiffiffiffiffiffiffiffiffiffiffiffiffiffiffiffiffiffiffi
1−r2
yx1∣iþur
2
yx1∣i
r
If the error variance in Y is equal at any level of X1
(ho-moscedasticity), then it does not matter at which location on the X-axis the distribution has been cut by the selec-tion rule as long as the cut is clean and not rendered fuzzy by the involvement of a third variable such as X2.
In the empirical literature Thorndike’s case A formula is often used even when selection is also guided by other variables than X1 (indirect selection). Schmidt and
Hunter [21] demonstrated that this regularly leads to substantial underestimation of the unrestricted correl-ation coefficient. We include Case A in our list of cor-rection methods to demonstrate the magnitude of underestimation caused by ignoring indirect selection.
2. Thorndike’s case C formula for indirect selection. In our simulation we have a second selection variable X2,
which is not envisaged by Thorndike’s case A formula. If multiple variables are used for selection, a compound se-lection variable Z is formed as a function of X1, X2, …
Xk, e.g. Z = X1+ X2+…+ XkThorndike’s case C formula
incorporates such indirect (sometimes called incidental) selection based on Z, of which the variable of interest, X1, only is a part [22]:
ryx1∣a¼
r2
yx1∣iþðu−1Þryx1∣i
ffiffiffiffiffiffiffiffiffiffiffiffiffiffiffiffiffiffiffiffiffiffiffiffiffiffiffiffiffiffiffiffi
1þðu−1Þr2
yx1∣i
q ffiffiffiffiffiffiffiffiffiffiffiffiffiffiffiffiffiffiffiffiffiffiffiffiffiffiffiffiffiffiffiffi
1þðu−1Þr2
zx1∣i
q
The EM algorithm computes maximum likelihood es-timates from incomplete data [23]. It fills in missing values (in our case the missing Y-values of rejected ap-plicants) with their expectations conditional to a set of currently assumed parameter values (Expectation-step), then reestimates these parameters (in our case r^yx1∣a)
and repeats the process until the estimates exhibit no important change (Maximization-step). An important assumption for an unbiased estimation of the EM
algorithm concerns the mechanism that leads to the missing values. EM as well as MICE as a multiple imput-ation algorithm require data to be missing at random (MAR): if a variable is missing, it should not depend on its value itself but on other variables that could be ob-served and that are included in the model [24]. In a study which investigated the reconstruction of validity coefficients in the context of driving learners, the au-thors used a convincing research design. For the purpose of the study, driving learners who failed the theoretical test were also admitted for the practical driving test. They could show that EM performed well in predicting the true validity from an artificial restricted dataset [17]. In our analysis, we are using the EM algorithm as imple-mented in the package Selection for R [25].
4. The MICE algorithmis the most recent and accord-ing to its advocates the most accurate approach [15]. The acronym stands for Multiple Imputation by Chained Equations A multiple imputation analysis consists of three distinct steps: the imputation phase, the analysis phase, and the pooling phase. In the imputation phase a number m of complete datasets are created which con-tain different plausible estimates of the missing values, but identical values for the observed data. In the analysis phase, each complete dataset is analyzed with conven-tional statistical methods. In the pooling phase the m parameter estimates are pooled into a single set of par-ameter estimates by calculating simply the arithmetic average of the mestimates from the analysis phase. Via multiple imputations the variance in the variables with missing values is handled more realistically than in EM. MICE is a Bayesian type of estimation. In Bayesian sta-tistics, a prior distribution of parameter values is modi-fied in the light of new evidence to obtain a posterior distribution of improved estimates. MICE uses Markov chain Monte Carlo (MCMC) methods to find the poster-ior distribution of the parameters. MCMC algorithms need a large number of steps and therefore are CPU-intensive. Only with the recent advent of powerful PCs such methods have become widely available for applied research. We use the package MICE for R [26].
Study 1: Monte Carlo simulation
The data shown to illustrate the issue of range restriction were used in a Monte Carlo simulation. We rerun the il-lustrative scenario (ρyx1∣a¼:60, ρyx2∣a ¼:20, and ρx1x2∣a
¼:00,N= 1000 applicants) 1000 times and varied the stu-dent selection ratio (10%, 20% and 30%) that leads to missing data on Y for the rejected applicants. As we know ryx1∣a from the data generation process we can test the
precision of methods promising to inferryx1∣a, fromryx1∣i.
determine a point estimate and the variability for each correction method. The unrestricted correlation estimated by one of the four methods is denoted by r^yx1∣a. The
dif-ference betweenrand^r is the error of estimation for the unrestricted correlation. We use this indicator to assess the precision of the four correction methods. A value of 0.0 means that the unrestricted correlation coefficient could be perfectly recovered based on the data of the incumbents.
Results
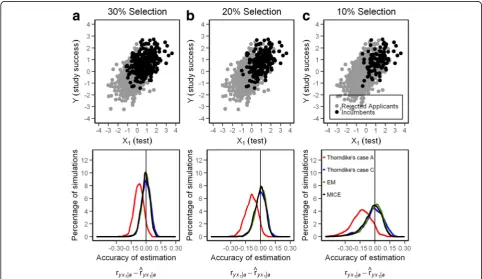
The modal value of all correction methods (r^yx1∣aÞ,
ex-cept for Thorndike’s case A, is fairly close to the target value of ryx1∣a (Fig. 4a-c). Table 1 also shows the root
mean square error (RMSE). RMSE is the standard devi-ation of the prediction error. It shows how close the re-covered validity coefficients are to the true validity. Lower values of RMSE indicate better fit.
Thorndike’s case A formula shows a small bias as the distributions peak left of the true correlation underesti-mating predictive validity, even when the first order cor-relation ryx1∣a was replaced by the semipartial correlation
ryx1•2∣a. However, the true correlation lies well within the
confidence interval of the 1000 replication runs showing that this bias is rather insignificant. The smallest confi-dence interval of estimations forr^yx1∣a is delivered by EM
and the largest by the formulas for direct and indirect range restriction. With the simulation problem at hand, MICE did not perform better than EM although MICE is regarded as the most advanced method for coefficients estimation when data are missing [15].
The variation of estimated unrestricted correlations not only depends on the precision of the method, but even more so on the ratio of selection. If the selected group gets smaller (20% in Fig. 4b and 10% in Fig. 4c) the confidence interval grows larger up to a point were usefulness becomes questionable (Table 1).
Study 2: Application to an entrance test for medical school
In this study we demonstrate a correction for compensa-tory selection and range restriction with data obtained from the Hamburg Natural Science -Test (HAM-Nat) [27]. The HAM-Nat in combination with hGPA is used for the selection of medical students in Hamburg, Germany. Applicants with hGPA above a certain level are invited to take the test. It consists of 80 MC-Items from biology, chemistry, physics and mathematics cover-ing the scope of high school teachcover-ing. The hGPA is used again in combination with HAM-Nat score, to establish the rank order for admission. School grades (hGPA) range from 1.0 (excellent) to 6.0 (insufficient) in Germany. In the year 2011, 207 out of 714 applicants
Fig. 4a-cScattergram of Y (study success) with X1(test results) and precision of the estimation ofryx1∣a(predictive validity) from different
(29%) were admitted by this procedure. As outcome cri-terion we consider study success as defined by perform-ance in 11 written exams in the first two study years, mainly from biochemistry, physiology, and anatomy, measured as the mean percentile.
Results
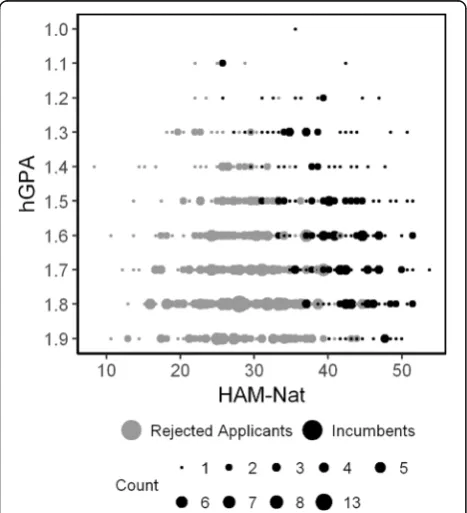
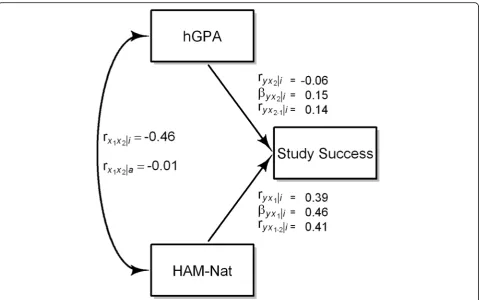
The compensatory relation between HAM-Nat and hGPA imposes a negative correlation between these pre-dictor variables in the incumbents (Fig. 5) by the same logic that has been demonstrated in the preceding simu-lation section (Fig. 1). An applicant with a low hGPA can still be accepted if her natural science knowledge test is superior.
We have withheld a complication in our empirical ex-ample to keep the description of correction methods as simple as possible. Actually there is a fourth variable which modifies the rank order in half of the accepted ap-plicants according to their performance in a test of so-cial competence [28]. This is not easy to model and we do not expect much change in the estimation of a cor-rected validity due to this complication. Therefore we bypass it for now. A validity coefficient is not a constant of nature that needs to be known with as many digits as possible. Considering the sizable error that is made by the widespread omission of appropriate corrections, a less than perfect estimation seems tolerable.
Being good at natural science, a student is well equipped to understand the subject matter of the first terms in med-ical school. But having on average a lower hGPA, which was compensated by her or his high science test score would mean that she or he lacks some of the abilities asso-ciated with a high hGPA, presumably abilities which help to negotiate an educational system, dubbed the“academic backbone”by McManus [29]. A less than strong academic backbone would counteract the auspicious prospect good natural science knowledge would bring about.
Due to reciprocal suppression the first order correlation of both variables with the outcome meas-ure is lower than the correlation of the residuals obtained when the linear effect of hGPA is taken out of the HAM-Nat scores and vice versa (Fig. 6). It rises from .39 to .41 for the HAM-Nat and from −.06 to .14 for hGPA.
The ratio of standard deviations for the unrestricted sample relative to the restricted sample is u¼SDx1∣a=
SDx1∣i¼0:67 for the HAM-Nat. Different methods of
correction for range restriction yield the values given in Table 2 for the predictive validity of the HAM-Nat. The estimations from Thorndike’s case C formula, EM and MICE and are close when used for the em-pirical data from the HAM-Nat (Table 2). Therefore we take the estimation of r^yx1∣a¼:59 as the best
esti-mation of the predictive validity of the HAM-Nat cor-rected for indirect range restriction. The effects of Table 1Mean of precision of the estimation of ryx1∣a(predictive validity) from different methods when 30%, 20%, and 10% of applicants are selected with RMSE and confidence interval
30% Selection 20% Selection 10% Selection
mean SD RMSE CI 95% mean SD RMSE CI 95% mean SD RMSE CI 95%
Thorndike’s case A −0.07 .05 .085 −0.16–0.02 −0.10 .07 .119 −0.23–0.02 −0.14 .10 .167 −0.34–0.04
Thorndike’s case C 0.00 .04 .043 −0.09–0.07 −0.01 .06 .065 −0.14–0.10 −0.02 .10 .102 −0.24–0.15
EM 0.00 .04 .039 −0.09–0.07 −0.01 .06 .058 −0.13–0.10 −0.02 .09 .092 −0.23–0.12
MICE −0.01 .04 .040 −0.09–0.07 −0.01 .06 .059 −0.14–0.09 −0.03 .09 .097 −0.24–0.12
Note.meanmean of the accuracy in the 1000 simulations,RMSERoot Mean Square Error,CIConfidence Interval
the two artifacts involved can be decomposed: Correcting for compensatory selection raises ^ryx1∣a
from .39 to .41, and correcting for range restriction raises^ryx1∣a further from .41 to .59.
Discussion
Approach from classical test theory
An alternative approach to correct for range restriction due to indirect selection is Hunter and Schmidt’s step-wise procedure based on classical test theory [30]. It re-quires information about the reliabilities of predictor and outcome measures. Different from most approaches not the empirical correlation between Y and X1 is
esti-mated, but the operational validity which is defined as
the theoretical correlation rρx1∣a between the true score
of Y, denoted as ρ, and X1. The empirical correlation
ryx1∣a, which according to classical test theory would be
ryx1∣a¼rρx1∣a=
ffiffiffiffiffiffiffiffiffiffiffi ðryy∣a p
Þ, cannot be recovered by this method, because the reliability of Y in the unrestricted sample,ryy∣a, is not known.
For the HAM-Nat data presented above the approach by Hunter and Schmidt yields an estimation of ^rρx1∣a ¼0:66
if the reliability of X1∣a= 0.8 and the reliability of Y∣i= 0.7.
Obviously the estimation of^rρx1∣a depends on the
reliabil-ity estimations for X1and Y, which in turn depend on the
method used, e.g. retest-reliability, split half reliability, or some coefficient of internal consistency such as Cronbach’s alpha or omega. As most methods for the estimation of re-liability suffer from drawbacks [31, 32] the resulting imper-fection is passed on to the estimation of r^ρx1∣a. This
method leaves us with the operational validity – a true score correlation.
True score correlation?
Should a correlation coefficient indicating predictive val-idity be corrected for attenuation by the unreliability of the test scores involved? Few researchers use such cor-rections, even when they otherwise adhere to classical
Fig. 6Relations between HAM-Nat, hGPA, and Study Success in the incumbents.ryx1: first order correlation,βyx1: beta coefficient,ryx1•
2:
semipartial correlation
Table 2Estimation results of the validity of the HAM-Nat by four different methods
Correction Method Validity of HAM-Nat
(^ryx1∣a)
Thorndike’s case A .56
Thorndike’s case C .59
Expectation maximization (EM) .60
test theory (CTT), but some advocate them, e.g. McMa-nus et al. reporting operational validity and construct-level predictive validity [3], which is expressed as the correlation of true scores of both, predictor and criter-ion. In a paper on measurement Schmidt and Hunter make a strong case for using correlations corrected for attenuation instead of empirical correlations because such measures are supposed to be better estimators of the relations commonly sought which would be relations between constructs, not just between test scores [33]. However this direct identification of the statistical ex-pectation of a test (the true score in CTT terminology) with a construct is strongly repudiated by critics like Borsboom and Mellenbergh [34–37]. Simply substituting the term“expectation”by“true score” does not turn the statistical expectation of a test score into a meaningful psychological concept.
The meaning of the true score for the HAM-Nat gets complicated after a little reflection. Why would scientific knowledge predict study success? Certainly because it is auspicious to enter the university with a good founda-tion for the curriculum of the first two years. But most probably other more basic third factors are in the game which act upon scientific knowledge as well as on study success, factors like motivation, conscientiousness, and intelligence. The knowledge test measures these factors silently by proxy because all of them are needed to achieve a high level of knowledge. If the knowledge measure would be stripped of such associations, how much would be left of its predictive power? Pure know-ledge independent of motivation, conscientiousness, and intelligence (which is hard to imagine), would merely consist of the stuff that had been learned devoid of its link to enduring personal dispositions. Knowledge is not an enduring trait such as intelligence, or conscientious-ness, it is acquired and, if not used, forgotten over the years. Its causal leverage is confined to the narrow range of the tasks to which it pertains, in this case the natural science content of the medical curriculum.
A successful test obscures its own validity
Applicants for medical school in Germany are usually well informed about the tests, which are in store for them. They prepare for the test if they judge their chances as sufficiently high, otherwise they neither sub-mit an application, nor spend time for preparation. If competition is strong, and it certainly is with a selection rate of almost 30% in Hamburg in 2011, then the level of preparation required to stand a chance rises and with it the effect of self selection into or out of the pool of applicants. Thus the mere presence of the test exerts a selective force even before the first multiple choice box is checked. This selective force also promotes a high level of ability in the accepted 30%, and if the ceiling of
the test is approached its variance is depleted. High level of ability and depletion of variance both work together to reduce whatever correlation might be found between the test and outcome variables reflecting study success. In the end all applicants are well equipped to live up to the natural science demands of the curriculum and no covariance with differential outcome in this respect is left. The success of the test will have erased the possibil-ity to demonstrate its effectiveness.
Conclusions
Empirical bivariate predictor/outcome correlations can-not be taken as measures of predictive validity if indirect selection and range restriction exist. Correction methods are available and should be used. For practical purposes Thorndike’s case C formula is a relatively straightforward solution to the range restriction problem, provided dis-tributional assumptions are met. With EM and MICE more precision is obtained when distributional require-ments are not met, but access to a sophisticated statis-tical package such as R is needed.
Can the results of our study regarding a compensatory selection decision be transferred to student selection scenarios that use multiple steps with a single criterion each? Imagine that applicants are shortlisted for a cogni-tive test based on their hGPA, but the following selec-tion decision is based only on their test score. The range restriction on the hGPA is difficult to estimate as we have to deal with a self-selection bias: applicants might not decide to apply if they think that they do not stand a chance. If solely a cognitive test would be used for the final selection decision (without the possibility to com-pensate a low test score by other means), a stronger range restriction on the test scores would occur. Then correction for compensatory selection would be unneces-sary, but correction for range restriction would have a larger effect. Therefore we think that this correction is even more important to determine the predictive valid-ity when an admission test is used as a single criterion.
Funding
This project was funded by the Federal Ministry of Education and Research in Germany (BMBF), funding code 01PL12033. The funder had no role in study design, data collection and analysis, decision to publish, or preparation of the manuscript.
Availability of data and materials
Data is available upon request to the corresponding author.
Authors’contributions
DK designed the study, interpreted the data, drafted and reviewed the manuscript; SZ analyzed the data, drafted and reviewed the manuscript; WH was involved with critically reviewing, revising and discussing the manuscript. All authors read and approved the final manuscript.
Ethics approval and consent to participate
that has been approved by the dean of the Hamburg medical faculty (statement of ethical considerations development of admission procedures at Hamburg Medical School). We obtained written informed consent from our participants.
Consent for publication
Not applicable
Competing interest
The authors declare that they have no competing interests.
Publisher’s Note
Springer Nature remains neutral with regard to jurisdictional claims in published maps and institutional affiliations.
Received: 22 February 2017 Accepted: 14 November 2017
References
1. Sackett PR, Yang H. Correction for range restriction: an expanded typology. J Appl Psych. 2000;85(1):112–8.
2. Venables WN, Ripley BD. Modern applied statistics with S: springer; 2002. 3. McManus I, Dewberry C, Nicholson S, Dowell JS, Woolf K, Potts HWW.
Construct-level predictive validity of educational attainment and intellectual aptitude tests in medical student selection: meta-regression of six UK longitudinal studies. BMC Med. 2013;11:243.
4. Friedman L, Wall M. Graphical views of suppression and multicollinearity in multiple linear regression. Am Stat. 2005;59(2):127–36.
5. Lutz JG A method for constructing data which illustrate three types of suppressor variables. Educ Psych Meas. 1983;43(2):373–77.
6. Conger AJ. A revised definition for suppressor variables: a guide to their identification and interpretation. Educ Psych Meas. 1974;34:35–46. 7. Cohen J, Cohen P, West SG, Aiken LS. Applied multiple regression/
correlation analysis for the behavioral sciences. Mahwah, New Jersey: LEA; 2003.
8. Velicer WF. Suppressor variables and the semipartial correlation coefficient. Educ Psych Meas. 1968;38:953–8.
9. Patterson F, Lievens F, Kerrin M, Munro N, Irish B. The predictive validity of selection for entry into postgraduate training in general practice: evidence from three longitudinal studies. Brit J. Gen Pract. 2013;11:734–41. 10. Burt C. Validating tests for personnel selection. Brit. Aust J Psychol.
1943;34(1):1–19.
11. MacKenzie RK, Cleland JA, Ayansina D, Nicholson S. Does the UKCAT predict performance on exit from medical school? A national cohort study? BMJ Open. 2016;6:1–10.
12. Gross AL, Fleischman L. Restriction of range corrections when both distribution and selection assumptions are violated. Appl Psych Meas. 1983;7(2):227–37.
13. Holmes DJ. The robustness of the usual correction for restriction in range due to explicit selection. Psychometrika. 1990;55(1):19–32.
14. (SIOP) Principles for the validation and use of personnel selection procedures. Bowling Green: SIOP; 2003. Available from: http://www.siop. org/_principles/principles.pdf .
15. Pfaffel A, Kollmayer M, Schober B, Spiel CA. Missing data approach to correct for direct and indirect range restrictions with a dichotomous criterion: a simulation study. PLoS One. 2016;11(3):1–21.
16. Pfaffel A, Schober B, Spiel CA. Comparison of three approaches to correct for direct and indirect range restrictions: a simulation study. Pract assess. Res Eval. 2016;21(6)
17. Wiberg M, Sundström A. A comparison of two approaches to correction of restriction of range in correlation analysis. Pract Assess Res Eval [Internet]. 2009 [Dec 7 2015]; 14(5). Available from: http://pareonline.net/getvn.asp?v=14&n=5. 18. Thorndike RL. Personnel selection: Test and measurement techniques. New
York: Wiley; 1949.
19. Gross AL. Relaxing the assumptions underlying corrections for restriction of range. Educ Psych Meas. 1982;42:795–801.
20. Held JD, Foley PP. Explanations for accuracy of the general multivariate formulas in correcting for range restriction. Appl Psych Meas. 1994;18(4): 355–67.
21. Schmidt FL, Oh I-S, Le H. Increasing the accuracy of corrections for range restriction: implications for selection procedure validities and other research results. Pers Psychol. 2006;59:281–305.
22. Thorndike RL. Applied psychometrics. Boston: Mifflin; 1982.
23. Dempster AP, Laird NM, Rubin DB. Maximum likelihood from incomplete data via the EM algorithm. J R Statis Soc Ser B (Method). 1977;39(1):1–38. 24. Enders CK. Applied missing data analysis. Little TD, editor. New York:
Guildford Press; 2010.
25. Fife D. Package selection: Correcting biased estimates under selection. Available from: https://cran.r-project.org/web/packages/selection/selection.pdf. 26. van Buuren S, Groothuis-Oudshoorn K. Mice: Multivariate imputation by
chained equations in R. J Stat Softw. 2011;45(3)
27. Hissbach JC, Klusmann D, Hampe W. Dimensionality and predictive validity of the HAM-Nat, a test of natural sciences for medical school admission. BMC Med Educ. 2011;11:83.
28. Hissbach JC, Sehner S, Harendza S, Hampe W. Cutting costs of multiple mini-interviews–changes in reliability and efficiency of the Hamburg medical school admission test between two applications. BMC Med Educ. 2014;14
29. McManus IC, Woolf K, Dacre J, Paice E, Dewberry C. The academic backbone: longitudinal continuities in educational achievement from secondary school and medical school to MRCP(UK) and the specialist register in UK medical students and doctors. BMC Med. 2013;11:242. 30. Hunter JE, Schmidt FL, Le H. Implications of direct and indirect range restriction
for meta-analysis methods and findings. J Appl Psych. 2006;91(3):594–612. 31. Schmitt N. Uses and abuses of coefficient alpha. Psychol Assessment.
1996;8(4):350–3.
32. Sijtsma K. On the use, the misuse, and the very limited usefulness of Cronbach's alpha. Psychometrika. 2009;74(1):107–20.
33. Schmidt FL, Hunter JE. Theory testing and measurement error. Intelligence. 1999;27(3):183–98.
34. Borsboom D. The attack of the psychometricians. Psychometrika. 2006;71(3):425–40.
35. Borsboom D, Mellenbergh GJ. True scores, latent variables, and constructs: a comment on Schmidt and hunter. Intelligence. 2002;30:505–14.
36. Klein DF, Cleary TA. Platonic true scores and error in psychiatric rating scales. Psych Bull. 1967;68(2):77–80.
37. Muir DEA. Critique of classical test theory. Psychol Rep. 1977;40:383–6.
• We accept pre-submission inquiries
• Our selector tool helps you to find the most relevant journal
• We provide round the clock customer support
• Convenient online submission
• Thorough peer review
• Inclusion in PubMed and all major indexing services
• Maximum visibility for your research
Submit your manuscript at www.biomedcentral.com/submit