R E S E A R C H
Open Access
A network-based approach to classify the three
domains of life
Laurin AJ Mueller
1, Karl G Kugler
1, Michael Netzer
2, Armin Graber
1and Matthias Dehmer
1*Abstract
Background:Identifying group-specific characteristics in metabolic networks can provide better insight into evolutionary developments. Here, we present an approach to classify the three domains of life using topological information about the underlying metabolic networks. These networks have been shown to share domain-independent structural similarities, which pose a special challenge for our endeavour. We quantify specific structural information by using topological network descriptors to classify this set of metabolic networks. Such measures quantify the structural complexity of the underlying networks. In this study, we use such measures to capture domain-specific structural features of the metabolic networks to classify the data set. So far, it has been a challenging undertaking to examine what kind of structural complexity such measures do detect. In this paper, we apply two groups of topological network descriptors to metabolic networks and evaluate their classification performance. Moreover, we combine the two groups to perform a feature selection to estimate the structural features with the highest classification ability in order to optimize the classification performance.
Results:By combining the two groups, we can identify seven topological network descriptors that show a group-specific characteristic by ANOVA. A multivariate analysis using feature selection and supervised machine learning leads to a reasonable classification performance with a weightedF-score of 83.7% and an accuracy of 83.9%. We further demonstrate that our approach outperforms alternative methods. Also, our results reveal that entropy-based descriptors show the highest classification ability for this set of networks.
Conclusions:Our results show that these particular topological network descriptors are able to capture domain-specific structural characteristics for classifying metabolic networks between the three domains of life.
Background
The interlinkage of enzymes into metabolic reactions allows catabolic and anabolic processes to provide organisms with energy and the building blocks of cell functions [1]. These interactions can be represented as metabolic networks [2]. The analysis of such networks gives insight into the functions of various processes, and is essential for understanding basic biological questions [3]. Typical analyses comprise studying vertex degrees or the paths between vertices. For instance, Jeong et al. demonstrated that despite their evolutionary distances, the domains of life share significant similarities in the topology of their metabolic networks [2]. They pointed
out that a set of 43 organisms, representing the three domains of life (Archaea, Bacteria, Eukaryote), appeared to be scale-free and follow a power law distribution [2]. Additionally, they found network diameters to be rela-tively constant despite network size.
By performing a large-scale structural analysis of meta-bolic networks, it has been reported that hierarchical clus-ters of topological modules overlap with known metabolic functions [4]. In recent work, Ebenhöh and Handorf pro-posed strategies to characterize organisms with respect to their underlying metabolic networks. They introduced a measure for calculating the distance between organisms based on the carbon utilization spectra and the nutrient profiles of the metabolic networks [5]. To classify path-ways through metabolic networks, Hancock and Mamit-suka use a Markov mixture model [6]. This model identifies pathways in metabolic networks in order to build a classifier. Zhu and Qin used basic network
* Correspondence: [email protected]
1Institute for Bioinformatics and Translational Research, Department of Biomedical Sciences and Engineering, University for Health Sciences, Medical Informatics and Technology (UMIT), Austria
Full list of author information is available at the end of the article
measures (e.g. clustering coefficient and average between-ness) and network motifs for a structural comparison of 11 metabolic networks [7]. The approach introduced in the present paper determines structural features by utiliz-ing topological network descriptors, in order to classify metabolic networks of 43 organisms.
To analyse networks structurally, various topological network descriptors have been developed [8]. Such descriptors capture different structural features of net-works and have proved to be useful in characterizing molecular networks [8-10]. In particular, it has been demonstrated that information-theoretic measures [8], interpreted as the entropy of the underlying graph topology, capture significant structural information [10-13]. Additionally, Dehmer et al. developed novel descriptors to analyse biological networks [14]. Hence, we hypothesize that these measures can be successfully applied to to capture topological properties of metabolic networks for classifying them with a reasonable classifi-cation performance. To calculate the topological
net-work descriptors we used the R-packageQuACN[15].
In general, graph classification is a challenging pro-blem and has been tackled by using different methods [16-18] from exact and inexact graph matching [16,17]. Goh et al. use the betweenness centrality to classify dif-ferent types of scale-free networks into two classes [19]. In more biologically motivated related work performed by Li et al. [20], graph kernels for machine learning were used to predict gene functions. Chuang et al. [21]
used subnetworks to train a classifier for the detection of breast cancer metastasis.
The major contribution of the present paper, as illu-strated in Figure 1, is the study of topological network descriptors and the evaluation of their performance when classifying the domains of life as presented in the data by Jeong et al. [2]. Therefore, we use different groups of topological network measures as input for supervised machine learning techniques in order to comprehensively capture topological network properties for classification. To our best knowledge, such an approach has not yet been employed on metabolic networks.
We introduce this approach for several reasons. Note that exact graph matching such as the Zelinka distance [22,23] is not applicable to calculate the distance between the networks. The size of the networks makes it unfeasible for us to pursue this endeavour, as the complexity of calcu-lating the Zelinka distance between two networks is NP-complete [24]. Moreover, we would have to compare the networks with each other, leading ton(n2−1)comparisons.
Therefore, we apply a network-descriptor based approach. The calculation of the descriptors requires polynomial time complexity. However, a single network descriptor might be insufficient for capturing the topol-ogy of a complex network. For this reason, our approach is based on the combination of different topological net-work descriptors, which are prioritized and selected using feature selection. Clearly, this information can be used for performing the classification.
This paper is structured as follows: Material and Methods provide an overview of the applied methods.
The results of our study are explained in the Results
section, followed by a summary and the discussion of
the results. The section Conclusions and Outlook
con-cludes the study and outlines future work.
Materials and methods
As hypothesis, we claim to have achieved a reasonable classification of the three domains of life by using only structural features of their underlying metabolic works. Therefore, we make use of 43 metabolic net-works introduced by Jeong et al. [2]. They point out that these networks show basic, domain-independent structural similarities. This makes distinguishing between the three domains of life a challenging task. To tackle this problem, our aim is to find complex topolo-gical features that allow detecting domain-specific similarities.
Therefore, we calculate two groups of topological descriptors for each network and estimate their ability to discriminate between the three domains of life. Moreover, we combine the two groups to a set of 33 features, which we later use for ANOVA testing. We compare the classifi-cation performance of the two groups with all combined descriptors using feature selection and supervised machine learning. Finally, we compare this approach with an alter-native statistical degree-based method.
Data
For our analysis we use the metabolic network data of Jeong et al. [2], where the information on the underlying biochemical reactions is based on the WIT database [25]. The original data set comprises 43 organisms represented as directed networks. The vertices in these networks represent substrates that are connected by metabolic reactions. The 43 organisms can be divided into three classes, which represent the domains of life
Archae (nA = 6), Bacterium (nB = 32), and Eukaryote
(nE = 5). Note that this data set is highly imbalanced
(skewed class distribution). As the implementation of
QuACN[15] is only capable of handling undirected net-works, we transform the original data into undirected networks. After constructing these networks, the largest connected component is extracted for our analysis, as connected graphs are required by most of the network measures utilized.
Topological Network Descriptors
In order to perform a feasible classification, we exploit sophisticated network descriptors to capture domain-specific topological complexity in a meaningful way [8,26]. In particular, we use topological network descrip-tors to quantify domain-specific topological properties.
Each descriptor calculates a numerical value that quanti-fies specific topological characteristics of the underlying network.
The interpretation of the structural properties and complexity of the applied measures in detail, is a chal-lenging and still ongoing task [27].
The recently developed R package QuACNcontains
four different groups of topological network descriptors to analyse complex biological networks [15]:
1.Descriptors based on distances in a graph: This class contains measures [9] based on distances between nodes.
2.Descriptors based on other graph invariants:The descriptors in this class use graph invariants other than distances, e.g., degree, number of nodes, num-ber of edges, etc.
3.Partition-based graph entropy descriptors:These measures use an arbitrary graph invariant and an equivalence criteria to induce partitions. A probabil-ity value is calculated for each partition to determine the entropy based on Shannon’s entropy [28]. 4.Parametric graph entropy measures called Deh-mer-entropy:To determine the entropy, measures of this class [8,10], assign a probability value to each vertex of a graph, using so-called information func-tionals (IFs).
A detailed description of the employed descriptors would go beyond the scope of this manuscript. For a better understanding of the descriptors used, see the
vignette ofQuACN or the corresponding literature. For
example, Todeschini et al. [29] lists a large selection of topological network descriptors and Dehmer and Mow-showitz discuss entropy-based descriptors in detail [8].
We useQuACN as it is, as far as we know, the only
available software package that contains sophisticated measures such as the parametric graph entropy mea-sures (Dehmer entropy). Calculating the 33 descriptors
that are implemented inQuACN version 1.0 results in a
data matrix containing 43 samples (metabolic networks) and 33 features (topological descriptors).
This matrix is used for further analysis. To estimate the classification ability of different groups of topological network descriptors, we combine groups 1 and 2 into a
group of non entropy-based descriptors (NEBD). The
other group,entropy-baseddescriptors (EBD), is formed
by merging groups 3 and 4. Based on previous observa-tions, we expect EBD to perform better on classifying this set of networks.
Univariate Analysis
ANOVA [30] tests on each of the 33 descriptors. We correct for multiple hypothesis testing by calculating the
q-values (adjustedp-values) using the false discovery rate (FDR) [31]. We used the statistical programming language R [32] for this analysis.
Feature Selection
Feature selection is an essential step before building pre-dictive models from biomedical data [33]. Feature selec-tion methods can be classified into filters, wrappers, and embedded methods [34]. Wrappers employ learning algorithms to evaluate the discriminatory ability of fea-ture subsets using heuristic approaches to search the space of possible feature subsets. In general, feature sub-sets selected by wrappers are highly discriminative, but wrappers have high computational costs. On the con-trary, the search for an optimal subset of features is built into the classifier of embedded methods: thus they are less computationally intensive than wrappers [34]. Filter methods select features based on their ability to discriminate two or more predefined classes. Filters are independent of a learning algorithm, efficient, and per-mit of prioritizing features, which is particularly impor-tant for biological interpretation purposes [35].
In our experimental setup we use three filter methods, which are again one way ANOVA, Information Gain (IG) [36], and ReliefF (RF) [37]. The IG feature selection method is based on an entropy measure [36]. RF is a multivariate correlation-based feature selection method
that compares feature values of the knearest instances
for the same and the other classes [37].
Leave-One-Out Cross-Validation (LOOCV) is applied to validate the feature rankings by subdividing the
data-set into m (m = the number of instances) partitions.
The feature selection process is then repeated mtimes,
usingm- 1 partitions for generating the feature ranking.
In our particular case, m= 43. Finally,m rankings for
each partitioning are calculated, and the mean ± sd
(standard deviation) score of the selected feature subset is calculated [35].
Supervised Machine Learning
In our experimental setup we use three important classi-fiers, which are thek-nearest neighbour (k-nn), Naive Bayes, and logistic regression.k-nn is an instance-based learner, assigning a new instance to the majority class of theknearest neighbours of the training set [38]. Naive Bayes is a probabilistic classifier based on Bayes’rule of conditional probability assuming class independence [39]. Logistic Regression Analysis [40] calculates the posterior probabilities of the classes using linear functions. A logit transformation ensures that the predicted probabilities range between 0 and 1. A general and simple way to address multiclass problems in logistic regression is known as pairwise classification, where a classifier is built for each pair of classes [38]. To estimate the performance and reduce the selection bias of the classifiers, we use external Leave-One-Out Cross-Validation (LOOCV) [41,42]. There-fore, we perform the classification by splitting the data into a test and a training set. For the feature selection and the training of the classifier we are using the training set only. Then, we use the test set to estimate the performance of the classifier, considering the selected features and the set-tings learned during the training phase. This procedure is repeatedm- 1 times (m= 43). The Weka data mining soft-ware [43] has been used for classification.
Results
In the following we describe the results and also com-pare our method to non descriptor-based alternative approaches.
Univariate Analysis
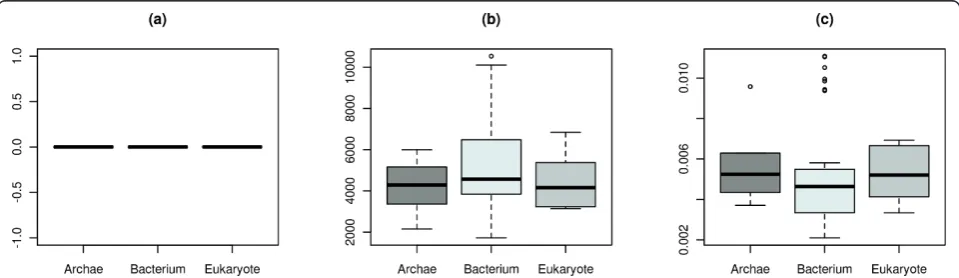
The three descriptors that show the least group-specific effect in terms of an analysis of variance (ANOVA) are shown in Figure 2. In our particular case, it relates to
the edge density [44], the average distance [45], and the global clustering coefficient [46]. These measures cap-ture basic topological properties. This is in accordance with the findings of Jeong et al.
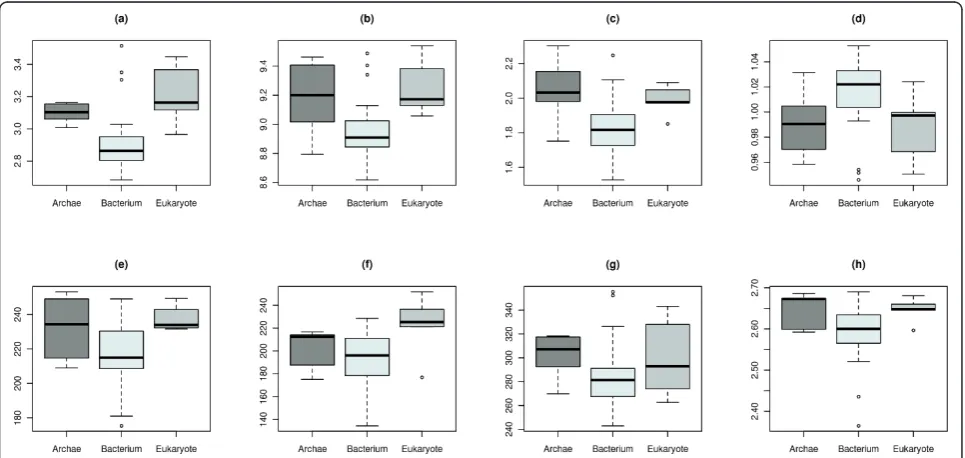
ANOVA also identifies seven topological network descriptors that show a group-specific effect in at least one domain (q-value<0.1) as listed with their respective significance levels in Table 1. The choice of q <0.05 would have reduced the number of significant descrip-tors to two. We chose a higher significance level to motivate and stimulate discussion of this network based analysis approach.
This shows that five of the seven descriptors are from EBD. This strengthens our hypothesis that
entropy-based descriptors perform better at classifying biological networks [12]. The values of these significant descriptors are illustrated as boxplots in Figure 3. One can see that one single descriptor is insufficient for discriminating between all three domains of life. To overcome this shortcoming we employ a multivariate approach as described in the Methods section.
Feature Selection
Table 2 depicts the five top-ranked features according to mean score and standard deviation (sd) for the feature ranking methods ANOVA, IG, and RF. Lower ranked features are not shown as the IG converges to zero. LOOCV was applied to validate the feature ranking scores. The common set of selected features comprises
the Bonchev-TrinajstićindexID[47], and the
Compact-nessC[48]. Their boxplots are shown in Figure 3.
Supervised Machine Learning
Performing a classification using the five best features for each of the two groups (EBD and NEBD) leads to a reasonable performance. The best results are achieved with the logistic regression. NEBD achieved a lower
classification performance with a weighted F-score
(WFS) of 74.1% and an accuracy (ACC) of 79.1% versus EBD with a WFS of 70.5% and an ACC of 72.1%.
Combining all the descriptors of the two groups,k-nn and logistic regression both gave the highest accuracy andF-Score using RF for feature selection. However, in Table 1 Top ranked features by ANOVA
Topological Network Descriptor q-values BERTZ complexity index (C) 0.013428 Radial centric info index (IC,R) 0.024471
BalabanJindex (J) 0.059016
Dehmer-Entropy usingj-spheres
IfV
exp
0.059016
Dehmer-Entropy using path lengths
IλfP
exp
0.059016
Dehmer-Entropy using vertex centrality
Iλ
IC lin
0.065820
Vertex degree equality-based information index (Ideg) 0.065820
This table shows the topological network descriptors that show a group-specific effect in at least one domain (q-value<0.1), identified by ANOVA. A description of of the different descriptors (features) can be found in the additional file.
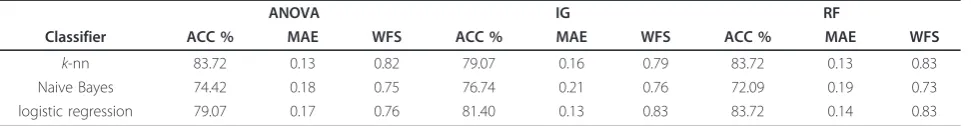
contrast to k-nn, logistic regression is model-based, where the training data is compiled into a concise model that can be further interpreted [38,49]. Therefore, we focused on the results of the logistic regression. It achieved a WFS of 83.7% and an ACC of 83.9% as shown in Table 3. The corresponding confusion matrix is depicted in Table 4. It shows that the classification of the three domains of life using topological graph mea-sures leads to a reasonable classification performance.
In order to verify the discrimination ability of the clas-sifier we compared its performance with the one derived from a data set where the class labels for the samples were randomly permuted. The average performance of this classifier leads to an WFS of 58.5% and an ACC of 58.5%. These results show that the performance reduces substantially compared to the original classifier for pre-dicting the three domains of life.
Comparison with Non Descriptor-Based Methods
To assess the classification ability of our approach we also compare it to non descriptor-based methods. As previously mentioned, we could not apply the general-ized Zelinka distance using subgraph isomorphism [22,23] because of its infeasible computational complex-ity and the size of our networks. Therefore, we employ an information-theoretic approach using the degree dis-tribution of each network and the Kullback-Leibler divergence [50]. Subsequently, we perform a supervised machine learning approach as described above. Using
the Kullback-Leibler divergence we find no relevant fea-tures having a mean information gain>0.01. The best classification performance without feature selection is obtained using logistic regression (ACC = 53.48%, MAE = 0.31, WFS = 0.54).
To visualize the difference between the descriptor-based method and the approach using the Kullback-Lei-bler divergence, we plot the feature space spanned by the two best features as reported by ANOVA. Figure 4 (a) shows the descriptor-based approach where it is pos-sible to identify three clusters. In Figure 4(b) the data presents itself as one single cluster.
Discussion
The goal of our work was to discriminate between the three domains of life Archae, Bacterium, and Eukaryote, based on a set of 43 metabolic networks. Therefore, we utilized topological network descriptors. This was a non-trivial task because we had to identify descriptors that are able to capture domain-specific topological net-work characteristics meaningfully. We first employed a univariate approach to test the topological network descriptors for a domain-specific effect. In a second step we applied feature selection and supervised machine learning techniques.
The corresponding results indicated that despite the topological similarities shown in Jeong et al. [2], we were able to specify differences between the three domains of life. This demonstrates that the measures used can capture significant structural information.
SinceQuACN can only process undirected networks, we
disregarded the information on the direction of the edges. However, we showed that the topology of the metabolic networks still contains enough information Table 2 Top ranked features
Feature ranking method
Rank Anova
(mean ± sd)
IG (mean ± sd)
RF (mean ± sd)
1 ID(8.78 ±1.27) ID(0.44 ± 0.05) ID(0.18 ± 0.01) 2 C(7.29 ± 0.82) C(0.08 ± 0.14) C(0.14 ± 0.01) 3 IC,R(5.96 ± 0.68) IC,R(0.05 ± 0.12) J(0.11 ± 0.01)
4 J(4.12 ± 0.58) IλfP
e xp(0.02 ± 0.08) If V
lin(0.11 ± 0.01)
5 IλfP
exp(4.04 ± 0.65) I λ
IC
lin(0.01 ± 0.04) IfV
exp(0.105 ± 0.01)
This table shows the five top ranked features using different feature selection methods. A description of the different descriptors (features) can be found in the additional file.
Table 3 Performance measures of different classifiers
ANOVA IG RF
Classifier ACC % MAE WFS ACC % MAE WFS ACC % MAE WFS
k-nn 83.72 0.13 0.82 79.07 0.16 0.79 83.72 0.13 0.83
Naive Bayes 74.42 0.18 0.75 76.74 0.21 0.76 72.09 0.19 0.73
logistic regression 79.07 0.17 0.76 81.40 0.13 0.83 83.72 0.14 0.83
This table shows the Accuracy (ACC), mean absolute error (MAE), and weighted averageF-score (WFS) fork-nn, Naive Bayes, and logistic regression, using leave one out cross-validation.
Table 4 Confusion matrix fork-nn and IG
True class Archaea classified as Bacteria Eukaryotes
Archaea 2 4 0
Bacteria 3 29 1
Eukaryotes 0 0 5
This table shows the confusion matrix for the features selected by IG and the
for discrimination between the three domains of life. These findings indicate that despite some existing topo-logical similarities, the domains of life might have devel-oped specific topological properties in their related metabolic networks. Based on these conclusions it might be worthwhile to investigate whether such specific struc-tures and topological properties can also be found on other taxon levels.
The basic topological descriptors (global clustering coefficient, edge density, and average distance) showed no sufficient classification ability for this set of network data, when applying ANOVA. Thus, we employed two groups of more sophisticated descriptors (entropy-based and non entropy-based). We could demonstrate that dif-ferent groups of topological network descriptors per-form differently on this set of networks. The group of non entropy-based descriptors achieved the lowest results. This demonstrates that the non entropy-based descriptors have a lower classification ability than the entropy-based ones, for this set of metabolic networks.
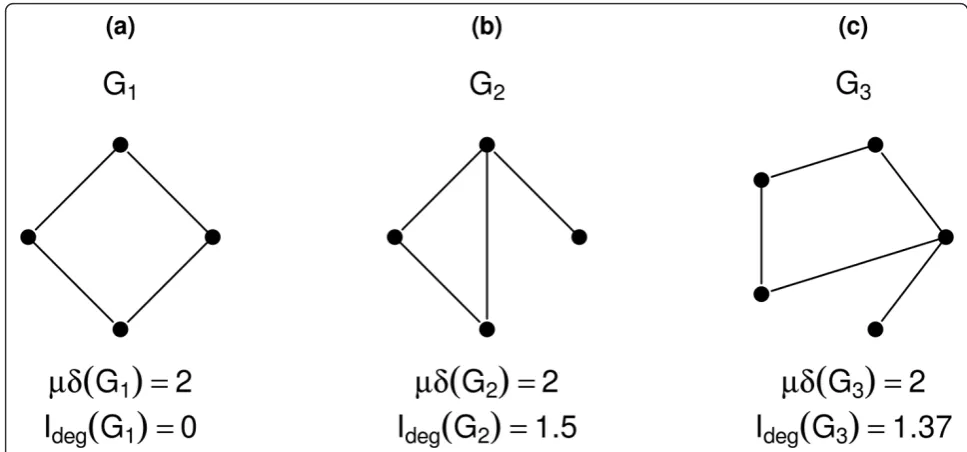
This can be explained by the fact that entropy-based descriptors are often more sensitive in capturing struc-tural differences than are classical network descriptors [8,47]. Consider the following simple example as illu-strated in Figure 5. It shows three small, structurally dif-ferent networks. However, the mean of the degree of these three networks produces the same result for each network, i.e., μδ(G1) =μδ(G2) =μδ(G3) = 2. However,
comparing this to the entropy of the degree distribution [9] given by
Ideg=− k
i=1 |δi|
|δ|log |δi|
|δ|, (1)
where |δi| denotes the number of vertices with the
same degree and kdenotes the maximum degree, this
results in different values for each network (Ideg(G1) = 0,
Ideg(G2) = 1.5, Ideg(G3) = 1.37). This small example
demonstrates that slight changes of the network topol-ogy cannot be detected by the mean degree. On the other hand, the degree distribution is different for each network, and so is the entropy. Moreover, this demon-strates that this particular entropy-based measure is more sensitive to small changes in the topology of a net-work. But this does not mean that entropy-based mea-sures do not have any degeneracy [8,27]. Generally, a measure is called degenerated if there exist two non-iso-morphic graphs possessing the same value, see [51]. Note that the problem of evaluating the degree of degeneracy has been studied in, e.g., [8,27]. In particular, Dehmer et al. demonstrated that parametric entropy measures possess higher uniqueness than partition based descriptors [27]. Also, Konstantinova demon-strated that information indices based on distances show a high discrimination ability [52].
Figure 4The feature space for the distance-based approach. To compare the two approaches, we visualize the feature space of the two top-ranked features by ANOVA. (a) represents feature space of the descriptor-based approach whereFdesc
i=1,2. (b) represents feature space of the non distance-based approach whereFdeg
i=1,2..
With respect to our results, this indicates that the infor-mation content, as captured by entropy-based measures, often allows a more meaningful discrimination than using other graph invariants. This fact finally leads to a better classification performance. This hypothesis was supported using one way ANOVA where we were able to identify seven descriptors having a significant group effect, and five of them (71.4%) were entropy-based. Additionally, com-bining the two groups and performing a feature selection showed that four of the five selected features were entropy-based. This feature selection showed that already five features were sufficient for identifying the three domains of life from the present data.
Moreover, in recent work we have demonstrated that it is necessary to combine descriptors from different groups in order to exploit their ability to capture differ-ent structural network features in order to increase their classification performance [53]. This demonstrates that combining different structural features can increase the ability to discriminate between different classes of net-works. However, it is challenging to identify the struc-tural features and the set of topological network descriptors that can capture these features.
Due to the imbalanced class distributions, a high over-all classification performance is achieved. Consider a
two class problem with classes A (nA = 10 instances)
and B (nB= 90 instances). A naive classifier that labels all classes as B (majority class) will achieve an accuracy of about 90%. In our case, a classifier that would always classify a network as Bacteria would achieve an WFS of 63.5% and an ACC of 74.4%. In the context of this
observation, we achieved a fairly respectable result for this imbalanced data set.
Moreover, we randomized data to show whether we capture something essential or simply overfit the data. Therefore, we permuted the class labels randomly and applied the same algorithm on the data. This led to a WFS of 58.5% and an ACC of 58.5%. These results show that the performance decreases substantially by randomizing the class labels and indicates that we cap-ture essential structural information of the underlying metabolic networks.
Comparing our method with alternative approaches showed two major findings. Methods using subgraph isomorphism such as the generalized Zelinka distance [23] could not be computed for such large networks, because of their high computational costs. Moreover,
when one hasnnetworks, all networks have to be
com-pared with each other, leading ton(n2−1)computationally intensive comparisons. By using our approach, it is not necessary to compare all networks with each other, as a set of topological descriptors is calculated once for each single network. Note that with an approach based on the Kullback-Leibler divergence using the degree distri-bution, only one descriptor has to be calculated. Although this is important, this approach fails to pro-duce meaningful classification results.
Our results demonstrate that it is possible to classify networks into three different domains of life, using only the topological characteristics of their underlying meta-bolic networks. Note that this method can be easily adapted to other types of biological networks.
Conclusions and Outlook
By transforming the data into undirected networks, part of the information gets lost. As the implementation of
QuACNis only capable of handling undirected networks, this package will have to be adapted in future work.
The results of the classification achieved in this study have motivated us to perform a study with an extended number of networks in each domain of life. To obtain a more equally distributed set of networks among the three domains of life, we plan to integrate different data-bases to increase the number of networks for each domain. To deal with this problem, we will also investi-gate other groups of topological network descriptors.
To obtain a better biological interpretation of the results, we plan to analyse the topology of every single metabolic network in detail. Based on the present findings it might be possible to derive species-specific topological informa-tion that can be used to track evoluinforma-tionary events and modifications. So far, there does not exist a study that investigates which biological characteristics are captured by topological network descriptors, but we plan to per-form one in future work. This will help us to identify important metabolites for the biological interpretation of the data.
The starting hypothesis of this work was that applying complex network measures is a feasible way to classify between metabolic networks that represent the three domains of life. We verified this hypothesis by finding a set of measures that allows a sufficient classification. These results demonstrate the power of such complex network measures and their potential to tackle challen-ging questions in network biology [8].
Reviewers’comments
Reviewer’s report 1
Arcady Mushegian, Stowers Institute for Medical Research, Kansas City, Missouri, United States of America
In this manuscript, “metabolic networks”are studied, i. e., the graphs abstracted from tentative reconstructions of metabolic pathways in 43 species from the three domains of Life. The pathways and their graph repre-sentation were the same as used by Jeong et al. [1], and they go back to the WIT resource, produced by R. Overbeek in the 1990s. The authors of the current manuscript computed a large variety of topological descriptors of complex networks, many of which have been proposed only recently (some by the authors them-selves), and applied various statistical machine learning techniques to find the descriptors or their combinations that best separate three domains of Life, i.e., Bacteria, Archaea and Eukarya. The main conclusion of the study
can be found on p. 9: “These findings indicate that
despite some existing topological similarities, the
domains of life might have developed specific topologi-cal properties in their related metabolic networks. Based on these assumptions it might be worthwhile to investi-gate whether such specific structures and topological properties can also be found on other taxon levels.”
I am not an expert in machine learning methods and trust the others the evaluate the methodology. (But see one technical remark at the end). In this review, I would like to focus on the biological sensibilities of the journal and its audience, and to invite the authors to explain better what is the goal of the whole exercise is. Their motivation is mentioned several times, but the state-ments of the problem are confusing. For example, on p.
2 we read: “The approach introduced in this paper
determines structural features by utilizing topological network descriptors, in order to classify metabolic net-works of 43 organisms”, and yet the title says that the project attempted to classify the three domains of Life -these are not the same, which one was it?
If we go with the title, we find that the authors’
understanding of classification and the one used by many biologist may not be the same. The authors seem to be more concerned in using their quantitative approach to achieve good separation of the objects with the known labels, whereas a biologist sees a classifica-tion as the knowledge base about relaclassifica-tionships between organisms, and looks for a better way to classify a newly sequenced organism. The classifiers proposed here do not seem to be immediately useful for either purpose. Moreover, the“metabolic network”that the authors use is itself a result of many steps of computational analysis, starting from gene recognition, going on to similarity detection and metabolic reconstruction. Using this highly derived metabolic map to answer a basic question of whether this organism is from Bacterial, Archaeal or Eukaryal domain seems contrived: molecular properties of protein and RNA genes would have allowed one to assign the organism quite unequivocally at a much ear-lier step of the analysis, horizontal gene transfer not-withstanding in this case.
But perhaps this study should be taken on its own merits, to show that even a partial, incomplete as it was in the late 1990s, information about metabolic pathways in three domains of Life, was sufficient to detect infor-mative topological differences between the networks in different domains. How interesting this observation might be? In my opinion, it depends on the nature of
the signal that is detected by the authors’ approach.
biochemistry in Archaea which were known and exam-ined prior to 1990s? Or could it be that not enough of Archaeal diversity (or, for that matter, the diversity of all three domains of Life) was sampled in 2000?
If, on the other hand, the sophisticated measures that the authors use do indeed capture some not-biologi-cally-intuitive property of a metabolic network that is specific to, say, bacteria, such as different patterns of local connectivity, or different patterns of centrality, etc., this would be worth knowing -though, in this case again, one wonders how all this would hold up with many more genomes and their (putative) metabolic net-works available now than was known in 2000.
Author’s response
The reviewer addresses a very important issue. There is often a terminological misunderstanding between experts from different areas. We want to make clear that we understand the term classification in a methodi-cal way. More precisely, the term classification is based
on usingsupervised machine learning and the goal is to
use training data to predict future class membership of a sample or certain characteristics of the whole data set [54]. In our case, this means that we use the values of the different topological network descriptors of the underlying metabolic network of an organism to predict which domain of life the organism belongs to.
In this study, we want to investigate whether it is pos-sible to capture domain-specific topological similarities by using different groups of topological network descrip-tors. We want to emphasize that we are mainly inter-ested in the methodical aspect. Therefore, we showed that the methods are able to detect topological proper-ties which predict domain membership with a reason-able classification performance. We agree with the reviewer that it would be quite unequivocal to assign the organism at a much earlier step of the analysis. But, note that the presented approach is based on informa-tion intrinsic in metabolic networks that is captured by domain-specific topological properties.
We fully agree with the reviewer that it would be worth knowing what biological or non-biological prop-erties are captured by these sophisticated measures and if the presented domain-specific topological properties can be generalized for many more genomes. As
explained in the section Conclusion and Outlook, the
results of this study motivate us to perform a large scale study with more recent metabolic networks.
Reviewer’s report 2
Carlo Vittorio Cannistraci, Integrative Systems Biology Lab, King Abdullah University of Science and Technology, Saudi Arabia
SynopsisMuller et al. propose a network-based approach for classification of the three domains of life (Archaea,
Bacteria, Eukaryota). The dataset is composed of 43 metabolic networks (6 Archaea, 32 Bacteria, five Eukar-yota). Each network is codified by 33 features which are topological network descriptors able to capture domain-specific complexity in a meaningful way. They claim to demonstrate with ANOVA that 8/33 topological network descriptors are group-specific and, in particular, the entropy-based descriptors (6/8) are the most effective. In the second phase of the study they perform feature selec-tion and classificaselec-tion (leave-one-out cross-validaselec-tion is applied). They claim to attain high level of classification
(accuracy >80%) confirming the superiority of the
entropy-based descriptors (4/5 selected features). In addi-tion, poor classification using non descriptor-based net-work codification is demonstrated.
General review The main idea of the article is very ele-gant and the investigation of the topological descriptors to capture complex network properties is intriguing as much as is the comparison between the entropy-based descriptors (related to information theory concepts) and the classical descriptors (related to measures of distances between nodes, node degree, etc). However, I believe that this study presents some serious methodological issues and that the results are misleading due to a fundamental error in designing the classification task. The conse-quence is that - in my opinion - the authors cannot claim to have classified the three domains of life, as they report in the title and in the rest of the article.
Major comments 1) The first and most relevant issue is the design of the classification task. In fact, it consists only of a training phase while the test phase is completely absent. This is a serious and fundamental issue as explained in Smialowski P. et al (Pitfalls of supervised feature selection - Bioinformatics 2009). A correct study should use a first partition of the original data as training set, which should be employed to perform the feature selection and to learn the classifiers’settings. The second partition of the original data should be used as test set to estimate the performance of the classifiers considering the selected features and the settings learned during the training phase. The classification result on the test set
-evaluated by weightedFscore (WFS) and accuracy
selected features (second evaluation). The result of these comparisons should be used to claim a certain level of discrimination by unsupervised classification, and to investigate the difference in performance between the selected features and the original ones. The reason why one should apply different clustering algorithms and con-sider the best performance is to guarantee that the final evaluation is not penalized by the bad performance of a particular approach. Clustering approaches able to work both for spherical clusters (such ask-means; and Affinity propagation, Frey et al. Science 2007) and for irregular/ elongated/non-spherical clusters (such as Minimum cur-vilinear Affinity propagation, Cannistraci et al. Bioinfor-matics 2010; and soft-constraint affinity propagation, Leone et al. Bioinformatics 2007) should be considered.
2) Multiple testing correction is applied and a q-value < 0.1 is used as threshold for significance to determine the descriptors with a group-specific effect in ANOVA: this identifies seven significant descriptors. In general, a common choice for significance is a q-value < 0.05 which would reduce the number of significant descrip-tors to 2. The authors do not motivate the choice of a q-value threshold so unexpectedly high (q-value < 0.1).
Minor comments 1) The name of the 33 topological descriptors should be indicated in the Methods section, considering each of the 4 types.
2) Methods section, feature selection paragraph: the authors state that feature selection methods can be clas-sified into filters and wrappers. This is incorrect. Feature selection methods can be subdivided into at least three types: filter, wrapper and embedded (Yvan Saeys et al., A review of feature selection techniques in bioinfor-matics - Bioinforbioinfor-matics 2007).
3) In the paragraph “comparison to
non-descriptor-based methods": it is not clear how many features were generated. Moreover, it is not clear what features are used to obtain Figure 4B.
Author’s response
Answer to Major comments 1: The classification task includes leave-one-out cross-validation (CV) usingm- 1 (m= the number of samples) partitions for training and the remaining part for testing the classifier. The whole
procedure was repeatedm times, and we calculated the
meanF-score, absolute error, and accuracy. In our parti-cular casem= 43.
We also validated the feature selection using leave-one-out CV and calculated mean ANOVA, information gain, and relief scores. To estimate the predictive ability of the descriptors and to compare supervised methods we used the set of five top ranked descriptors (according to mean scores) as input for classification. This proce-dure is called internal CV [42].
However, we fully agree with the reviewer that an external CV [42] is required to avoid any selection bias.
Therefore, we now additionally performed external cross-validation using m- 1 partitions (m= 34) for fea-ture selection and training, and used the remaining part for unbiased testing of the classifier. k-nn and logistic
regression now yield both the highest accuracy andF
-Score using RF for feature selection.
However, in contrast tok-nn, the logistic regression is model-based, where the training data is compiled into a concise model that can be subsequently interpreted [38,49]. Therefore, we focused on the results of the logistic regression and changed the related parts of the manuscript.
We also agree with the reviewer that there are unsu-pervised methods that can handle imbalanced datasets. But our aim is to use supervised machine learning, as the class labels are known. Motivated by the comments of Reviewer 3, we performed the classification task with randomized class labels to comparably assess the
perfor-mance. We added these results to the subsection,
Super-vised Machine Learning in the section Results. This analysis shows that the performance drops significantly by randomizing the class labels, and that our method does detect class information essentially.
Answer to Major comments 2: We fully agree with the reviewer that the significance level of 0.1 for theq-value is high. However, a closer look at Table 1 reveals that a significance level of 0.066 would have led to the same number, seven, of descriptors. We decided to accept a higher threshold, and list all seven descriptors with respective significance levels as we felt that this thresh-old is more stimulating for the subsequent analysis and discussion of this metabolic network based classification approach. We added the explanation of our choice to the manuscript.
Answer to Minor comments 1: We added an addi-tional file 1 with tables containing the descriptors used. Answer to Minor comments 2: The authors thank the reviewer for this comment. The enumeration previously only included the two basic feature selection types described by Baumgartner et al. [55] and has now been extended to embedded and ensemble-based methods.
Answer to Minor comments 3: As described in the
section“Comparison to Non-Descriptor-Based
Meth-ods”, we calculated the Kullback-Leibler divergence
(KLD) based on the degree distribution between each network. In particular, this leads to a feature vector for each network containing the KLD for each of the other networks. These features were used to plot Figure 4(b). To make that clear we added a more detailed descrip-tion to the text of Figure 4.
Reviewers comments about authors’s response
and far away from providing an answer to the concerns that I raised in the major comment 1 of my first review.
Authors comment
We thank the reviewer for his comments and appreciate his suggestions. However, we want to clarify that we per-formed the feature selection and the classification as sug-gested by the reviewer. Therefore, we re-performed the classification by splitting the data into a test and a train-ing set and used cross-validation. In particular, we per-formed the feature selection and the training of the classifier using cross-validation only by using the training set. Then we only used the test set to estimate the perfor-mance of the classifier, considering the selected features and the settings learned during the training phase. This
procedure has been repeatedm- 1 times (m= 43) and
note, that this is often refereed to as external cross-vali-dation since the evaluation of the classifier is performed externally. See [41,42], as suggested by the reviewer. In particular, Smialowski et al. [41] state that any model building method integrated with feature selection must beexternallyevaluated and Abroise and McLachlan [42] declare that the same feature selection method must be implemented in each stage of an (external) cross-valida-tion. To remove ambiguity, we now explicitly describe
the used procedure in the section“Material and
Meth-ods”instead of simply calling itexternalCV.
Unsupervised techniques can be fruitful to handle imbalanced data sets [56,57], but we have not dealt with this problem as we put the emphasis ongraph
classifica-tionby using supervised machine learning only. But the
usage of unsupervised techniques such as clustering [56] might be feasible for exploring the networks and their common structural features for several other research questions in the context of distinguishing between the three domains of life.
We are grateful for your comments, as they have improved the text and helped to understand an interdis-ciplinary problem more properly.
Reviewer’s report 3
Christoph Adami, Keck Graduate Institute, Claremont, California, United States of America
In this contribution, the authors attempt to use the structural properties of metabolic networks to identify what domain of life they belong to, using a dataset of 43 previously published networks and a set of topological descriptors of the network, using 33“descriptors”or fea-tures. The authors show that using feature selection as well as machine learning methods, they can classify the networks with an accuracy of over 88%, as compared to the 63.5% performance of always picking bacteria, the most abundant domain in the data set.
There are a number of points that require clarification.
Abstract: You discuss “two groups”of descriptors but do not mention what these two groups are. This is con-fusing the reader.
Materials & Methods: While I understand that it is not possible to describe each of the descriptors in the manuscript, there should at least be a Table of them, with perhaps a single line that summarizes the nature of the descriptor, as well as a reference. Without it, I find myself constantly looking for what abbreviations such as
“ID, C, ICR, J, IfpexpDist” etc mean. In fact, I’m sure some of them are never defined in the text. Then, what good does it do to give me the rank of a feature (as in Tables 1) if I have no idea what these feature are?
You mention the software packet you use (QuACN) for
the first time in the“Data”subsection, without introducing it, describing it, or telling the reader what the acronym stands for. In fact, the sentence“As the implementation of
QuACNis only capable of ....”sounds as if you introduced it before, but you did not.“Leave-one-out cross-validation” is technically the incorrect term for what you are doing: it is really m-fold cross-validation, because you divide the dataset into m groups. In“Leave-one-out cross-validation” you would divide the data set into 43 groups, and cross-validate by leaving one out, 43 times. Unlessm= 43, then
they are the same. And you don’t mention what m you
use. You form two group of descriptors, but you do not give us a list of which descriptors are deemed to be entropy-based and which aren’t. You can give that infor-mation in the Table that summarizes the 33 features.
Results: The results of the univariate analysis are not presented well. Table 1 lists 8 descriptors (most of them obscure as we have not been given even the most cur-sory description of them) and that they show a group effect“in at least one” domain. Would it be so difficult to give the F-statistic for each domain? Also, it is cur-ious that the generally accepted practice of using a 5% significance level has been replaced by a 10% level with-out any discussion. Could it be that it was done so that the authors’parametric entropy makes the cut???
You claim that NBD measure do not perform as well as EBD measures in classifying the domains (the paragraph that starts with“The basic topological descriptors....”), but it is not at all clear whether the performance score differences you give are significant, because I suspect that the number of features in each set is not equally balanced. For the life of me, I cannot find these numbers (how many descriptors of each kind) in the manuscript.
You really need that Table. Whether a weightedF-score
Moreover, it is not clear whether your method will be able to use the features to successfully predict the domains using data that was not used for training. It is well known that machine learning techniques can explain even random data to some degree. One way to test this is to scramble the data so that networks are given random domains (but leaving the relative numbers the same. that is 32 bacterial networks, six arch, and five eukaryotic networks). After this, apply the learning algorithm exactly as before. If you can recover this (obviously bogus) classification using your machine learning algorithm, then all you did was fit the data. But if the prediction accuracy falls significantly, then you are indeed capturing something essential using the struc-ture-based descriptors.
Finally, English language is strongly deficient in parts. Please ask a native speaker to go over the manuscript.
Author’s response
We thank the reviewer for his comments, and agree that we did not introduce the two groups in the abstract but emphasize that they have been introduced in detail in
the sectionMaterial and Methods. Hence, we think it
would be more confusing to the reader if we introduce the two groups within the limited space of the abstract, without a detailed description.
We fully agree with the reviewer that a table with the used descriptors is necessary to interpret our results. Therefore, we added a file that lists the different used topological descriptors.
As the R-packageQuACNwas not introduced correctly
in the Datasubsection, we now introduce the package
in the sectionBackground.
The reviewer is right that we did not mention the value
form. However,m= 43, soLeave-one-out
cross-valida-tionis technically the correct term for the applied CV. We now specify the valuemin the sectionMethods.
The choice of 0.1 for the significance level of theq-value is already explained in the response to the comments of Reviewer 2. However, we only performed the univariate analysis to motivate the classification. If there were not more descriptors within this significance level of 0.1, further analysis would not have been promising. We added the explanation of our choice to the manuscript.
The reviewer is right that the number of descriptors is not the same in the two groups of descriptors and that it is not clear whether the WFS is significant by comparing the two groups (NEBD vs. EBD) without knowing the amount of descriptors in each group. As mentioned before, we added an additional file containing a descrip-tion of the groups of descriptors. Moreover, motivated by the comments of Reviewer 2 we performed the whole analysis again using external feature selection. This leads to new unbiased WFSs that can be compared because the classification was done by using the best five features
within each group. Note that our aim is to classify our data using (supervised machine learning). So we did not perform a PCR analysis because that would not shed light on the classification problem. In our understanding, the dependent variable has to be numeric for a regression analysis and in our case it is discrete (Archaea, Bacteria, Eukaryote). Moreover, as we understand a PCR, it would show how much each feature explains the variation in each principal component and not in the three domains. However, performing a PCA did not cluster the networks in a meaningful way.
We thank the reviewer for the recommendation to perform the analysis with randomized data to show whether we capture something essential or simply over-fit the data. Therefore, we permuted the class labels ran-domly, as recommended by the reviewer, and applied the same algorithm on the data. This led to a WFS of 58.5% and an ACC of 58.5%. These results show that the performance decreases substantially by randomizing the class labels and indicates that we capture essential structural information of the underlying metabolic net-works. We added these results to the manuscript.
Additional material
Additional file 1: Tables of Network Descriptors. This file contains an overview of the descriptors used.
Acknowledgements
This work was supported by the COMET Center ONCOTYROL and funded by the Federal Ministry for Transport Innovation and Technology (BMVIT) and the Federal Ministry of Economics and Labour/the Federal Ministry of Economy, Family and Youth (BMWA/BMWFJ), the Tiroler Zukunftsstiftung (TZS) and the State of Styria represented by the Styrian Business Promotion Agency (SFG) and supported by the Innsbruck Medical University, Verein Sanitätsbetrieb der Autonomen Provinz Bozen and TILAK -Tiroler Landeskrankenanstalten GmbH.
Laurin AJ Mueller also was supported by the Tiroler Wissenschaftsfonds (Project: CoNAn - Phase II).
Michael Netzer was funded by the Austrian Genome Project (GEN-AU project: BIN III).
We thank Frank Emmert-Streib for drawing our attention to the network data.
Author details
1Institute for Bioinformatics and Translational Research, Department of Biomedical Sciences and Engineering, University for Health Sciences, Medical Informatics and Technology (UMIT), Austria.2Institute of Electrical, Electronic and Bioengineering, Department of Biomedical Sciences and Engineering, University for Health Sciences, Medical Informatics and Technology (UMIT), Austria.
Authors’contributions
LAJM, KGK and NM performed the computations and LAJM, KGK, NM, AG and MD interpreted the results. MD initiated and supervised the study. LAJM, KGK, NM, AG and MD wrote the paper. All authors created the manuscript and approved the final version.
Competing interests
Received: 27 May 2011 Accepted: 13 October 2011 Published: 13 October 2011
References
1. Alberts B, Johnson A, Lewis J, Raff M, Roberts K, Walter P:Molecular Biology of the Cell.5 edition. Garland Science; 2007 [http://www.garlandscience. com/textbooks/0815341059.asp].
2. Jeong H, Tombor B, Albert R, Oltvai ZN, Barabási AL:The Large-Scale Organization of Metabolic Networks.Nature2000,407(6804):651-654. 3. Koyutürk M:Algorithmic and Analytical Methods in Network Biology.
Wiley Interdisciplinary Reviews: Systems Biology and Medicine2010, 2(3):277-292 [http://www3.interscience.wiley.com/journal/122614928/ abstract].
4. Ravasz E, Somera A, Mongru D, Oltvai Z, Barabási A:Hierarchical Organization of Modularity in Metabolic Networks.Science2002, 297(5586):1551.
5. Ebenhöh O, Handorf T:Functional Classification of Genome-Scale Metabolic Networks.EURASIP Journal on Bioinformatics and Systems Biology
2009,2009:6.
6. Hancock T, Mamitsuka H:A Markov Classification Model for Metabolic Pathways.Proceedings of the 9th international conference on Algorithms in bioinformaticsWABI’09, Berlin, Heidelberg: Springer-Verlag; 2009, 121-132 [http://portal.acm.org/citation.cfm?id=1812906.1812917].
7. Zhu D, Qin Z:Structural Comparison of Metabolic Networks in Selected Single Cell Organisms.BMC bioinformatics2005,6:8.
8. Dehmer M, Mowshowitz A:A History of Graph Entropy Measures.
Information Sciences2011,181:57-78 [http://linkinghub.elsevier.com/retrieve/ pii/S0020025510004147].
9. Bonchev D:Information Theoretic Indices for Characterization of Chemical StructuresResearch Studies Press, Chichester; 1983.
10. Dehmer M, Varmuza K, Borgert S, Emmert-Streib F:On Entropy-based Molecular Descriptors: Statistical Analysis of Real and Synthetic Chemical Structures.J Chem Inf Model2009,49:1655-1663.
11. Trucco E:A Note on the Information Content of Graphs.Bulletin of Mathemtical Biology1956,18(2):129-135.
12. Mueller LA, Kugler KG, Dander A, Graber A, Dehmer M:Network-based Approach to Classify Disease Stages of Prostate Cancer Using Quantitative Network Measures.Conference on Bioinformatics & Computational Biology (BIOCOMP’10), Las Vegas/USA2010, ,I:55-61. 13. Kugler K, Mueller L, Graber A, Dehmer M:Integrative Network Biology: Graph
Prototyping for Co-Expression Cancer Networks.PLoS ONE2011,6(7):e22843. 14. Dehmer M, Barbarini N, Varmuza K, Graber A:Novel Topological Descriptors
for Analyzing Biological Networks.BMC structural biology2010,10:18. 15. Mueller LA, Kugler KG, Dander A, Graber A, Dehmer M:QuACN: An R Package for Analyzing Complex Biological Networks Quantitatively.
Bioinformatics2011,27:140-141.
16. Cook D, Holder LB:Mining Graph DataWiley-Interscience; 2007. 17. Dehmer M, Mehler A:A New Method of Measuring Similarity for a
Special Class of Directed Graphs.Tatra Mountains Mathematical Publications2007,36:39-59.
18. Deshpande M, Kuramochi M, Karypis G:Automated Approaches for Classifying Structures.Proceedings of the 3-rd IEEE International Conference of Data Mining2003, 35-42.
19. Goh K, Oh E, Jeong H, Kahng B, Kim D:Classification of Scale-Free Networks.Proceedings of the National Academy of Sciences of the United States of America2002,99(20):12583.
20. Li X, Zhang Z, Chen H, Li J:Graph Kernel-Based Learning for Gene Function Prediction from Gene Interaction Network.Proceedings of the 2007 IEEE International Conference on Bioinformatics and Biomedicine2007. 21. Chuang HY, Lee E, Liu YT, Lee D, Ideker T:Network-Based Classification of
Breast Cancer Metastasis.Mol Syst Biol2007,3:140.
22. Zelinka A:On a Certain Distance Between Isomorphism Classes of Graphs.Cas Pest Mat1975,100:371-375.
23. Sobik F:Modellierung von Vergleichsprozessen auf der Grundlage von Ähnlichkeitsmaßen für Graphen.ZKI-Inf., Akad Wiss DDR1986, 4:104-144.
24. Eppstein D:Subgraph Isomorphism in Planar Graphs and Related Problems.Journal of Graph Algorithms and Applications1999,3(3):1-27. 25. Overbeek R, Larsen N, Pusch GD, D’Souza M, Selkov E, Kyrpides N,
Fonstein M, Maltsev N, Selkov E:WIT: Integrated System for
High-Throughput Genome Sequence Analysis and Metabolic Reconstruction.
Nucleic Acids Res2000,28:123-125.
26. Emmert-Streib F, Dehmer M:Networks for Systems Biology: Conceptual Connection of Data and Function.IET Systems Biology2011,5(3):185-207 [http://www.ncbi.nlm.nih.gov/pubmed/21639592].
27. Dehmer M, Barbarini N, Varmuza K, Graber A:A Large Scale Analysis of Information-Theoretic Network Complexity Measures Using Chemical Structures.PLoS ONE2009,4(12).
28. Mowshowitz A:Entropy and the Complexity of the Graphs I: An Index of the Relative Complexity of a Graph.Bull Math Biophys1968,30:175-204. 29. Todeschini R, Consonni V:Molecular Descriptors for ChemoinformaticsVch
Pub; 2009.
30. Chambers M, Hastie T:Statistical Models in SChapman and Hall/CRC; 1991. 31. Benjamini Y, Hochberg Y:Controlling the False Discovery Rate: A Practical
and Powerful Approach to Multiple Testing.Journal of the Royal Statistical Society. Series B (Methodological)1995,57:289-300.
32. Team RDC:R: A Language and Environment for Statistical ComputingR Foundation for Statistical Computing, Vienna, Austria; 2011 [http://www.R-project.org], [ISBN 3-900051-07-0].
33. Osl M, Dreiseitl S, Cerqueira F, Netzer M, Pfeifer B, Baumgartner C: Demoting Redundant Features to Improve the Discriminatory Ability in Cancer Data.J Biomed Inform2009,42(4):721-725.
34. Saeys Y, Inza I, Larrañaga P:A Review of Feature Selection Techniques in Bioinformatics.Bioinformatics2007,23(19):2507.
35. Netzer M, Millonig G, Osl M, Pfeifer B, Praun S, Villinger J, Vogel W, Baumgartner C:A new Ensemble-Based Algorithm for Identifying Breath Gas Marker Candidates in Liver Disease Using Ion Molecule Reaction Mass Spectrometry.Bioinformatics2009,25(7):941-947.
36. Quinlan RJ:C4.5: Programs for Machine LearningCA, USA: Morgan Kaufmann; 1993.
37. Kononenko I:Estimating Attributes: Analysis and Extensions of RELIEF.
C4.5: Programs for Machine LearningSpringer Verlag; 1994, 171-182. 38. Witten IH, Eibe F:Data Mining: Practical Machine Learning Tools and
Techniques, Second Edition (Morgan Kaufmann Series in Data Management Systems).2 edition. Morgan Kaufmann series in data management systems, Morgan Kaufmann; 2005 [http://www.netLibrary.com/urlapi.asp? action=summary&v=1&bookid=130260].
39. John GH, Langley P:Estimating Continuous Distributions in Bayesian Classifiers.Proceedings of the Eleventh Conference on Uncertainty in ArtifcialIntelligence1995, 338-345 [http://citeseerx.ist.psu.edu/viewdoc/ summary?doi=10.1.1.8.3257].
40. Le Cessie S, Van Houwelingen JC:Ridge Estimators in Logistic Regression.
Applied Statistics1992,41:191-201.
41. Smialowski P, Frishman D, Kramer S:Pitfalls of Supervised Feature Selection.Bioinformatics2010,26(3):440.
42. Ambroise C, McLachlan G:Selection Bias in Gene Extraction on the Basis of Microarray Gene-Expression Data.Proceedings of the National Academy of Sciences of the United States of America2002,99(10):6562.
43. Eibe F, Hall M, Trigg L, Holmes G, Witten IH:Data Mining in Bioinformatics Using Weka.Bioinformatics2004,20(15):2479-2481.
44. Winne P:Exploring Individual Differences in Studying Strategies Using Graph Theoretic Statistics.Alberta journal of educational research1994,40(2):177-93. 45. Skorobogatov VA, Dobrynin AA:Metrical Analysis of Graphs.Commun
Math Comp Chem1988,23:105-155.
46. Watts D, Strogatz S:Collective Dynamics of‘Small-World’Networks.
Nature1998,393(6684):440-442.
47. Bonchev D, Trinajstic N:Information Theory, Distance Matrix, and Molecular Branching.Journal of Chemical Physics1977,67:4517-4533. 48. Doyle JK, Garver JE:Mean Distance in a Graph.Discrete Mathematics1977,
17:147-154.
49. Gao B, Ester M:Right of Inference: Nearest Rectangle Learning Revisited.
Machine Learning ECML 20062006, 638-645.
50. Kullback S, Leibler RA:On Information and Sufficiency.The Annals of Mathematical Statistics1951,22:79-86.
51. Dehmer M, Mueller LAJ, Graber A:New Polynomial-Based Molecular Descriptors with Low Degeneracy.PLoS ONE2010,5(7):e11393 [http://dx. plos.org/10.1371/journal.pone.0011393].
53. Mueller LA, Kugler KG, Dehmer M:Stuctural Analysis of Molecular Networks: AMES Mutagenicity.Conference on Bioinformatics & Computational Biology (BIOCOMP’10), Las Vegas/USA2011.
54. Hastie T, Tibshirani R, Friedman J:The Elements of Statistical Learning: Data Mining, Inference, and PredictionSpringer Series in Statistics; 2009. 55. Baumgartner C, Osl M, Netzer M, Baumgartner D:Bioinformatic-Driven
Search for Metabolic Biomarkers in Disease.Journal of Clinical Bioinformatics2011,1:2 [http://www.jclinbioinformatics.com/content/1/1/2]. 56. Cannistraci C, Ravasi T, Montevecchi F, Ideker T, Alessio M:Nonlinear Dimension
Reduction and Clustering by Minimum Curvilinearity Unfold Neuropathic Pain and Tissue Embryological Classes.Bioinformatics2010,26(18):i531. 57. Martella F:Classification of Microarray Data with Factor Mixture Models.
Bioinformatics2006,22(2):202.
doi:10.1186/1745-6150-6-53
Cite this article as:Muelleret al.:A network-based approach to classify the three domains of life.Biology Direct20116:53.
Submit your next manuscript to BioMed Central and take full advantage of:
• Convenient online submission
• Thorough peer review
• No space constraints or color figure charges
• Immediate publication on acceptance
• Inclusion in PubMed, CAS, Scopus and Google Scholar
• Research which is freely available for redistribution