Topic-based Social Influence Measurement for Social
Networks
1Asso Hamzehei
University of New South Wales assoh@cse.unsw.edu.au
Shanqing Jiang
University of New South Wales
Danai Koutra
University of Michigan
Raymond Wong
University of New South Wales
Fang Chen
University of New South Wales
Abstract
Social science studies have acknowledged that the social influence of individuals is not identical. Social networks structure and shared text can reveal immense information about users, their interests, and topic-based influence. Although some studies have considered measuring user influence, less has been on measuring and estimating topic-based user influence. In this paper, we propose an approach that incorporates network structure, user-generated content for topic-based influence measurement, and user’s interactions in the network. We perform experimental analysis on Twitter data and show that our proposed approach can effectively measure topic-based user influence.
Keywords: Topic-based social influence, Social networks analysis, influence measurement
1
Introduction
Although social influence has been an area of interest for researchers in sociology and more recently in computer science, still there is no agreement on its definition. A very early definition for influential people is “individuals who were likely to influence other persons in their immediate environment” (Katz 1957). Social influence has either been studied to identify influential users (opinion leaders or authorities), topical or topic-based influential users (Riquelme 2015).
Social science studies, e.g. (Katz and Lazarsfeld 1955), have acknowledged the fact that the social influence of individuals is not identical. Katz (1957) introduced three main factors that are related to an individual’s social influence such as: Who one is, what one knows, and whom one knows. The individual’s social influence can be much more easily observed on social media while it is confirmed that the social influence factors are similar in social networks to those in the real society (Eccleston and Griseri 2008, Libai, Bolton et al. 2010). For example, Eirinaki, Monga et al. (2012) introduced two factors (popularity and activity) as factors related to social influence on Online Social Networks (OSN).
Another aspect of studied influence has been the scale of affected users by a post on social network or intensity of emotional and cognitive impact (McNeill and Briggs 2014).
According to Probst, Grosswiele et al. (2013), influential users have different influences on different topics and a very influential user is not necessarily influential on all topics. It is indicated in Kardara, Papadakis et al. (2015) that topic-based influence measures are more effective and functional than the global ones. One of the differences of topic-related influence studies to network structure analysis is that it takes the posts’ (e.g., tweets) content into account. When we consider user influence on topics, no longer the whole network needs to be analysed, which improves the performance of measures.
However, there are drawbacks and shortcomings in the topic-based influence studies. In most of the existing works, they have aimed at making influential user detection more effective in retrieving the top N users only. Less effort is dedicated in discriminating influential from non-influential users. Also, approaches that use supervised learning (e.g., SVM) suffer from their dependency on labelled data, which is extremely expensive to prepare for the immense data of social networks. Another considerable issue in these studies is their approach evaluation. This is a difficult task as influence is subjective. More importantly, prediction of user influence is remained as a problem to address in the state-of the-art. Topic-based user influence measurement and identification are important challenges and the focuses of this paper. This task is significantly important for different applications such as marketing, election campaigns, or recruiting employees for a company. In this work, we measure topic-based user influence on observed topics in which they have shown their interests by posting in social networks. Our approach, called TSIM (Topic-based Social Influence Measure), incorporates network structure, user generated contents, users history of activities, and network users engagement in user’s activity. Our approach represents users with their topic interests and their social influence on each observed topic.
In more detail, our contributions are:
We propose a novel topic-based influence measurement approach to integrate the user-topic relationships, user-topic content information, and social connections between users into the same principled model.
Instead of considering user-to-user influence and global user influence, the proposed model considers individuals’ influence and interests in a topic, which gives the capability of predicting one’s influence on a new topic.
Finally we have prepared a unique dataset from real-world social networks for testing and evaluating the proposed approach that contains all the social media related metadata.
The remainder of this paper is organized as follows. We first discuss existing approaches for topic-based influence analysis in Section 2. We then present the background in Section 3. Next, we define the research problem, and then propose our approach and algorithms in Section 4. We describe our dataset and discuss the results in Section 5. Finally, we conclude the paper in Section 6.
2
Related Work
PageRank on follower/following graph in Twitter (along with number of followers and number of retweets). The network structure is relatively static compared to the activities of users in social networks. Some studies have included the social network related meta data (in case of Twitter, the meta data are retweets, mentions, and likes) (Hajian and White 2011).
Topic-based Influence. Following the influence studies (overall user influence) on social networks, less studies have shed light on topic-based influence. More recently, topic-based influence studies have combined content of user posts with link-based metrics. Haveliwala (Haveliwala) proposed a topic-sensitive extension of PageRank to rank query results in regards to the query topics. The idea of topic-sensitive PageRank was later used and adjusted for social networks such as Twitter for ranking topic-based user influence. Also, topical authorities studied by Pal and Counts (2011). They proposed a Gaussian-based ranking to rank users efficiently. They used probabilistic clustering to filter feature space outliers and showed that mentions and topical signals are more important features in ranking authorities. Kong and Feng (2011) intended to identify and rank users that are posting quality tweets. They defined a topic-based high quality tweet with the author’s topic-specific influence, topic related author’s behaviour. They applied their proposed metric on graph of following and retweets. Xiao, Noro et al. (2014) aimed at detecting topic related influential users by looking at hashtag user communities where hashtags are pre-identified from news keywords. They proposed RetweetRank and MentionRank as content-based and authority-based influential users. Similarly, Hu, Fang et al. (2013) worked on detecting topical authorities with the assumption that retweeting propagates topical authority. Montangero and Furini (2015) also measured Twitter topic-based user influence where they identify topics by hashtags. Although hashtags can reveal the tweet’s topic correctly, over 80% of tweets do not have hashtags. These results are neglecting the majority of tweets and can mislead a topic-based user influence, as 4 out of 5 of her tweets are not considered for measuring her influence. Cataldi and Aufaure (2014) estimated Twitter user influence for topics of conversations based on PageRank. For that purpose they build a topic information exchange graph to take the information diffusion and degree of information shared into account for user influence estimation. They manually considered seven topic categories and later assign each tweet to those categories through an n-gram model. However, their approach is unable to identify topics in the lower level of the main categories. For example, if someone is detected as influential in the sports category we do not know which sport the influence belongs to. Weng, Lim et al. (2010) proposed TwitterRank, a PageRank extension, that measures user influence by calculating topical similarities of users and their network connections. For topic identification, they used the unsupervised text categorization technique, LDA, by aggregating all tweets of a user into a document. Although this approach is presented as topic-sensitive, this approach cannot discriminate the user influence for the topics. Sung, Moon et al. (2013) proposed another extension of PageRank, and unlike (Weng, Lim et al. 2010), it does not need predefined topics for topic-based user influence. In (Cano, Mazumdar et al. 2014), a PageRank-based user influence rank algorithm introduced that the user links have weights based on their topics of interest similarities. In (Liu, Shen et al. 2014), their topic-based influence framework considers retweet frequency and link strength. The link strength is estimated by Poisson regression-based latent variable model on user’s frequency of retweeting each other. Welch, Schonfeld et al. (2011) found out that topical relevance is better detectable through the retweet link rather than following links. They used two variations of PageRank algorithm to on retweet and following graphs for that purpose. In a recent work by Katsimpras, Vogiatzis et al. (2015), they proposed a supervised random walk algorithm for topic sensitive user ranking. As it is obvious from the algorithm name, it needs labelled data, which is not very practical in many cases especially with the volume of social networks.
3
Background
Next, we give preliminaries for Probabilistic Topic Modelling and Pagerank.
3.1
Probabilistic Topic Modelling
Given a set of documents denoted by D = [d1, …, dq], Topic Modelling generates a set of t topics denoted by 𝒯 = [t1, ⋯, tj]. Each topic is related to a weighted representation over m words denoted by tj = [w1⋯wm], where wj is the weight representing the contribution of word wm to topic tj. Probabilistic topic modelling, such as Latent Dirichlet Allocation (LDA), represents a low dimensional space of corpus by detecting a set of latent topics. The basic idea of Probabilistic Topic Modelling is having a Z hidden variable for each word’s co-occurrence in the collection of documents. Z can range among j topics where each topic is a distribution over a fixed vocabulary. Given a corpus, a document may contain multiple topics and the words are assumed to be generated by those topics. A probabilistic topic model can be generated over a process as follows (Blei, Ng et al. 2003):
1. Obtain a distribution over topics to generate a document (in LDA this distribution is drawn from a Dirichlet distribution with a corpus-specific hyperparameter α)
2. Then for each word to be generated;
a. Assign topics by drawing upon the document-specific distribution over topics b. Finally, generate a word from distribution of topics over words in dictionary,
which means words of each document come from a mixture of topics.
We aim to use probabilistic topic modelling to represent items as a set of topics and also detect social network users interest by applying topic modelling on their timelines.
3.2
PageRank
PageRank is a webpages ranking algorithm that calculate rank Xi for vertex vi based on the rank of other vertices in the graph that point to vertex vi. Assume G(
V
,E) denotes a directed graph, where the setV
of vertices consists of i users and users relationships are the edges setE. Considering ui as a user equal to vertex vi in the graph G, the directed edge (i, i') exists if user
ui is connected to user ui’. The directed vertices of the graph G contained in the asymmetric adjacency matrix L = (Li,i'), where L(i,i') = 1 if ui → ui’ and Li, i' = 0 otherwise. Out-degree
Dout(i) is the number of users that points to user i.
𝑋
𝑖= ∑
𝐷
𝑜𝑢𝑡(𝑖′)
−1𝑋
𝑖 (𝑖′,𝑖)∈𝐸The above equation is a recursive function that gives any vertex points to vertex vi, a fraction of the rank inversely.
In PageRank, each out-going link from vi is weighted by 1/oi, thus every node has the same total out-going weights. Each node has a total of one vote. PageRank uses an idea that a “good” node should connect to or be pointed to by other “good” nodes. However, instead of mutual reinforcement, it adopts a web surfing model based on a Markov process in determining the scores:
𝑥 = 𝐼
𝑜𝑝(𝑥)
where the Iop is an authority that is pointed to by many hubs and the Iop operation is defined to be
𝐼
𝑜𝑝(. ) = 𝐿
𝑇𝐷
𝑜𝑢𝑡−1
≡ 𝑃
𝑇.
This amounts to rescale the adjacency matrix L such that each row is sum-to-one. Thus,
At any moment, millions of people are using the social networks. PageRank assumes the users follow the random surfing model in viewing and engaging with the rest of network. They will reach the equilibrium (stationary) distribution under general conditions. If a node has a high probability in the equilibrium distribution that means more nodes will point to that node. Therefore, the equilibrium distribution of users in social network is a measure of a node’s importance, which is the authority score in PageRank. The equilibrium distribution x is determined by
𝑃
𝑇𝑥 = 𝜆𝑥
and x satisfies ∑kx(k)=1. One can obtain the solution iteratively. Note that λ = 1 if the Markov process has an equilibrium distribution x. PageRank models two types of random jumps on the Internet.
(i) Link-tracking jump: a user often follows other users in the network by simply clicking on them; this is modelled by LTDout−1.
(ii) Link-interrupt jump: a user sometimes observes to engage with a user that they are not already connected to each other. PageRank models such link-interrupt jump with a simple uniform distribution (1 − α)/n. The full stochastic matrix of transition probability is
P
T=
I
op(.)=
αL
TD
out−1+ (1 −
α
)(1/
n
)
ee
Twhere α = 0.8 ∼ 0.9. Here e = (1, 1, … ,1)T; thus eeT is a matrix of all 1’s (Arasu, Novak et al. 2002).
4
Topic-based Social Influence Measurement
4.1
Problem Definition
Assume G(
V
,E) denotes a social network graph, where users are the vertex setV
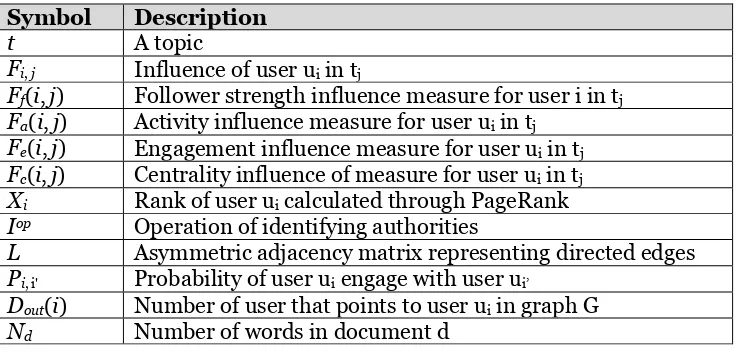
and users relationships are the edges set of E. Assume that users publish a set of texts D = [d1, d2, …, dq], and talk about different topics 𝒯 = [t1, t2, …, tj]. Each user text (post) dq holds one or more topics and receives engagement from other users by replying, liking, or re-publishing it. The engagement of other users in a post can reveal the influence of that particular post among its audience.Symbol Description
t A topic
Fi, j Influence of user ui in tj
Ff(i, j) Follower strength influence measure for user i in tj
Fa(i, j) Activity influence measure for user ui in tj
Fe(i, j) Engagement influence measure for user ui in tj
Fc(i, j) Centrality influence of measure for user ui in tj
Xi Rank of user ui calculated through PageRank
Iop Operation of identifying authorities
L Asymmetric adjacency matrix representing directed edges
Pi, i' Probability of user ui engage with user ui’
Dout(i) Number of user that points to user ui in graph G
Nd Number of words in document d
Table 1: Key notations
of user i on user i′ is not necessarily equal to influence of user i′ on user i. We also assume that user post is visible to all users in G.
Figure 1: TSIM Work Flow.
Quantifying the topic-based influence of each user based on social ties and other users’ engagement in social networks, we can identify the influence of user i on topic j, represented as Fij. Then we have matrix F = [Fij]i×j that represents influence of all the users in all identified topics.
4.2
Our Approach
To measure social influence on an observed topic in a social network, we propose TSIM, Topic-based Social Influence Measure, which measures topic-Topic-based individuals influence in social networks. In a nutshell, our model contains two main phases:
Identifying topics on social networks according to users generated contents, and
Measuring individuals influence for the detected topics.
Figure 1 shows our approach’s work flow. First, we collect user-generated content from the social media. For each user-generated content, we collect related information such as list of users that have re-published the content (Ri) and list of users that have engaged in that content (Mi) as well as metadata connected to the content. We identify the topics by applying probabilistic topic modelling, LDA, on all the user-generated text. Each topic contains a set of posts with all their related information and metadata, such as; content, replies, and republishing. For each tuple of (useri, topicj), we measure the influence of user ui on topic tj as
Fij* which comprises of four measures Ff, Fa, Fe, Fc. The details of influence measurement algorithm are shown in Figure 2 and Section 4.3. The measure Fij* identifies user influence for the identified topics and users can be ranked according to their Fij* score for each topic.
4.3
Influence Measurement
We define social influence in a social network as importance of a user in the social network graph, user’s activities, and involvement of others in the user’s posts. Social influence can be analysed through different modalities network structure and user’s position in the network, scale of a user’s post diffusion in the network, a user’s activities and engagement in the social network, and message content that a user broadcast in the network (Embar, Bhattacharya et al. 2015).
one or more topics, thus, the influence of that user on different aspects. For instance, in Twitter, a post can contain user mentions, receive replies, and get retweeted by other users. All this information can reveal social influence of a user.
Let denote Dt as the set of collected texts related to topic tj from the set of topics 𝒯. Each text
di contains a set of attributes as (ui, ci, Ri, Mi, fi) where ui is the author of the text, ci is the text,
Ri is the list of users republished the text, Mi is the list of mentions for that text, and fi is the number of followers of the text author.
We define the following dimensions for measuring social influence of a user on a topic as following:
Algorithm: Influence Measurement
Input: List of topics, collection of user posts for each topic, interaction graphs, number of friends of each user.
Output: Matrix of user influence on each topic. 1. for topic in topics do
2. for user in users do 3. 𝐹𝑓(𝑖) ← # 𝑓𝑟𝑖𝑒𝑛𝑑𝑠 4. 𝐹𝑎(𝑖, 𝑗) ← ∑𝑑𝑖∈𝐷𝑗𝛿(𝑑𝑖)
5. 𝐹𝑒(𝑖, 𝑗) ← ∑𝑑𝑖∈𝐷𝑗(𝛿(𝑅𝑖) + 𝛿(𝑀𝑖)) 6. 𝐹𝑐(𝑖, 𝑗) ← 𝑃𝑅(𝑢𝑖, 𝐺(𝐷𝑗))
7. 𝐹𝑖𝑗∗ ← 𝑎𝑔𝑔𝑟𝑒𝑔𝑎𝑡𝑖𝑜𝑛 𝑜𝑓 𝐹
𝑓(𝑖), 𝐹𝑎(𝑖, 𝑗) , 𝐹𝑒(𝑖, 𝑗), 𝐹𝑐(𝑖, 𝑗) 8. Return matrix of user influence on topic
Figure 2:Topic-based Influence Measurement Algorithm
Follower scale: This measure depicts the number of friends a user has in the network. This value is constant across all topics for a user and is independent of topics. It shows the strength of social ties of a user. Although the number of social connections can be an indicative of influence, it does not carry information on any specific topic. The following influence measures are more topic-specific.
Topic Activity: This measure captures topic-related activities of a user. Fa(i, j) denotes influence of user ui in terms of activities related to topic tj and we define it as:
𝐹
𝑎(𝑖, 𝑗) = ∑ 𝛿(𝑑
𝑖)
𝑑𝑖∈𝐷𝑡Figure 3: Retweet and Mention Graph
Topic-based Attractiveness: This measure indicates how other users are attracted to useri’s post. It takes other users’ feedback on user ui’s activities into account. We define it as
𝐹𝑒(𝑖, 𝑗) ← ∑ (𝛿(𝑅𝑖) + 𝛿(𝑀𝑖) 𝑑𝑖∈𝐷𝑡
where δ(Ri) is the number of times di is republished by other users and δ(Mi) is the number of mentions or replies of di.
Network centrality: Centrality of a user is another indicator of her influence in a social network. PageRank was introduced first for ranking webpages for search engines, and can be used here to calculate topic-specific centrality of users in the social graph. Figure 3 shows an interaction graph of users on a post generated by user 1. To that end, we perform PageRank on the induced graph of interactions on a specific topic tj. The interaction graph is a better representative of the topical relevance of two users rather than friendship graph (Welch, Schonfeld et al. 2011). We denote it as:
𝐹𝑐(𝑖, 𝑗) ← 𝑃𝑅(𝑢𝑖, 𝐺(𝐷𝑡))
where G(Dt) is a graph corresponding to users over documents set Dt for topic t. PR(ui, G(Dt)) indicates the PageRank score of user ui in the graph G(Dt). In this work, we reconstruct the interaction graph, (e.g., retweet and mention graphs from Twitter), to measure topic specific centrality of users by PageRank.
Aggregating Influence Scores: The four influence measures described above Ff, Fa, Fe, Fc will be aggregated to form a single influence score F* for user ui in topic tj. For the first attempt, we averaged the measures, which gives every measure the same share in the overall influence score. For the future works, we investigate other methods for aggregating the measures.
5
Results and Experiments
In this section, we discuss the details of conducted experiments. It includes the data and the influence measurement performed by our proposed method.
User Topic1 Topic2 Topic3 Topic4
vnfrombucharest [0, 0, 0, 0] [0, 0, 0, 0] [0.1, 0.02, 0.51, 0.01] [0, 0, 0, 0]
CharlieDataMine [0.12, 0.01, 0.34, 0.2] [0, 0, 0, 0] [0.1, 0.02, 0.51, 0.16] [0.28, 0.2, 0.38, 0.16]
sepehr125 [0, 0, 0, 0] [0, 0, 0, 0] [0, 0, 0, 0] [0, 0, 0, 0]
sDataManagement [0.12, 0.02, 0.35, 0.7] [0.05, 0.04, 0.15, 0.7] [0.6, 0.04, 0.51, 0.67] [0, 0, 0, 0]
yisongyue [0, 0, 0, 0] [0, 0, 0, 0] [0, 0, 0, 0] [0.07, 0.05, 0.27, 0.08]
User Topic1 Topic2 Topic3 Topic4
vnfrombucharest 0 0 0.159 0
CharlieDataMine 0.157 0 0.197 0.254
sepehr125 0 0 0 0
sDataManagement 0.29 0.227 0.457 0
yisongyue 0 0 0 0.117
Table 3: A sample from the influence matrix after aggregating the 4 influence measures of user i in topic t.
5.1
Dataset
To validate our proposed method, we collected a unique dataset from Twitter using the Twitter Search API. We targeted the Machine Learning domain and identified core 500 users that have mentioned machine learning as a keyword in their profile description. To choose the users, we selected a set of machine learning users as seeds and crawled among their friends and friends of friends for other machine leaning-related users. For the prepared list of users, we gathered their timeline tweets which for most of the users covers their tweets for the last 5 years. For each tweet, we also, collected the related meta-data such as the list of users who have replied to each tweet (mention list) and the list of users who have retweeted each tweet (retweet list). The final dataset contains 101,363 tweets with their related metadata, mention lists, and retweet lists. The network that is built on retweet list contains 301,870 nodes.
5.2
Evaluation
Our experiments contain a main task of user influence measurement on the identified topics from the tweet corpus.
We evaluate the measured user influence through expert opinion and user citations on the topics that the user has published in scientific conferences and journals. We collected publications through Google scholar for validation. The community of study is intentionally chosen as researchers then we are able to cross-validate our results through the users influence in research community measured by topics of their publications and citations.
5.2.1 Topic-based Influence Measurement
Next, we proceed with identifying topics from the collection of all tweets and then measuring influence. The number of topics generated by LDA can affect the quality of features that will be used in TSIM. We determined a number of topics through cross validation that we could receive higher recall in user influence prediction. In our proposed approach, we perform probabilistic topic modelling for identifying the topics in the tweets dataset.
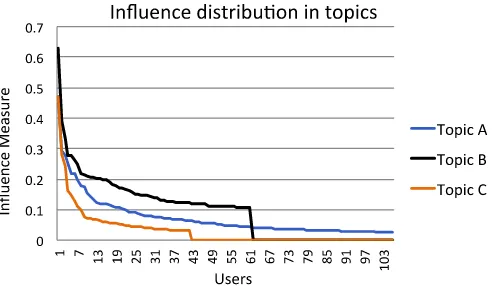
Figure 5: User's influence measure for three sample topics
The user tweets gathered from their timelines, belong to the identified topics with a probability. We set the probability threshold to 0.1 to consider whether a tweet belongs to a topic. Each tweet is mapped to at least one topic. Now that for each topic we have a collection of related tweets with their mention and retweet lists, we can measure user influence for them. In Section 4.1, we defined influence based on 4 measures; follower strength, activity, engagement, and network centrality. Follower strength will be taken from the number of users follow the user ui on Twitter. Activity represents the number of tweets user ui has in topic tj. Engagement is the sum of number of mentions and retweets for all of user ui’s tweets in topic tj. For measuring network centrality, we build the retweet graph for each topic separately from the corresponding retweet list and measure centrality of that user node through PageRank algorithm. Table 2 shows a small sample of the 4 calculated measures of topic-user influence. The zero scores mean that user ui did not have any tweet for that corresponding topic. The non-zero scores are normalized to lie in the range of [0,1] and higher score means higher influence for that topic. The measured influence scores are aggregated and a sample of aggregated scores is shown in Table 3.
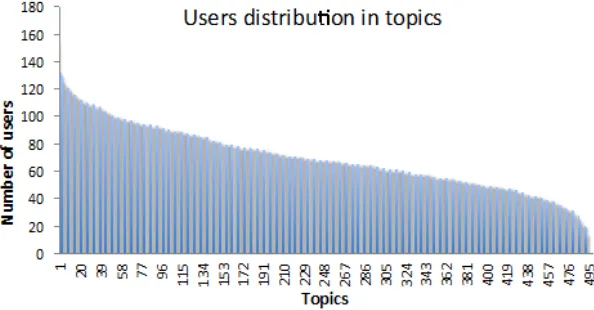
Average percentage of users active in topics 13.8%
Average of influence measures of active users in topics 0.125 Average of influence measures of all users in each topic 0.015 Percentage of users have influence of greater than 0.1 in topics 6% Percentage of users have influence of greater than 0.2 in topics 1.4% Table 4: Statistical information on users, topics, and influence measures
Users are not active on all topics. Some topics can be more popular with more active users and some topics can be less popular with less number of active users in social networks. We observed that the top 5% of most popular topic have 23% of active users in average. The percentage of active users for least 5% popular topics was just 4%. Figure 4 shows the distribution of users in the topics sorted based on the number of active users in the topics. A user is active in a topic if has engaged in a topic by posting about it.
Screen Name F Screen Name F Screen Name F Screen Name F
kdnuggets 0.63 randal_olson 0.62 analyticbridge 0.70 analyticbridge 0.57 analyticbridge 0.49 analyticbridge 0.55 randal_olson 0.49 ML_toparticles 0.55 deeplearning4j 0.33 jmgomez 0.53 DataScienceCtrl 0.41 DataScienceCtrl 0.37 KirkDBorne 0.31 IBMbigdata 0.51 BernardMarr 0.35 IBMbigdata 0.24 DataScienceCtrl 0.31 kdnuggets 0.49 eddelbuettel 0.34 kdnuggets 0.21
Table 5: A sample of topics and their 5 top influencers measured by our proposed topic-based influence measurement system.
Screen Name F Screen Name F Screen Name F Screen Name F
jmgomez 0.51 kdnuggets 0.93 analyticbridge 0.58 kdnuggets 0.62 randal_olson 0.48 KirkDBorne 0.43 kdnuggets 0.56 analyticbridge 0.54 analyticbridge 0.45 smolix 0.34 mjcavaretta 0.47 randal_olson 0.47 stanfordnlp 0.43 mapr 0.32 CharlieDataMine 0.44 DataScienceCtrl 0.36 bigdata 0.36 mjcavaretta 0.30 jure 0.35 paulblaser 0.36
Table 6: Table 4 continued- A sample of topics and their 5 top influencers measured by our proposed topic-based influence measurement system.
Screen Name F Screen Name F Screen Name F Screen Name F
xamat 0.70 analyticbridge 0.69 analyticbridge 0.58 analyticbridge 0.90 analyticbridge 0.54 mapr 0.60 randal_olson 0.55 DataScienceCtrl 0.45 kdnuggets 0.40 BernardMarr 0.58 IBMbigdata 0.36 hmason 0.42 jmgomez 0.36 odbmsorg 0.56 OracleAnalytics 0.32 KirkDBorne 0.35 KirkDBorne 0.32 infochimps 0.53 MarkLogic 0.30 paulblaser 0.31
Table 7: Table 5 continued- A sample of topics and their 5 top influencers measured by our proposed topic-based influence measurement system.
Tables 4, 5, and 6 show the top 5 influencers for selected topics. The sample of topics presented in the tables contain machine learning topics such as Neural Networks, Deep Learning, Big Data, Social Networks, Text Mining, NLP, Database, Visualization, and more specific topics such as Hadoop. For the task of validation of the influence results, there is no standard method in the literature to validate the algorithm output. One of the reasons we have chosen the machine learning and data science community on Twitter as our community of study was the wide availability of experts in the domain that allows us to verify the identified influential users through our algorithm. We manually verify the top topic-based influential users through expert opinions, their Twitter, and Google scholar accounts. For example, for the topic NLP, Stanford NLP group appeared in the top 5 influential accounts on Twitter. For “Recommender Systems” topic, Xavier Amatriain, who is known for his works on recommender systems, received a high influence score. Also, for the topic “Neural Networks”, Alex Smola was in the top 5 influencers who have extensively published on neural network topic. In the topic “Social Networks”, Jure Leskovec, who is well-known in the social networks community, was among the top influencers.
5.3
Implications and Applications
This section describes the real-world implication and applications of our model. Identifying topic-based influential users is similar to the problem of finding experts and authorities. Spotting the elite group of users for topics can improve available systems such as search engines. The query result for both contents and users can be returned and ranked using the score provided by our system.
One of the main applications of this work is in Marketing. Marketing campaigns can be implemented through the influential users in the related topic to have more productive and cost effective campaign. Influential users act as hubs in the network and have a central position in the network in terms of information diffusion, also they attract and engage more users into their conversations.
result, there wouldn’t be a need for manually defining the topics and consequently the recent and new topic would not be missed. TSIM, also can be applied to detect topics at what period get viral and who are influential in those topic in different period of time.
6
Conclusions
In this study, we have presented an approach, TSIM, to measure topic-based user influence in social networks. We have identified topics from user posts on social networks, and measured each user’s influence on each topic. TSIM is then used to calculate user influence for the observed topics. Our main contributions include:
The proposal of a effective method to measure topic-based influence for social network users
Opening a new discussion for user influence prediction in social networks that has not been explored in the literature.
Finally, we have tested TSIM using a unique dataset that we collected from Twitter, which we are making it available online.
In future work, we are interested to measure topic-based user influence over time, and study how influence changes over time. Prediction of user influence on unobserved topics is also currently under our investigation. We will also investigate other methods to combine influence measures.
References
Arasu, A., J. Novak, A. Tomkins and J. Tomlin (2002). PageRank computation and the structure of the web: Experiments and algorithms. Proceedings of the Eleventh
International World Wide Web Conference, Poster Track.
Barbieri, N., F. Bonchi and G. Manco (2013). "Topic-aware social influence propagation models." Knowledge and Information Systems 37(3): 555-584.
Blei, D. M., A. Y. Ng and M. I. Jordan (2003). "Latent dirichlet allocation." The Journal of
Machine Learning Research 3: 993-1022.
Cano, A. E., S. Mazumdar and F. Ciravegna (2014). "Social influence analysis in microblogging platforms–a topic-sensitive based approach." Semantic Web 5(5): 357-372.
Cataldi, M. and M.-A. Aufaure (2014). "The 10 million follower fallacy: audience size does not prove domain-influence on Twitter." Knowledge and Information Systems 44(3): 559-580.
Eccleston, D. and L. Griseri (2008). "How does Web 2.0 stretch traditional influencing patterns." International Journal of Market Research 50(5): 591-161.
Eirinaki, M., S. P. S. Monga and S. Sundaram (2012). "Identification of influential social networkers." International Journal of Web Based Communities 8(2): 136-158.
Embar, V. R., I. Bhattacharya, V. Pandit and R. Vaculin (2015). Online Topic-based Social Influence Analysis for the Wimbledon Championships. Proceedings of the 21th ACM
SIGKDD International Conference on Knowledge Discovery and Data Mining. Sydney,
NSW, Australia, ACM: 1759-1768.
Hajian, B. and T. White (2011). Modelling influence in a social network: Metrics and evaluation. Privacy, Security, Risk and Trust (PASSAT) 2011 IEEE Third Inernational
Conference on Social Computing (SocialCom), 2011 IEEE Third International
Conference on, IEEE.
Hamzehei, A., S. Jiang, D. Koutra, R. Wong and F. Chen (2016). TSIM: Topic-based Social Influence Measurement for Social Networks. Proceedings of The 14th Australasian Data
Haveliwala, T. H. (2002). Topic-sensitive PageRank. Proceedings of the 11th international
conference on World Wide Web. Honolulu, Hawaii, USA, ACM: 517-526.
Hu, J., Y. Fang and A. Godavarthy (2013). Topical authority propagation on microblogs.
Proceedings of the 22nd ACM international conference on Conference on information & knowledge management, ACM.
Jabeur, L. B., L. Tamine and M. Boughanem (2012). Active microbloggers: identifying influencers, leaders and discussers in microblogging networks. String Processing and
Information Retrieval, Springer.
Jin, X. and Y. Wang (2013). "Research on social network structure and public opinions dissemination of micro-blog based on complex network analysis." Journal of Networks 8(7): 1543-1550.
Kardara, M., G. Papadakis, A. Papaoikonomou, K. Tserpes and T. Varvarigou (2015). "Large-scale evaluation framework for local influence theories in Twitter." Information
Processing & Management 51(1): 226-252.
Katsimpras, G., D. Vogiatzis and G. Paliouras (2015). Determining Influential Users with Supervised Random Walks. Proceedings of the 24th International Conference on World
Wide Web. Florence, Italy, ACM: 787-792.
Katz, E. (1957). "The two-step flow of communication: An up-to-date report on an hypothesis."
Public opinion quarterly 21(1): 61-78.
Katz, E. and P. F. Lazarsfeld (1955). Personal Influence, The part played by people in the flow
of mass communications, Transaction Publishers.
Kleinberg, J. M. (1999). "Authoritative sources in a hyperlinked environment." J. ACM 46(5): 604-632.
Kong, S. and L. Feng (2011). A tweet-centric approach for topic-specific author ranking in micro-blog. Advanced Data Mining and Applications, Springer: 138-151.
Kwak, H., C. Lee, H. Park and S. Moon (2010). What is Twitter, a social network or a news media? Proceedings of the 19th international conference on World wide web, ACM. Libai, B., R. Bolton, M. S. Bügel, K. De Ruyter, O. Götz, H. Risselada and A. T. Stephen (2010).
"Customer-to-customer interactions: broadening the scope of word of mouth research."
Journal of Service Research 13(3): 267-282.
Liu, X., H. Shen, F. Ma and W. Liang (2014). Topical Influential User Analysis with Relationship Strength Estimation in Twitter. IEEE International Conference on Data
Mining Workshop (ICDMW), 2014.
McNeill, A. R. and P. Briggs (2014). Understanding Twitter influence in the health domain: a social-psychological contribution. Proceedings of the 23rd International Conference on
World Wide Web. Seoul, Korea, ACM: 673-678.
Montangero, M. and M. Furini (2015). TRank: ranking Twitter users according to specific topics. 12th Annual IEEE Consumer Communications and Networking Conference
(CCNC), 2015, IEEE.
Pal, A. and S. Counts (2011). Identifying topical authorities in microblogs. Proceedings of the
fourth ACM international conference on Web search and data mining. Hong Kong,
China, ACM: 45-54.
Probst, F., L. Grosswiele and R. Pfleger (2013). "Who will lead and who will follow: Identifying Influential Users in Online Social Networks." Business & Information Systems
Engineering 5(3): 179-193.
Romero, D. M., W. Galuba, S. Asur and B. A. Huberman (2011). Influence and Passivity in Social Media. Machine Learning and Knowledge Discovery in Databases: European
Conference, ECML PKDD 2011, Athens, Greece, September 5-9, 2011, Proceedings, Part
III. D. Gunopulos, T. Hofmann, D. Malerba and M. Vazirgiannis. Berlin, Heidelberg, Springer Berlin Heidelberg: 18-33.
Sung, J., S. Moon and J.-G. Lee (2013). The Influence in Twitter: Are They Really Influenced?
Behavior and Social Computing, Springer: 95-105.
Welch, M. J., U. Schonfeld, D. He and J. Cho (2011). Topical semantics of twitter links.
Proceedings of the fourth ACM international conference on Web search and data mining. Hong Kong, China, ACM: 327-336.
Weng, J., E.-P. Lim, J. Jiang and Q. He (2010). TwitterRank: finding topic-sensitive influential twitterers. Proceedings of the third ACM international conference on Web search and
data mining. New York, New York, USA, ACM: 261-270.
Xiao, F., T. Noro and T. Tokuda (2014). "Finding news-topic oriented influential twitter users based on topic related hashtag community detection." J. Web Eng. 13(5-6): 405-429.