1)Spectroscopy Diagnostic Division, Institute for Plasma Research, Gandhinagar, Bhat-382428, Gujarat, India 2)National Institute for Fusion Science, Toki, Gifu 509-5292, Japan
(Received 24 February 2019/Accepted 16 May 2019)
The present study is an analysis between radial emissivity profiles of the 650.024 nm transition of the O4+ion obtained using two separate Photon Emissivity Coefficient (PEC) databases. Emissivity values of the 650.024 nm O4+transition in visible-spectral region have been experimentally obtained for the Aditya tokamak. The radial number density distributions of different charge states of oxygen are estimated using a semi-implicit numerical method applied over the radial impurity transport equation. The 650.024 nm emissivity is calculated using the obtained impurity number density and with PECs from two separate databases namely the ADAS (Atomic Data and Analysis Structure) and the NIFS (National Institute for Fusion Science) database. Although impurity diff u-sivity profiles must not be dependent upon the choice of PEC databases; yet a requirement of separate impurity (oxygen) diffusivity profiles for the two PEC databases is observed, such that their corresponding calculated O4+ emissivities best depict the experimental emissivity data. A difference in the ionization and recombination rate coefficients provided in the ADAS and NIFS databases can lead to discrepancies in the impurity number densities calculated. The effects upon the impurity diffusivity while using ionization and recombination rate coefficients from two separate databases are further studied.
c
2019 The Japan Society of Plasma Science and Nuclear Fusion Research
Keywords: photon emissivity coefficient, ionization rate coefficient, recombination rate coefficient, ADAS database, NIFS database, semi-implicit numerical method, impurity transport, ADITYA tokamak DOI: 10.1585/pfr.14.1403155
1. Introduction
Impurity ions while travelling from the plasma periph-ery towards the core vperiph-ery often collide with the electrons, main ions and amongst themselves. The impurity ions during such collisions can undergo one of the three phe-nomena namely excitation, ionization/recombination and charge exchange based on the number density distribution of the colliding particles and the plasma temperature in the immediate region of collision. The ions, during any of the three processes, undergo a transition from its metastable state to ground state and in the process emit certain char-acteristic radiation. The radiations emitted are responsible for power loss and fuel dilution (in case of high Z impu-rities) in the plasma [1–4]. A given impurity distribution in tokamak is hence determined by means of spectrome-ters calibrated to measure its characteristic transition along several lines of sight such that the complete plasma cross-section is covered. Each signal obtained from the detectors is hence an integrated data over a given line of sight. The emissivity of the characteristic transition of an impurity ion
author’s e-mail: [email protected]
is determined by means of inversion algorithms over the measured data [5–7].
The present study is a comparison between the ex-perimental emissivity data and the calculated (simulated) emissivity values in the Aditya tokamak. The plasma in Aditya tokamak (minor radius ro = 0.25 m, major radius R = 0.75 m, toroidal magnetic field Bt = 0.75 T) at the Institute for Plasma Research Gandhinagar, India is hy-drogenic, confined within a graphite limiter and is circu-lar in cross-section [8]. Experiment has been conducted to study the Be-like O4+ion transport in Aditya tokamak using emissivity values of its characteristic 650.024 nm (2p3p3D3- 2p3d3F4) transition. The details of the experi-mental set-up used and the emissivity values obtained from the measured chord-integrated brightness using an Abel-like matrix inversion have been reported by M.B. Chowd-huriet al. [9]. The radial impurity transport equation for determining the impurity distribution in tokamak plasma is given as [10–13]:
c
2019 The Japan Society of Plasma
−ne(r) nz(r,t)αz(r). (1b) The terms nz, nz−1and nz+1represent the number den-sities (m−3) of Z, Z−1 and Z+1 impurity charge states respectively. The number density of electrons is repre-sented as ne(m−3). The terms Szand Sz
−1(m3/s) in Eq. (1b) are the ionization rate coefficients of Z and Z−1 charge states of an impurity species and parametersαzandαz+1 (m3/s) represent the recombination rate coefficients of im-purity ions with charge states Z and Z+1 respectively. The term r represents the plasma radius (m) and t represents the time (s). The initial condition for solving Eqs. (1a) - (1b) is given as:
nz|t=0 =0, for all r∈[0,r0]. (1c) The boundary conditions are given as:
a) dnz dr
r=r
o
=−nz
ld, for all 0≤t≤ts, (1d) b) dnz
dr
r=0=0, for all 0≤t≤ts. (1e) The term ldin Eq. (1d) represents the decay length (m) and the term ts in Eq. (1e) represents the time at which steady state is attained. The calculated emissivity pro-files are obtained by solving the radial impurity transport equation using a newly suggested semi-implicit numerical method [14] along with the Photon Emissivity Coefficients (PECs) from a given PEC database. The calculations in the present study have been performed in MATLABR
(The MathWorks Inc., Natick, MA, USA) using the High Per-formance Computing (HPC) facility [15] at the Indian In-stitute of Technology Kanpur, India. SI units have been followed throughout the study.
2. Theory
The detailed description of the semi-implicit numeri-cal method recently applied over the radial impurity trans-port equation has been retrans-ported by Bhattacharyaet al. [14]. The derivatives in the non-conservative formulation of the parabolic, coupled, radial impurity transport equation are primarily discretized by means of forward-differencing in time and central-difference scheme in space. The diff u-sivity terms after discretization and the ionization and re-combination terms of charge state Z in Qz (Eq. (1b)) are
− +
(Δr)2 + , ,kΔ + ,kαz,kΔ |k
+ Δt
Dk (Δr)2 −
Dk+1 4(Δr)2 +
Dk−1 4(Δr)2 −
Dk 2rkΔr
nz|jk+−11
= vk
2ΔrΔt nz| j k+1−
1+ Δt
vk−1 2Δr −
vk rk −
vk+1 2Δr
nz|jk − vk
2ΔrΔt nz| j
k−1−ne,knz−1| j
kSz−1,kΔt
−ne,knz+1|jkαz+1,kΔt. (2) The subscript k and superscript j in Eq. (2) represent the space and time iterations respectively. The suggested nu-merical scheme has been applied over the radial impurity transport equation in the region 0<r<ro. The boundary conditions given in Eqs. (1d) - (1e) are solved as described in Eqs. (3a) - (3c).
Equation (1d) for 0≤t≤tsat the plasma edge r=ro is solved using a 3 point upwind scheme as follows:
3nz|r=ro−4nz|r=ro−Δr+nz|r=ro−2Δr
2Δr =−
nz|r=ro
ld (3a)
⇒⎧⎪⎪⎪⎨⎪⎪⎪⎩nz|r=ro−
4
3+2lΔr
d
nz|r=ro−Δr
+ 1
3+2Δr ld
nz|r=ro−2Δr ⎫⎪⎪ ⎪⎬
⎪⎪⎪⎭=0. (3b)
Equation (1e) for 0≤t≤tsat the plasma centre (r=0) is solved as follows:
(nz|r=0−nz|r=Δr)=0. (3c)
The radial emissivity profiles (ph m−3s−1sr−1) [16,17] of a given impurity ion with charge state Z is obtained us-ing the equation:
Ez(r)=
ne(r) nz,g(r,t=ts) PECexcz (r)
+ne(r) nz+1,g(r,t=ts) PECrecz+1(r)
+nH(r) nz+1,g(r,t=ts) PECcxz+1(r)
4π . (4)
The charge state Z=1,2,3. . . ,8 for oxygen.
number density of hydrogen ion in Aditya plasma. The present study compares the O4+ emissivity profiles of its characteristic 650.024 nm (2p3p3D3- 2p3d3F4) transition in the visible spectral region with the experimental emis-sivity data. The experimental emisemis-sivity data in the out-board (low-magnetic field) region of Aditya tokamak is only considered. The Photon Emissivity Coefficients for the calculated emissivity profiles are obtained from two separate databases namely the ADAS (Atomic Data and Analysis Structure) and the NIFS (National Institute for Fusion Science) database. Emissions from O4+ions only
due to excitation are however considered in the present study based on the temperature profile of Aditya tokamak and absence of any neutral beam heating in the same. The first term only in Eq. (4) is hence considered.
3. Results and Discussions
Emissivity values of the characteristic 650.024 nm transition of O4+ ion in visible-spectral region, based on the experimental measurements in Aditya tokamak, are de-scribed in Table 1. Four of the radial points of measure-ment that lie between 0.50≥ρ≥0.95 (Region of Interest ROI-outboard) in Aditya plasma have been considered. Ta-ble 1 reports the experiment emissivity data Eexp,out, along with their lower and upper ordinate bounds. An uncer-tainty of maximum 15% associated with each experimen-tal data has been reported by Chowdhuriet al. [9]. The left and right abscissa bounds are considered asΔρ = ±0.07 (Δr=±0.0175 m) in the present study.
The Gaussian function EGauss shown in Eq. (5) has been generated to fit the experiment emissivity data which would best describe the trend of O4+(650.024 nm) emis-sivity at all radii in the outboard section of Aditya plasma.
EGauss(ρ)= EGauss,peak
1
2πσ2 1
exp
⎛
⎜⎜⎜⎜⎝−[ρ−0.690]2 2σ2
1
⎞
⎟⎟⎟⎟⎠. (5)
The terms EGauss,peak = 1.0E+17 ph m−3sr−1s−1 and
σ1 = 0.098 in Eq. (5). The EGauss profile has been ob-tained with mesh sizeΔr = 2E-03 m. The radial profiles
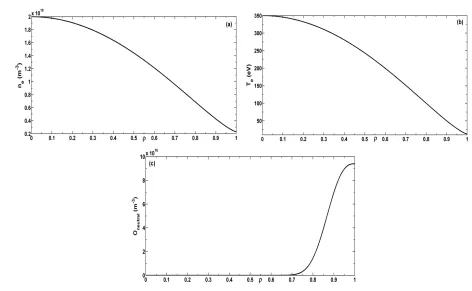
of the input parameters to the applied semi-implicit nu-merical method, namely number density of electron (ne), plasma temperature (Te) and the neutral oxygen number density (Oneutral) are shown in Figs. 1 (a) - (c) respectively. The ne, Te, and Oneutralprofiles in Figs. 1(a) - (c) have been modelled as:
Te(r)=Te,a+(Te,0−Te,a)
⎡ ⎢⎢⎢⎢⎢ ⎣1−
r ro 2⎤ ⎥⎥⎥⎥⎥ ⎦ a , (6a)
ne(r)=ne,a+(ne,0−ne,a) ⎡ ⎢⎢⎢⎢⎢ ⎣1−
r ro 2⎤ ⎥⎥⎥⎥⎥ ⎦ b , (6b)
O0(r)=O0,peakexp
⎡ ⎢⎢⎢⎢⎢ ⎢⎣−
⎛ ⎜⎜⎜⎜⎜ ⎝r2oπ−ror
γ ⎞ ⎟⎟⎟⎟⎟ ⎠
2.65⎤
⎥⎥⎥⎥⎥
⎥⎦. (6c)
The values of various terms used in Eqs. (6a) - (6b) are as follows: Te,0 = 350 eV, Te,a = 12.5 eV, ne,0 = 2.0E+ 19 m−3, n
Fig. 1 Profiles of (a) electron number density ne(m−3), (b) plasma temperature Te(eV), (c) neutral oxygen number density Oneutral(m−3)
with respect to normalized plasma radiusρ.
database [18] are interpolated based on the temperature and electron number density profile of the Aditya tokamak (Fig. 1).
The radial profile of impurity diffusion coefficient has been modelled as follows [19]:
If r>rm, D(r)=Da+(Dm−Da) exp
⎡
⎢⎢⎢⎢⎣−(r−rm)2 p2
1
⎤ ⎥⎥⎥⎥⎦
If r<rm, D(r)=D0+(Dm−D0) exp
⎡
⎢⎢⎢⎢⎣−(r−rm)2 p2
2
⎤ ⎥⎥⎥⎥⎦.
(6d) The values of various terms in Eq. (6d) are as follows: ro = rLCFS = 0.25 m; D0 = 3.0 m2/s; Dm = 31.0 m2/s; Da = 52.0 m2/s; p1 = 6.0E-02 m; p2 = 2.0E-02 m; pm = 0.605 and rm = pm ×rLCFS = 0.1513 m respec-tively. The radial profile of the diffusion coefficient, with the values of all its terms in Eq. (6d), is considered to be same for all oxygen ions while computing their number densities using the semi-implicit radial impurity transport equation. The impurity diffusion coefficients in classical and Pfirsch-Schlüter regimes of neo-classical transport do not depend on the impurity charge state Z [13] when the main ion collisionality is low. The impurity diffusion coef-ficient in the Banana-Plateau regime of neo-classical the-ory is predicted to be a weak function of the impurity collisionality and a decreasing function of the impurity charge state Z [20]. Further, the turbulent diffusion coef-ficient corresponding to the random walk of every parti-cle about the fluctuating potential, with the→−E ×→−B drift
velocity −→VE = − →
E×→−B
B2 , is found to be independent of the
particle charge state Z [21, 22]. Furthermore, experimen-tal studies of the Z dependency of the impurity diffusion coefficients are found to be varying from machine to ma-chine. A weak dependence on the impurity charge states is reported in the Large Helical Device (LHD) [23] whereas in ASDEX-U tokamak, it is found to be following the Z dependence as predicted neo-classically in Banana-Plateau regime [24]. The impurity diffusion coefficients driven by turbulence transport is mostly anomalous in nature and the parametric dependence on the impurity mass and charge is yet to be fully established, both theoretically and ex-perimentally. Considering all of these facts, for relatively low density and low temperature plasma of Aditya toka-mak, the assumption of Z independence of diffusion co-efficient is fairly reasonable for number density calcula-tions of different charge stages of oxygen. A radially con-stant value of the convective velocity v = 0.001 m/s has been considered that is assumed to remain same for all oxygen ions. The number density profiles of the oxygen ions using the aforementioned semi-implicit method are obtained with a mesh sizeΔr = 2E-03 m and time step
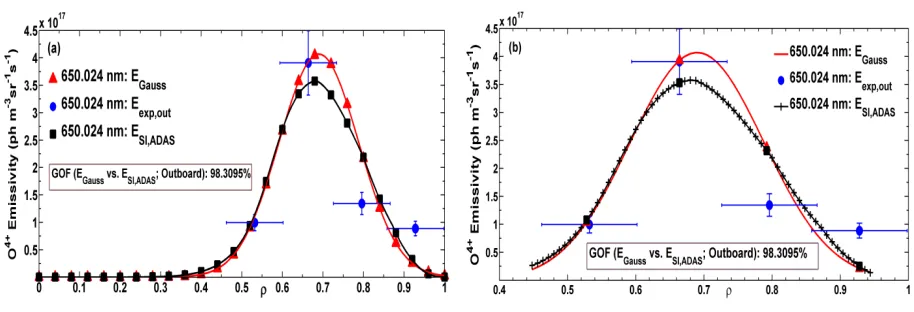
Fig. 2 Experimental emissivity data, Gaussian emissivity model and the calculated (semi-implicit) emissivity for (a) outboard section, (b) ROI-outboard of Aditya plasma with respect to normalized radiusρfor 650.024 nm transition of O4+ion with PECs from the
ADAS database.
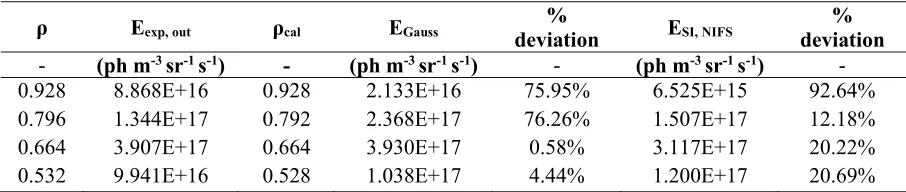
Table 2 Comparison between the experimental, modelled (Gaussian) and calculated (semi-implicit) emissivity of O4+ion (650.024 nm
transition) with PEC-ADAS at four radial points of measurement in the outboard section of Aditya plasma.
radial diffusion coefficient profile (Eq. (6d)) were varied it-eratively to obtain the best match between the simulated (Eqs. (2) and (4)) and Gaussian (Eq. (5)) emissivity pro-files and the experimentally measured O4+ (650.024 nm) emissivity data in Aditya tokamak. The impurity diff u-sion coefficient and impurity concentration corresponding to the ‘best-fit’ simulated (semi-implicit transport equa-tion) 650.024 nm O4+emissivity profiles are treated as the outcome of the modelling, used for understanding the oxy-gen transport in Aditya tokamak.
Figures 2 (a), (b) describe the experimental data Eexp,out, the modelled Gaussian emissivity profile EGauss and the calculated (semi-implicit) emissivity profile ESI,ADASof the 650.024 nm transition of O4+ion. The fig-ures show the ‘Goodness of Fit’ between the EGauss and ESI,ADAS profile is 98.31% thereby attesting that the two profiles are in ‘good agreement’ with each other and with the experimental data as further enunciated in Table 2.
Table 2 compares these O4+(650.024 nm) emissivity values at the four radial (ρ) points of experimental mea-surement. The termρcal in Table 2 represents the normal-ized radius (closest to the experimentalρ) with mesh size
Δr=0.002 m corresponding to which EGaussand ESI,ADAS have been reported in the table. The % deviation reported in Table 2 is the deviation of EGaussor ESI,ADASemissivities
Fig. 3 The impurity diffusion coefficient D (m2/s) with respect
to normalized plasma radiusρcorresponding to the ‘best-fit’ calculated 650.024 nm emissivity profile with O4+
(simulated) number density and PEC-ADAS in Aditya tokamak.
Fig. 4 (a) Photon Emissivity Coefficients (PEC) (650.024 nm excitation line) of ADAS and NIFS database with respect to normalized plasma radiusρ, (b) Experimental, Gaussian and Calculated O4+emissivity (with PEC-ADAS and PEC-NIFS) of the 650.024 nm
excitation line with respect toρwith no change in D profile.
Table 3 Comparison between the experimental, modelled (Gaussian) and calculated (semi-implicit) emissivity of O4+ion (650.024 nm
transition) with PEC-NIFS at four radial points of measurement in the outboard section of Aditya plasma (w/o change in D).
for the outboard section of Aditya plasma by Chowdhuriet al. [9].
3.1
Comparison between the 650.024 nm
O
4+emissivity obtained using two
sepa-rate PEC databases
A second Photon Emissivity Coefficient (PEC) database used for determining the O4+ emissivity profile (650.024 nm) is the database from the National Institute for Fusion Science (NIFS), Japan. Figure 4 (a) shows a comparison between the Photon Emissivity Coefficient (PEC) profiles, for the 650.024 nm transition of O4+ion, corresponding to the ADAS [25] and NIFS database. Fig-ure 4 (b) describes the experimental data Eexp,out, the mod-elled Gaussian emissivity profile EGauss, the calculated (semi-implicit) emissivity profile ESI,ADASusing the PEC-ADAS database and the calculated (semi-implicit) emis-sivity profile ESI,NIFS using the PEC-NIFS database re-spectively for the 650.024 nm transition of O4+ion. The O4+number density while calculating E
SI,NIFSin Fig. 4 (b) is the same as used for calculating ESI,ADAS and only the PECs differ (Eq. (4)) while calculating the two emissivi-ties. Figure 4 (b) shows the ‘Goodness of Fit’ between the Gaussian and the calculated emissivity profile using the PEC-NIFS is 89.28%.
Table 3 shows the experimental, Gaussian and calcu-lated emissivity values using PEC-NIFS at the four radial points of measurement in the outboard section of Aditya plasma. The ESI,NIFSprofile in Fig. 4 (b) along with its % deviation with respect to the experimental emissivity data in Table 3 shows the need for a different number density profile of O4+ion based on which, using Eq. (4), a
calcu-lated emissivity profile using PEC-NIFS must be obtained that matches well with the Gaussian profile as well as with the experimental emissivity data.
A separate impurity diffusion coefficient profile shown in Fig. 5 (a), different from the ones applied in case of PEC-ADAS, is used for computing the required O4+ number density using the semi-implicit numerical method in case of the PEC-NIFS database (650.024 nm excitation transition). The input parameters to the applied semi-implicit numerical method, except the impurity diffusion coefficient profile, all remain same while calculating the number density of oxygen ions using the semi-implicit nu-merical method. The radial impurity transport equation us-ing the semi-implicit method is solved with the mesh size
Δr=2E-03 m and time stepΔt=7.5E-09 s.
im-Fig. 5 (a) Separate profiles of impurity diffusivity D (m2/s) with respect to normalized plasma radiusρcorresponding to the ADAS and
NIFS database, (b) Experimental, Gaussian and Calculated emissivity (with PEC-NIFS) of the 650.024 nm excitation line with respect toρbased on the change in D profile.
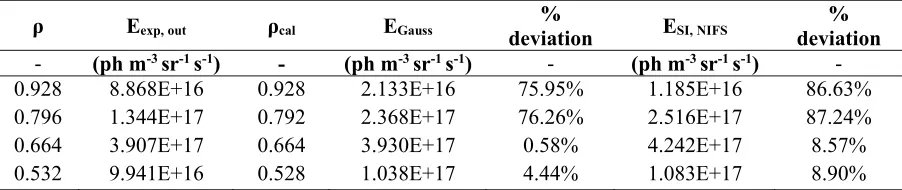
Table 4 Comparison between the experimental, modelled (Gaussian) and calculated (semi-implicit) emissivity of O4+ion (650.024 nm
transition) with PEC-NIFS at four radial points of measurement in the outboard section of Aditya plasma (with change in D).
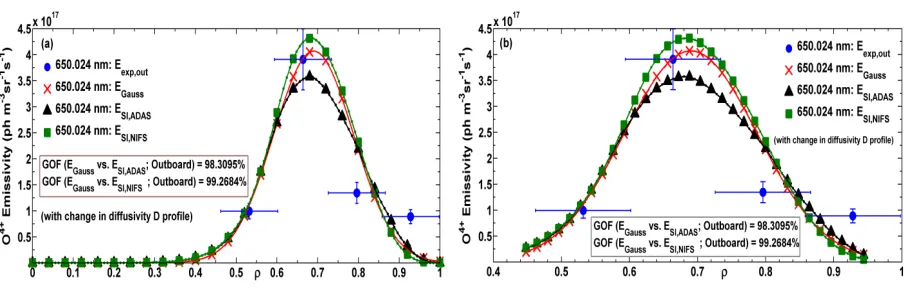
purity diffusivity, corresponding to PEC-NIFS, is deter-mined using Eq. (6d) as well. The values of various terms in Eq. (6d) for the separate diffusivity are ro = rLCFS = 0.25 m; D0 =3.0 m2/s; Dm =16.5 m2/s; Da =43.0 m2/s; p1 = 6.2E-02 m; p2 = 2.05E-02 m; pm = 0.645 and rm = pm×rLCFS =0.1613 m respectively. A comparison between the two diffusivity profiles in Fig. 5 (a) shows the trend of both profiles remain similar i.e. an increase in im-purity diffusivity from the plasma core towards the edge is observed. The magnitude of the impurity diffusivity from the mid-plasma region till the edge is however lesser among the two in case of the PEC-NIFS database. The values of pmin the two profiles i.e. pm,ADAS =0.605 and pm,NIFS =0.645 further suggests the step (mid) region of the diffusivity profile is more inclined towards the plasma edge in case of DPEC-NIFS. The O4+(650.024 nm) emissiv-ity profile calculated using the O4+number density, with a separate impurity diffusivity profile in case of PEC-NIFS database, is shown in Fig. 5 (b). The ‘Goodness of Fit’ be-tween the calculated (PEC-NIFS) and the Gaussian emis-sivity is obtained as 99.27% in such case. The two emissiv-ity profiles are hence found to be in good agreement with each other. Table 4 compares the O4+(650.024 nm) emis-sivity, calculated using the separately obtained O4+number density from the semi-implicit method and PECs from the NIFS database, with emissivity values from the Gaussian
model and the experimental emissivity data (outboard) at the four radial points of measurement.
Figures 6 (a), (b) summarizes the O4+emissivity pro-files of the 650.024 nm transition obtained through exper-iment, Gaussian model and calculated emissivities in case of PEC-ADAS and PEC-NIFS database, with separate dif-fusivity profiles in the two cases of emissivities numeri-cally calculated. Table 5 further describes the emissivity values at the four radial points of measurement in the out-board section of Aditya plasma.
Fig. 6 Experimental emissivity data, Gaussian emissivity model and the calculated (semi-implicit) emissivity with ADAS and PEC-NIFS for (a) outboard section, (b) ROI-outboard of Aditya plasma with respect to normalized radiusρfor 650.024 nm transition of O4+ion with PECs from the ADAS database.
Table 5 Comparison between the experimental, calculated (semi-implicit) emissivity with PEC-ADAS and calculated (semi-implicit) emissivity with PEC-NIFS of O4+ion (650.024 nm transition) at four radial points of measurement in the outboard section of
Aditya plasma (with change in D).
pointing towards the need for a separate diffusivity pro-file. The difference in the PEC coefficient profiles shown in Fig. 4 (a) is due to a difference in the atomic and molecu-lar processes considered while calculating the coefficients in the two databases. The direct transition from the ground state to the upper level in case of 650.024 nm excitation transition is forbidden and the excitation pass consists of two separate transitions. The excitation rate coefficients determining the PECs are different for the ADAS (CR model) and NIFS database based on the two different mod-els applied in either case. A further study regarding the atomic processes considered while calculating the PEC co-efficients in NIFS database is hence required.
3.2
Study of the ionization and
recombi-nation rate coe
ffi
cients provided in the
ADAS and NIFS database and the
ef-fect of their di
ff
erence over the impurity
number density
The emissivity due to a characteristic transition of an impurity ion is dependent upon its number density distri-bution in the plasma studied (Eq. (4)). The number den-sity distribution of a given impurity species obtained is de-pendent upon the ionization and recombination rate coef-ficients of the ions with charge state Z, Z−1 and Z+1
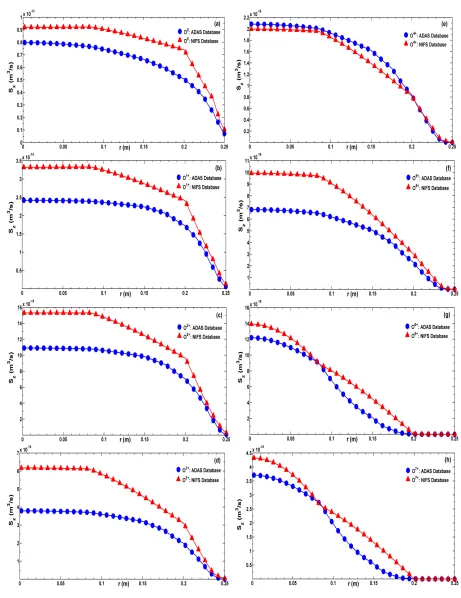
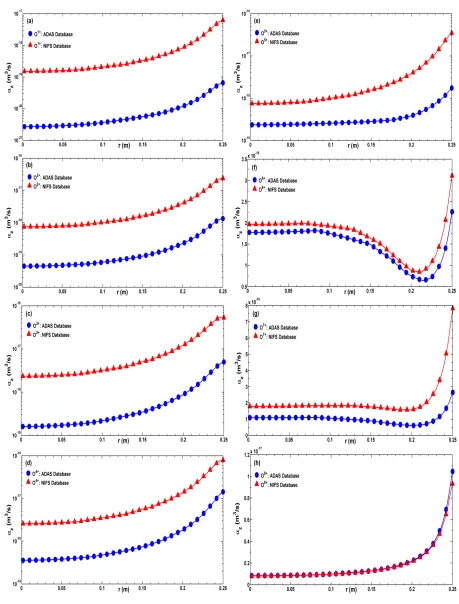
respectively as described in Eq. (1b). A further study of the ionization and recombination rate coefficients of the oxygen ions (O1+to O8+) provided in the ADAS and NIFS database [26] is conducted based on the electron number density and plasma temperature profiles in the Aditya toka-mak (Figs. 1 (a), (b)). Figures 7 (a) - (h) show the ioniza-tion rate coefficients of the oxygen ion obtained from the two databases using the Aditya plasma parameters. Fig-ures 8 (a) - (h) show the recombination rate coefficients of the oxygen ion obtained from the two databases using the Aditya plasma parameters. The figures show a difference in the ionization and recombination rate coefficients ob-tained from the two databases that evidently effects the number density distribution of the oxygen ions while solv-ing the radial impurity transport equation ussolv-ing the semi-implicit numerical method. Figures 9 (a) - (h) describe the difference in the number density distribution of oxygen ions as an effect of using the ionization (ion.) rate coef-ficient and recombination (rec.) rate coefficient data from the two separate databases.
Fig. 7 Ionization Rate Coefficients Sz(m3/s) of (a) O0, (b) O1+, (c) O2+, (d) O3+, (e) O4+, (f) O5+, (g) O6+, (h) O7+ion with respect to
radius r (m) from the ADAS and NIFS databases for the plasma parameters of Aditya tokamak.
of the NIFS (ION./REC.) data are Δr = 2E-03 m and
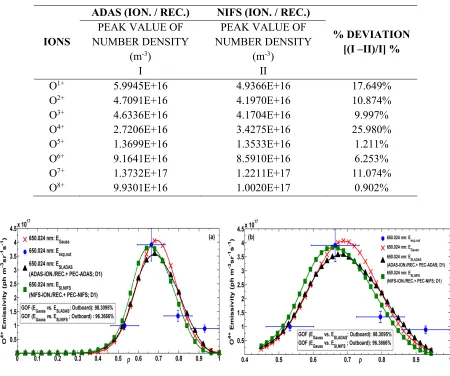
Δt = 1.25E-08 s respectively. Table 6 further describes the % deviation in the peak value of the number densities of oxygen ions on using two separate databases of ioniza-tion and recombinaioniza-tion rate coefficients namely the ADAS
Fig. 8 Recombination Rate Coefficientsαz(m3/s) of (a) O1+, (b) O2+, (c) O3+, (d) O4+, (e) O5+, (f) O6+, (g) O7+, (h) O8+ion with respect
to radius r (m) from the ADAS and NIFS databases for the plasma parameters of Aditya tokamak.
affect the number density distribution of oxygen ions for the plasma parameters of the Aditya tokamak.
The number density profiles of O4+ ion shown in Fig. 9 (d) are further used, along with PECs from the
emis-Fig. 9 Number density distribution (m−3) of (a) O1+, (b) O2+, (c) O3+, (d) O4+, (e) O5+, (f) O6+, (g) O7+, (h) O8+ion with respect to radius
r (m) using ionization Sz(m3/s) and recombinationαz(m3/s) rate coefficients from the ADAS and NIFS databases and with same
diffusivity D (m2/s) profile for the two (ion./rec.) databases.
sivity profile, the calculated (semi-implicit) emissivities obtained using the O4+ number density profiles shown in Fig. 9 (d) and the PECs shown in Fig. 4 (a).
The ‘Goodness of Fit’ between the calculated
experimen-Fig. 10 Experimental emissivity, Gaussian emissivity and Calculated (semi-implicit) emissivities with ADAS (ION./REC.) and PEC-ADAS and with NIFS (ION./REC.) and PEC-NIFS for (a) outboard section, (b) ROI-outboard with respect to normalized radius
ρfor 650.024 nm transition of O4+ion (D profile: D1).
Table 7 Comparison between the experimental, modelled (Gaussian) and calculated (semi-implicit; with NIFS ION./REC. data and PEC-NIFS) emissivities of O4+ion (650.024 nm transition) at four radial points of measurement in Aditya plasma (with D profile: D1).
tal emissivity values and the Gaussian and calculated O4+ emissivities at the four radial points of measurement in the outboard section of Aditya plasma.
Although the calculated emissivity profile, generated with number density from the NIFS ION./REC. data and
Fig. 11 Diffusivity D (m2/s) profiles of impurity ion with respect to normalized plasma radiusρfor (a) ADAS ION./REC. data with
PEC-ADAS and NIFS ION./REC. data with PEC-NIFS cases, (b) ADAS ION./REC. data with PEC-ADAS, ADAS ION./REC. data with PEC-NIFS and NIFS ION./REC. data with PEC-NIFS cases.
data is necessary. A separate impurity diffusivity profile is hence generated using Eq. (6d) where the values of various terms are as follows: ro =rLCFS =0.25 m; D0 =3.0 m2/s; Dm =16.0 m2/s; Da = 50.0 m2/s; p1 = 6.0E-02 m; p2 = 2.0E-02 m; pm =0.647 and rm =pm×rLCFS =0.1618 m respectively. The newly generated diffusivity profile is rep-resented as D3 in Figs. 11 (a), (b) respectively.
Figure 11 (b) shows a comparison between the diff u-sivity profiles used in three separate cases considered in present study. The profile D1 represents the impurity dif-fusivity values used for calculating the oxygen ion num-ber densities when the ionization and recombination rate coefficients from the ADAS database has been used and the emissivity profile due to 650.024 nm transition is de-termined using the PECs from ADAS database (Fig. 3). The profile D2 represents the impurity diffusivity values used for calculating the oxygen ion number densities when the ionization and recombination rate coefficients from the ADAS database has been used and the emissivity pro-file due to 650.024 nm transition is determined using the PECs from NIFS database (Fig. 5 (a)). The third profile D3 represents the impurity diffusivity values used for cal-culating the oxygen ion number densities when the ion-ization and recombination rate coefficients from the NIFS database has been used and the emissivity profile due to 650.024 nm transition is determined using the PECs from NIFS database.
Figures 12 (a) - (h) describe the number density dis-tribution of oxygen ions when the ionization rate coef-ficient and recombination rate coefficient data from the two separate (ADAS and NIFS) databases are used. The diffusivity profile of oxygen ions used in case of ADAS (ION./REC.) database is D1 and corresponding to NIFS (ION./REC.) database is D3. The mesh size and time step used for the semi-implicit numerical method in case of NIFS (ION./REC.) data with D3 profile areΔr=2E-03 m andΔt=1.25E-08 s respectively. Table 8 further describes the % deviation in the peak value of the number densities of oxygen ions shown in Figs. 12 (a) - (h) respectively. A
major change in the number densities of the oxygen ions with change in the impurity diffusivity profile from D1 to D3 is observed from the % deviation in Table 8.
The emissivity profile (650.024 nm) using the O4+ NIFS (ION./ REC.) number density shown in Fig. 12 (d) along with the PECs from the NIFS database (Fig. 4 (a)) is shown in Figs. 13 (a), (b). The ‘Goodness of Fit’ between the calculated (ION./REC.+PEC) NIFS emissivity and the Gaussian emissivity is obtained as 99.71% in present study. Table 9 compares between the experimental emissiv-ity values and the modelled (Gaussian) and calculated O4+ (650.024 nm) emissivities at four radial points of measure-ment in the outboard section of Aditya plasma for the present case (D3). The % deviation between ESI,NIFSand Eexp,outin Table 9 show the emissivities are in good agree-ment with each other.
The following comparisons can be drawn based on the aforementioned observations:
1. A comparison between Figs. 9 (a) (h) and 12 (a) -(h) and between Figs. 10 (a) and 13 (a) show that al-though a change in the ionization and recombination database does not affect the number density profiles of the oxygen ions; yet the O4+ (650.024 nm) NIFS emissivity profile in Fig. 10 (a) do not satisfactorily match with the experimental emissivity data. The O4+NIFS (ION./REC.+PEC) emissivity profiles are in better agreement with experimental emissivity data (Fig. 13 (a)) when a separate impurity diffusivity pro-file (D3) is considered. The use of D3 as impurity diffusivity profile however leads to a significant dif-ference in the number density profiles of oxygen ions (Fig. 12).
to-Fig. 12 Number density distribution (m−3) of (a) O1+, (b) O2+, (c) O3+, (d) O4+, (e) O5+, (f) O6+, (g) O7+, (h) O8+ion with respect to
radius r (m) using ionization Sz(m3/s) and recombinationαz(m3/s) rate coefficients from the ADAS and NIFS databases and
with separate diffusivity D (m2/s) profiles for the two (ion./rec.) databases.
wards the plasma edge. The two profiles are, how-ever, prominently different from the diffusivity profile D1 used to obtain O4+ emissivity in case of ADAS (ION./REC.) data with PEC-ADAS database.
Table 9 Comparison between experimental, modelled (Gaussian) and calculated (semi-implicit; with NIFS ION./REC. data and PEC-NIFS) emissivities of O4+ion (650.024 nm transition) at four radial points of measurement in Aditya plasma (with D3 profile).
Fig. 13 Experimental emissivity data, Gaussian emissivity model and Calculated (semi-implicit) emissivities with ADAS (ION./REC.) and PEC-ADAS and with NIFS (ION./REC.) and PEC-NIFS for (a) outboard section, (b) ROI-outboard with respect to normal-ized radiusρfor 650.024 nm transition of O4+ion (D profiles: D1 & D3).
further enunciate the impact of the change in PECs from ADAS to NIFS database is significant over the impurity diffusivity profile than the change in ionization and recom-bination rate coefficients from ADAS to NIFS database.
4. Summary
The chord-integrated brightness in the outboard
lated using the semi-implicit method applied is com-pared with the Gaussian emissivity model such that the ‘goodness of fit’ between them remains above 95%.
The O4+ emissivity is calculated using the Photon Emissivity Coefficients (PECs) from two separate databases namely the ADAS and NIFS database. The difference between the PEC coefficient profiles of the 650.024 nm O4+transition obtained from the ADAS and NIFS database is more extensive (in orders of 10) towards the plasma edge than towards the plasma cen-tre especially forρ≥0.6.
The excitation rate coefficients based on which the PECs of the 650.024 nm characteristic transition of the O4+ion are calculated are different for the ADAS and NIFS databases. A modification in the impurity diffusivity profile while using PEC-NIFS is required to match its calculated O4+ emissivity with experi-ment emissivity data in Aditya plasma.
A change in the ionization and recombination rate coefficients from the ADAS to NIFS database, de-rived based on the plasma parameters of Aditya toka-mak, keeping all input parameters to the semi-implicit numerical method same; does not affect the number density distribution of the oxygen ions in the Aditya plasma.
5. Conclusion
A change in ionization/recombination data from ADAS (ION./REC.) to NIFS (ION./REC.) does not have an impact of the same magnitude on the O4+ emissivity and therefore on the impurity transport coefficient (Diff u-sivity in the present study) as much as the change in PECs from PEC-ADAS to PEC-NIFS database has on the same. The Photon Emissivity Coefficients (PECs) of the ADAS and NIFS database differ based on the atomic and molec-ular processes considered while calculating them. Impu-rity accumulation towards the plasma core of a tokamak is a serious concern in thermonuclear fusion research. The knowledge of impurity diffusivities and their radial profiles is hence very important. The impurity diffusivities further provide, the much needed for identifying processes, re-sponsible in the impurity transport in tokamaks as classical
diffusivities obtained using NIFS database point out that either the resistive ballooning modes or the ion tempera-ture gradient modes seems to be responsible for the oxy-gen (impurity) transport. Although the existing databases provide the all-important data (atomic and molecular) that assists in gathering the required insights to the processes occurring inside the plasma; yet the present study sug-gests a possibility of iterations through the comparison of databases.
Acknowledgments
The authors would like to thank Dr. Suneet Singh, De-partment of Energy Science and Engineering, IIT Bombay, India for discussions and insights on the numerical meth-ods applied in the present study.
The authors would also like to thank S. Banerjee, Ritu Dey, R. Manchanda, Vinay Kumar, P. Vasu, K.M. Patel, P.K. Atrey, Y. Shankara Joisa, C.V.S. Rao, R.L. Tanna, D. Raju, P.K. Chattopadhyay, R. Jha, C.N. Gupta, S.B. Bhatt, Y.C. Saxena and the Aditya Team at the Institute for Plasma Research Gandhinagar for the experimental data that helped in the comparisons using results from the semi-implicit numerical method applied over the radial impurity transport equation.
The authors would finally like to thank the National Institute for Fusion Sciences (NIFS), Japan, for the Photon Emissivity Coefficients that has helped with the compar-isons in the present study.
[1] C. Breton, C. De Michelis and M. Mattioli, Nucl. Fusion
16 (6), 891 (1976).
[2] D. Post, J. Abdallah, R.E.H. Clark and N. Putvinskaya, Phys. Plasmas2, 2328 (1995).
[3] A. Kirschner, V. Philipps, J. Winter and U. Kögler, Nucl. Fusion40 (5), 989 (2000).
[4] P.C. Stangeby,The Plasma Boundary of Magnetic Fusion Devices(IOP Publishing Ltd., Bristol, 2000).
[5] I. Condrea, E. Haddad, B.C. Gregory and G. Abel, Phys. Plasmas7, 3641 (2000).
[6] J. Ghosh, R.C. Elton, H.R. Griem, A. Case, A.W. DeSilva, R.F. Ellis, A. Hassam, R. Lunsford and C. Teodorescu, Phys. Plasmas13, 022503 (2006).
[7] M. Goswami, P. Munshi, A. Saxena, M. Kumar and A. Ku-mar, Fusion Eng. Des.89(11), 2659 (2014).
[13] J. Wesson, Tokamaks, 3rd Edition (Clarendon Press, Ox-ford, 2004).
[14] A. Bhattacharya, P. Munshi, J. Ghosh and M.B. Chowdhuri, J. Fusion Energy37 (5), 211 (2018).
[15] 2019, HPC2013, ‘High Performance Computing system’, Indian Institute of Technology Kanpur, https://www.iitk.ac. in/ccnew/index.php/hpc (as on 05. 01. 2019).
[16] R. Dey, J. Ghosh, M.B. Chowdhuri, R. Manchanda, S. Banerjee, N. Ramaiya, D. Sharma, R. Srinivasan, D.P. Stotler and Aditya Team, Nucl. Fusion57, 086003 (2017). [17] TFR group, Association Euratom - CEA sur la fusion, Département de recherches sur la fusion controlée, Cen-tre d’études nucléaires, Fontenay-aux-Roses, France, Nucl.
(1981).
[23] H. Nozato, S. Morita, M. Goto, Y. Takase, A. Ejiri, T. Amano, K. Tanaka, S. Inagaki and LHD experimental group, Phys. Plasmas11(5), 1920 (2004).
[24] R. Dux, A.G. Peeters, A. Gude, A. Kallenbach, R. Neu and ASDEX Upgrade Team, Nucl. Fusion39(11), 1509 (1999). [25] 2019, ADAS Database, ‘Photon Emissivity Coefficients’,
http://open.adas.ac.uk/adf15 (as on 05.01.2019).