2367
Volume LXI 266 Number 7, 2013
http://dx.doi.org/10.11118/actaun201361072367
MEASURING QUARTERLY NET FIXED
CAPITAL STOCK IN THE CZECH REPUBLIC
Igor Krejčí, Kristýna Vltavská
Received: June 28, 2013
Abstract
KREJČÍ IGOR, VLTAVSKÁ KRISTÝNA: Measuring quarterly net fi xed capital stock in the Czech Republic. Acta Universitatis Agriculturae et Silviculturae Mendelianae Brunensis, 2013, LXI, No. 7, pp. 2367–2376 Balances of fi xed capital are ordinary part of annual national accounts statistics in most developed countries. Although quarterly data are useful for many applications and its existence would be consistent with other quarterly indicators, quarterly fi xed capital stock are not offi cially published. Even though there is no offi cial rule for estimation of quarterly fi xed capital stocks, several methods are currently available to estimate quarterly stocks of fi xed capital. The objective of this paper is to estimate the quarterly net fi xed capital stock in the Czech Republic at constant prices in industry classifi cation (CZ-NACE rev. 2) compatible with offi cial quarterly statistics of the indicators on national economy. For this estimation we distinguish three basic fl ows of fi xed capital. Firstly, gross fi xed capital formation is estimated on the basis of offi cial quarterly statistics which is published only in structure by types of assets. Flow of other changes is mainly uniformly distributed. Only in case of catastrophes it was possible to allocate these changes into appropriate quarter. Secondly, net fi xed capital stock and consumption of fi xed capital are estimated simultaneously on the basis of the assumption of relation between the value of the stock and its depreciation.
perpetual inventory method, net capital stock, consumption of fi xed capital, national accounts, quarterly estimates
The most intensive debate on interpreting and measuring capital is called Cambridge capital controversy or Cambridge debate. The debate basically grew from the criticism of the measurement of capital (Robinson, 1953–54, Sraff a, 1960) used in neoclassical theory. The original critique aimed aggregation of the capital and expression of its value primarily in simple production function Q = f(L,K), where L denotes labour in man-hours and K represents capital. The question was: in which units should be expressed variable of aggregated capital goods? Should be the capital stock expressed as a list of physical units, in labour necessary to produce the capital goods, in purchase prices or in terms of future earnings? Even though the debate
was not clearly solved and calmed partially because of the death of main protagonists (Cohen, Harcourt, 2003), measuring of capital in OECD countries is mainly based on neoclassical capital theory (OECD, 2009).1
In respect to the part of the Cambridge debate, the offi cial manual tries to refl ect the ‘dual nature of capital which is both the storage of wealth and a source of capital services in production’ (OECD, 2009, p. 11). Such solution corresponds to Hicks (1974) who did not understand forward and backward look as competing approaches.
Nowadays, balances of non-fi nancial2 capital are standard part of national accounts. Estimates of diff erent fl ows and stocks of non-fi nancial capital
1 For more detailed information about development of Cambridge capital controversy see e.g. Mata (2004) or Cohen and Harcourt (2003)
productive factors in national economy. This paper is focused on fi xed capital that constitute the biggest part of the non-fi nancial capital; only approximately 20% of the value of non-fi nancial capital consists of other groups of assets, i.e. inventories, valuables and non-produced assets (Czech Statistical Offi ce, 2013a). According to Czech Statistical Offi ce (2013b) net fi xed capital stock represented 85% of net worth in 2011. Based on System of National Accounts 2008 (SNA 2008, p. 125), the gross fi xed capital stock is represented by ‘assets surviving from investment and revaluated to at the purchasers’ prices of current period‘3. Net fi xed capital stock additionally refl ects the decreasing of value for moral obsolescence and physical deterioration (i.e. consumption of fi xed capital).
Data on fi xed capital stock represent important part of the productivity analysis and related potential output analysis. Indicators on fi xed capital are published mainly on annual basis. The reason consists in the diff erent aims of annual and quarterly statistics, demanding process of estimation by Perpetual Inventory Method (herea er: PIM) and missing essential data. Even though the Czech Statistical Offi ce (2008, 2013c) publishes quarterly gross fi xed capital formation (only by types of assets) and consumption of fi xed capital, the information about quarterly stock of capital is not published. Such situation is common for most statistical offi ces (OECD, 2009). This does not mean that there is no demand for quarterly fi xed capital stock data.
Kamps (2006) speaks about the lack of quarterly data on capital stock, which leads to the usage of less appropriate data on investment for the analysis. Kendrick and Lee (1976) estimates quarterly net capital stock by the estimation of depreciation rate d, i.e. the offi cial annual consumption of fi xed capital is not used as explicit input for estimation. Fernald (2012) similarly estimates quarterly net fi xed capital stock from annual data for total factor productivity analysis of the U.S. business sector. Levy and Chen (1994) propose four simple methods for estimation of quarterly net fi xed capital stock with diff erent interpolation of net stock and (in some cases) consumption of fi xed capital. Bordo and Haubrich (2010) use one of these methods (linear interpolation) for total factor productivity calculation, which was used as input data for econometric model of credit crises. Levy (1995) discusses the impact of tax rules on investment behaviour. Quarterly data on net fi xed capital
Klacek and Vopravil (2008) estimates quarterly net fi xed capital on the basis of investment fl uctuation for the productivity analysis in the Czech Republic. Adamec and Střelec (2012) use fl ow indicator of gross fi xed capital formation instead of capital stock for annual and quarterly potential product analysis of the Czech Republic.
The aim of this paper is to estimate the quarterly net fi xed capital stock in the Czech Republic in industry classifi cation (CZ-NACE rev. 2) at constant prices of 2005 for the period between the years 1995 and 2011. Proposed method of estimation respects both annual data on stocks and fl ows. For this estimation we distinguish three basic fl ows of capital, which represent common part of annual balances of fi xed capital and should be refl ected for more accurate estimation. Each of these fl ows is based on diff erent approach to divide annual data.
MATERIALS AND METHODS
The estimations of quarterly net fi xed capital are based on the offi cial data from the Czech Statistical Offi ce. From the SNA 2008 point of view fi xed assets represent assets that can be repeatedly used for more than one year. According to the threshold described in the European System of Accounts 1995 (ESA 1995) value of asset must be valued at least 20,000 CZK to be counted as fi xed asset in the Czech Republic (Czech Statistical Offi ce, 2002). Even Pigou (1935) stressed the importance of distinguishing the capital from point of view of the economic principles and business practice. Business accounting sums capital in prices from diff erent time periods. Moreover, the depreciation period is commonly based on law, convention and ordinarily the decision of the owner. As a result, value of capital stock from business accounting is not appropriate for macroeconomic analysis. As a solution, statistical offi ces use model estimation. Perpetual Inventory Method is the most recommended approach by SNA 2008. PIM presents descriptive model with constant time step, which is fully described in OECD (2009). This method refl ects the problems with collection of some necessary data, thus it is based on survey of gross fi xed capital formation and other changes4. Processes of retirement and consumption of fi xed capital are modelled on the basis of estimated service life and applied retirement and depreciation profi le.
3 To illustrate the quality of Czech estimates of fi xed capital balances we can mention the IMF and OECD (2011) conference focused on information gaps exposed by fi nancial crisis. Even though this conference was primarily for G20 countries, information about compilation of non-fi nancial balances in the Czech Republic was involved (see Ondruš, 2011).
The Czech Statistical Offi ce uses PIM based on age-price profi le5, mainly log-normal retirement distribution and straight-line depreciation profi le, for the compilation of balances of fi xed capital in the Czech Republic. Krejčí and Sixta (2012) extent the offi cial data and present the balances based on geometric depreciation profi le with use of double declining balance.
The Czech Statistical Offi ce (2013a) publishes stock indicators to the end of the year that is why we already have value in the fourth quarter. It is necessary to estimate fi rst three quarters in time series. For this purpose we distinguish three basic fl ows: gross fi xed capital formation, consumption of fi xed capital and other changes in volume of assets6.
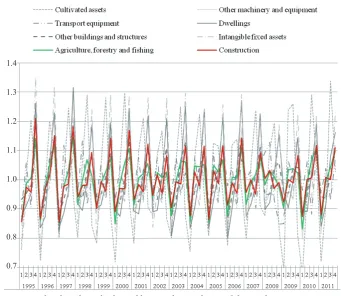
Quarterly gross fi xed capital formation is published only by types of assets. We use these data as weights for annual data on gross fi xed capital formation in industry structure. Each industry has diff erent structure of investments by type of assets. Fig. 1 shows quarterly indices of gross fi xed capital formation by type of assets and example of two industries (A – Agriculture, forestry and fi shing; F – Construction).
Other changes in volume of assets represent all fl ows of assets that are not investment or
depreciation. Because of the lack of any support information this indicator was mainly uniformly divided into quarters. Only in cases of loss from catastrophes it was possible to identify the appropriate quarter (e.g. fl oods in 2002 belongs to third quarter).
Finally, we simultaneously calculated quarterly fi xed capital stock and consumption of fi xed capital. Czech Statistical Offi ce (2002) use straight-line depreciation profi le7. This profi le is expressed by equation (1) where p0 represents initial value of the asset, pn is value of n years old asset and L represents average service life of that asset. Each gross fi xed capital formation is divided into sets by industry, year, institutional sector and type of asset. Considering the common lognormal retirement function each of these sets is divided into groups by service life for the processing by PIM.
0
1
n
p n
p L, n = 0, 1, …, L. (1)
The stock variable represents the accumulation of fl ows thus we can express the calculation of net capital stock by system of equations (2). Nt,q is net fi xed capital stock in qth quarter of year t, It,q 1.4
1.3
1.2
1.1
1.0
0.9
0.8
0.7
1: Quarterly indices of gross fixed capital formation by type of asset and chosen industries Source: Czech Statistical Offi ce, authors’ computation
5 For more information about the Czech variant of PIM see e.g. Czech Statistical Offi ce (2002), Sixta (2007). 6 In case of current prices, balances contain also fl ow of holding gain/loss see e.g. ESA 1995.
fi xed capital.
Nt−1,4 + It,1 + Ot,1−Dt,1 = Nt,1
Nt,1 + It,2 + Ot,2−Dt,2 = Nt,2
(2)
Nt,2 + It,3 + Ot,3−Dt,3 = Nt,3
Nt,3 + It,4 + Ot,4−Dt,4 = Nt,4
The higher is the net stock, the higher is also the consumption of fi xed capital. For estimation of quarterly consumption of fi xed capital we use simplifi ed computation (3) where the offi cial annual consumption of fi xed capital Dt,Y is divided into quarters on the basis of value of quarterly net fi xed capital stock. This computation is similar to Levy and Chen (1994) second method. However, Levy and Chen (1994) assume depreciation rate di (ratio of consumption on stock) to remain unchanged within year i. Moreover, the offi cial annual value of consumption of fi xed capital is not used. Levy and Chen (1994) use offi cial annual depreciation in third and fourth method, but it is not divided on the basis of quarterly net fi xed capital. In the fi rst case, it is linearly interpolated. In the second case, the depreciation is simply divided by four.
,
, ,
,
t q t q t Y
t Y
N
D D
N
(3)
Nt,Y = Nt,1 + Nt,2 + Nt,2 + Nt,4
Adjusting the (2) by (3) we get system of equations (4). Net fi xed capital stock in fourth quarter is equal to annual net capital stock from offi cial statistics and gross fi xed capital formation and other changes were already divided into quarters, the system of equations contains only three variables – net fi xed capital stock in fi rst, second and third quarter.
Nt,Y(Nt−1,4 + It,1 + Ot,1− Nt,1)−Dt,YNt,1 = 0
Nt,Y(Nt,1 + It,2 + Ot,2− Nt,2)−Dt,2Nt,2 = 0
(4)
Nt,Y(Nt,2 + It,3 + Ot,3− Nt,3)−Dt,3Nt,3 = 0
Nt,Y(Nt,3 + It,4 + Ot,4− Nt,4)−Dt,4Nt,4 = 0
year by Newton’s iteration method. For initial step, we use uniform distribution of net fi xed capital stocks. Iterations of Newton’s method ends when the next step does not cause the change of the solution rounded on millions CZK, which corresponds with offi cial statistics that is also rounded on millions.
RESULTS AND DISCUSSION
Based on the approach described in previous section we estimated quarterly net fi xed capital stock in prices of year 2005 in classifi cation CZ-NACE that is compatible with offi cial quarterly statistics of Czech Statistical Offi ce (2013b). The described calculation was applied on years 1995– 2011 and 11 industries (containing also their aggregations). Concerning the common two-factor productivity analysis based on Cobb-Douglas production function8, we added the last missing part for quarterly analysis. Table I shows our quarterly estimates of net fi xed capital stock. Fourth quarter is similar to offi cial annual data (Czech Statistical Offi ce, 2013a). Industry structure is available in Annex A.
Tab. I contains also the estimation of net fi xed capital stock without dwellings. We estimated this indicator primarily for the purposes of productivity analysis. Housing stock is commonly considered as mainly nonproductive (Appleton, Wallis, 2011) or with very low output elasticity (D’Auria et al., 2010).
In comparison with our approach, Levy and Chen (1994) obviously compute quarterly net fi xed capital stock in structure compatible with offi cial data on quarterly investments, thus they do not deal with estimation of quarterly gross fi xed capital formation. Indicator of other changes in volume of assets was introduced into offi cial rules in SNA 1993 as ‘complete reconciliation between the stocks and fl ows in the system’ (Moulton, 2004, p. 261). Therefore, Levy and Chen (1994) also do not estimate quarterly fl ows of other changes.
There is no offi cial statistics on productive stock for the Czech Republic9. Such stock estimated on basis of age-effi ciency profi les is considered as best indicator of capital input in production function (OECD, 2001). In case of missing data on this stock, the net fi xed capital stock10 is commonly used. Adamec and Střelec (2011) used gross fi xed capital formation for potential output analysis. Gross fi xed capital formation is the fl ow of investments into fi xed capital in current year and could not participate on the signifi cant part of the current year’s production. In case of measuring the potential, the stock variables are most appropriate
8 See Solow (1957).
9 See Sixta, Vltavská, Zbranek (2011) for total factor productivity analysis on basis of capital services in the Czech Republic.
to express what could be produced. According to the common practice and defi nition of fi xed capital stocks we recommend adjusting that analysis and using the net fi xed capital stock.
CONCLUSION
Quarterly estimates of net fi xed capital stock in the industry structure extend offi cial quarterly statistics. Official quarterly statistics contain relatively wide range of important indicators but the main part of net worth is missing. Results in this paper
compensate this inconsistency, which is not caused by unwillingness of the Czech Statistical Offi ce but by non-existing offi cial rule for quarterly estimation of net fi xed capital stock in combination with demanding process of even very simple estimation.
Our approach uses all possible additional information about fl ows of fi xed capital. Quarterly gross fi xed capital formation is estimated in industry structure (CZ-NACE rev. 2) on the basis of offi cial data in structure by type of asset. Other fl ows in volume of assets are uniformly distributed, only identifi able parts (in our case only catastrophes like I: Quarterly Net Fixed Capital Stock in Constant Prices of 2005 (millions CZK)
Year / Quarter Total dwellingsWithout Year / Quarter Total dwellingsWithout
1995
Q1 10 403 640 7 218 489
2004
Q1 12 889 213 9 388 013
Q2 10 708 869 7 438 454 Q2 13 046 056 9 508 785
Q3 11 010 319 7 654 492 Q3 13 200 461 9 624 523
Q4 11 345 636 7 899 433 Q4 13 374 785 9 754 694
1996
Q1 10 694 491 7 507 248
2005
Q1 13 198 768 9 648 586
Q2 11 017 584 7 741 097 Q2 13 327 088 9 746 218
Q3 11 354 029 7 985 009 Q3 13 454 869 9 840 988
Q4 11 705 386 8 240 939 Q4 13 603 489 9 951 677
1997
Q1 10 923 911 7 721 813
2006
Q1 13 406 174 9 827 216
Q2 11 248 584 7 956 815 Q2 13 541 904 9 930 273
Q3 11 576 304 8 193 750 Q3 13 680 719 10 032 942
Q4 11 935 953 8 455 888 Q4 13 856 225 10 165 496
1998
Q1 11 346 581 8 083 462
2007
Q1 13 565 151 9 979 448
Q2 11 621 046 8 280 492 Q2 13 761 626 10 124 858
Q3 11 897 068 8 477 221 Q3 13 957 909 10 268 123
Q4 12 186 979 8 684 086 Q4 14 186 798 10 435 613
1999
Q1 11 844 114 8 451 505
2008
Q1 13 919 572 10 277 933
Q2 12 009 060 8 575 426 Q2 14 104 976 10 409 083
Q3 12 173 173 8 697 105 Q3 14 287 775 10 534 108
Q4 12 362 567 8 839 468 Q4 14 477 919 10 661 987
2000
Q1 12 077 843 8 639 272
2009
Q1 14 447 783 10 644 050
Q2 12 227 976 8 756 306 Q2 14 526 273 10 706 323
Q3 12 382 905 8 875 719 Q3 14 608 684 10 769 709
Q4 12 570 711 9 021 797 Q4 14 709 782 10 847 044
2001
Q1 12 318 491 8 854 172
2010
Q1 14 795 818 10 903 572
Q2 12 466 348 8 970 458 Q2 14 812 511 10 915 942
Q3 12 616 298 9 086 308 Q3 14 844 053 10 937 846
Q4 12 791 140 9 222 217 Q4 14 883 688 10 963 633
2002
Q1 12 711 323 9 208 711
2011
Q1 15 686 239 11 635 967
Q2 12 791 228 9 267 472 Q2 15 555 856 11 535 349
Q3 12 873 420 9 326 638 Q3 15 444 216 11 451 114
Q4 12 957 153 9 383 824 Q4 15 347 312 11 385 013
2003
Q1 12 846 813 9 330 530
Q2 12 938 676 9 400 202
Q3 13 040 760 9 477 261
Q4 13 165 228 9 571 725
II: Anne x A : Q uar terl y N et F ix ed C api tal St
ock in C
ons
tant Pri
ces o
f 2005, I
ndu
st
ries
, million CZK
Year / Quarter
Total
Agriculture, forestry and
fi shing
Manufacturing,
mining and quarrying and other industry Construction Trade,
transportation, accommodation and food service Information and communication
Financial
and
insurance activities Real estate activities
Professional, scientifi c,
technical and administrative activities Public administration, education, health and social work Other service
activities
Total
of which: Manufac- turing
Year / Quarter
Total
Agriculture, forestry and fi shing
Manufacturing,
mining and quarrying and other industry Construction Trade,
transportation, accommodation and food service Information and communication
Financial
and
insurance activities Real estate activities
Professional, scientifi c,
technical and administrative activities Public administration, education, health and social work Other service
activities
Total
of which: Manufac- turing
fl oods or windstorms) are located into adequate quarters. Allocation of consumption of fi xed capital into quarters is based on intuitive assumption of relation between the value of the stock and its depreciation. Fourth quarters are equal to offi cial annual data; industry structure is similar to offi cial quarterly data structure.
Having the quarterly net fi xed capital stock our next research will focus on quarterly total factor productivity analysis. Our estimates also contain net fi xed capital stock without dwellings that can be counted as non-productive part of fi xed capital. These estimates are at everybody’s disposal, thus we hope these data will be helpful for work of other researchers.
SUMMARY
The paper presents quarterly estimation of net fi xed capital stock. This estimation enhances offi cial statistics which produce only annual data on net fi xed capital stock. The estimations of quarterly net fi xed capital are based on the offi cial data from the Czech Statistical Offi ce and strict diff erentiation of three basic fl ows of fi xed capital. First fl ow of quarterly gross fi xed capital formation is offi cially published only by types of assets. These data are used for the estimation in this paper as weights for annual data on gross fi xed capital formation in industry structure. Because of the lack of any support information, second fl ow of other changes in volume of assets is mainly uniformly divided into quarters. Only in cases of loss caused by catastrophes (fl oods and windstorms) it is possible to allocate the value into the appropriate quarter. Third fl ow of consumption of fi xed capital was calculated simultaneously with net fi xed capital stock. This calculation is based on previous estimation of quarterly gross fi xed capital formation, other changes in volume of assets and assumption of relation between value of stock and its consumption. This assumption leads to the system of nonlinear equations that is solved by Newton’s iteration method for each year. Iterations of Newton’s method ends when the next step does not cause the change of the solution rounded on millions CZK that corresponds with offi cial statistics that is also rounded on millions.
Quarterly net fi xed capital stock is estimated in prices of year 2005. The described calculation is ap-plied on years 1995–2011 and 11 industries (CZ-NACE rev. 2) or their aggregations. This classifi cation is compatible with offi cial quarterly statistics of Czech Statistical Offi ce. Estimated quarterly net fi xed capital stocks also contain option without the value of dwellings. This estimation is mainly for the purposes of productivity analysis. Housing stock can be considered as mainly nonproductive type of asset. Because stock indicators are estimated to the end of period, fourth quarters of net fi xed capital stock must be equal to offi cial annual data.
Acknowledgement
The paper is supported by the grant project IGA FEM CULS 20121024 “Molecules of dynamic model of Czech Republic”.
REFERENCES
APPLETON, J., WALLIS, G., 2011: Volume of capital services: new annual and quarterly estimates for 1950 to 2009. Economic & Labour Market Review, 5, 5: 46–66. ISSN 1751-8326.
ADAMEC, V., STŘELEC, L., 2012: A study of potential output and output gap in the Czech Republic. Acta univ. agric. et silvic. Mendel. Brunen., 60, 2: 9–16. ISSN 1211-8516.
BORDO, M., D., HAUBRICH, J., G., 2010: Credit crises, money and contractions: An historical view.
Journal of Monetary Economics, 57, 1: 1–18. ISSN
0304-3932.
COHEN, A. J., HARCOURT, G. C., 2003: Whatever Happened to the Cambridge Capital Theory Controversies? Journal of Economic Perspectives, 17, 1: 199–214. ISSN 0895-3309.
CZECH STATISTICAL OFFICE, 2002: Gross National
Income Inventory. [online], Praha: Czech Statistical
Offi ce, 447 s. [26. 9. 2011] Available: http://apl. czso.cz/nufi le/GNI_CZ_en.pdf.
CZECH STATISTICAL OFFICE, 2008: Quarterly
National Accounts Inventories. [online] Praha: Czech
Statistical Offi ce, 60 s. [3. 12. 2012], Available: http://www.czso.cz/csu/redakce.nsf/i/metodika_ ctvrtletni_ucty/$File/09087474.pdf.
CZECH STATISTICAL OFFICE, 2013a: Annual
National Accounts. [online]. [21. 5. 2013] Available:
http://apl.czso.cz/pll/rocenka/rocenka.indexnu_ en.
CZECH STATISTICAL OFFICE, 2013b: Balance
Sheets. [online]. [20. 5. 2013] Available: http://
apl.czso.cz/pll/rocenka/rocenkavyber.makroek_ rozvaha_en.
CZECH STATISTICAL OFFICE, 2013c: Gross
Domestic Product – time series. [online]. [20. 5. 2013]
Available: http://www.czso.cz/eng/redakce.nsf/i/ hdp_ts.
D’AURIA, F., DENIS, C., HAVIK, K. et al., 2010: The production function methodology for calculating potential
growth rates and output gaps. Brussels: European
Changes and Interest Rates. In: CORRADO, C., HALTIWANGER, J., SICHEL, D. eds. Measuring
Capital in the New Economy. Chicago: University of
Chicago Press, p. 479–542. ISBN 0-226-11612-3. EUROPEAN COMMISSION, UNITED NATIONS,
INTERNATIONAL MONETARY FUND, OECD, WORLD BANK, 1994: System of National Accounts
1993. New York, Brussels/Luxembourg, Paris,
Washington: Commission of the European Communities-Eurostat, International Monetary Fund, Organisation for Economic Co-operation and Development, United Nations and World Bank, 838 p. ISBN 92-1-161352-3.
EUROPEAN COMMISSION, UNITED NATIONS, INTERNATIONAL MONETARY FUND, OECD, WORLD BANK, 2009: System of National
Accounts 2008. New York: European Commission,
International Monetary Fund, Organisation for Economic Co-operation and Development, United Nations and World Bank, 720 p. ISBN 978-92-1-131522-7.
EUROPEAN COMMISSION, 1996: European System
of Accounts 1995. Brussels-Luxembourg: Eurostat,
383 p. ISBN 92-827-7954-8.
FERNALD, J., 2012: A Quarterly, Utilization-Adjusted Series on Total Factor Productivity. [online]. Federal
Reserve Bank of San Francisco Working Paper 2012-19,
28 p. [20. 8. 2013]. Available: http://www.frbsf.org/ economic-research/fi les/wp12-19bk.pdf.
HICKS, J., 1974: Capital Controversies: Ancient and Modern. The American Economic Review, 64, 2: 307– 316. ISSN 0002-8282.
IMF, OECD, 2011: Strengthening Sectoral Position and
Flow Data in the Macroeconomic Accounts. [online]
Washington DC: IMF, OECD. [15. 5. 2013] Available: http://www.imf.org/external/np/ seminars/eng/2011/sta/.
KAMPS, CH., 2006: New Estimates of Government Net Capital Stocks for 22 OECD Countries, 1960– 2001, IMF Staff Papers, 53, 1: 120–150. ISSN 1020-7635.
KENDRICK, J., W. LEE, K., S., 1976: Quarterly Estimates of Capital Stocks in the U.S. Private Domestic Economy, by Major Industry Groups.
Review of Income and Wealth, 22, 4: 345–352. ISSN
1475-4991.
KLACEK, J., VOPRAVIL, J., 2008: Total factor productivity in Czech manufacturing industry – KLEM framework. Statistika: Statistics and Economy
Journal, 45, 5: 414–428. ISSN 1804-8765.
KLACEK, J., VOŠVRDA, M., SCHLOSSER, Š., 2007: KLE Translog production function and total factor productivity. Statistika: Statistics and Economy
Journal, 44, 4: 261–274. ISSN 1804-8765.
kapitálu. Politická ekonomie, 60, 5: 780–800. ISSN 0032-3233.
LEVY, D., 1995: Capital Stock Depreciation, Tax Rules, and Composition of Aggregate Investment.
Journal of Economic and Social Measurement, 21, 1: 45–
65. ISSN 0747-9662.
LEVY, D., CHEN, H., 1994: Estimates of the aggregate quarterly capital stock for the post-war U.S. economy. Review of Income and Wealth, 40, 3: 317– 349. ISSN 1475-4991.
MATA, T., 2004: Constructing Identity: The Post Keynesians And The Capital Controversies.
Journal of the History of Economic Thought, 26, 2: 241–
259. ISSN 1053-8372.
MOULTON, B. R., 2004: The system of national accounts for the new economy: what should change? Review of Income and Wealth, 50, 2: 261–278. ISSN 1475-4991.
OECD, 2001: Measuring Productivity – OECD Manual: Measurement of Aggregate and Industry-Level
Productivity Growth. Paris: OECD Publishing. 155 p.
ISBN 92-64-18737-5.
OECD, 2009: Measuring Capital – OECD Manual 2009:
Second edition. Paris: OECD Publishing. 233 p. ISBN
978-92-64-02563-9.
ONDRUŠ, V., 2011: Compilation of Non-fi nancial Balances in the Czech Republic. In: Conference on Strengthening Sectoral Position and Flow Data in
the Macroeconomic Accounts, [online] Washington
DC: IMF, OECD. Available: http://www.imf.org/ external/np/seminars/eng/2011/sta/pdf/Czech. pdf [17. 5. 2011].
PIGOU, A. C., 1935: Net income and capital depletion. The Economic Journal, 45, 178: 235–241. ISSN 0013-0133.
ROBINSON, J., 1953-1954: The Production function and the Theory of Capital, The Review of Economic
Studies, 21, 2: 81–106. ISSN 1467-937X.
SIXTA, J., 2007: Odhady spotřeby fi xního kapitálu.
Statistika, 87, 2: 156–163. ISSN 0322-788X.
SIXTA, J., VLTAVSKÁ, K., ZBRANEK, J., 2011: Souhrnná produktivita faktorů na službách práce a kapitálu. Politická ekonomie, 59, 5: 599–617. ISSN 0032-3233.
SOLOW, R. M., 1957: Technical Change and the Aggregate Production Function. The Review of
Economics and Statistics, 39, 3: 312–320. ISSN
0034-6535.
SRAFFA, P., 1960: Production of commodities by means
of commodities: prelude to a critique of economic theory.
Cambridge: Cambridge university press, 98 p. ISBN 0-521-06539-2.
Address