Neuropsychiatric Disease and Treatment
Dove
press
R e v i e w open access to scientific and medical research
Open Access Full Text Article
Moderate alcohol consumption
and cognitive risk
edward J Neafsey Michael A Collins
Department of Molecular Pharmacology and Therapeutics, Loyola University Chicago, Stritch School of Medicine, Maywood, iL, USA
Correspondence: edward J Neafsey Department of Molecular Pharmacology and Therapeutics, Loyola University Medical Center, Stritch School of Medicine, 2160 South First Avenue, Maywood, iL 60153, USA Tel +1 708 216 3355 Fax +1 708 216 3913 email eneafse@lumc.edu
Abstract: We reviewed 143 papers that described the relationship between moderate drinking
of alcohol and some aspect of cognition. Two types of papers were found: (1) those that provided ratios of risk between drinkers and nondrinkers (74 papers in total) and (2) those that, although they did not provide such ratios, allowed cognition in drinkers to be rated as “better,” “no different,” or “worse” than cognition in nondrinkers (69 papers in total). The history of research on moderate drinking and cognition can be divided into two eras: 1977–1997 and 1998–present. Phase I (1977–1997) was the era of neuropsychological evaluation involving mostly young to middle-aged (18–50 years old) subjects. Although initial studies indicated moderate drinking impaired cognition, many later studies failed to confirm this, instead finding no difference in cognition between drinkers and nondrinkers. Phase II (1998–present) was and is the era of mental status exam evaluation involving mostly older ($55 years old) subjects. These studies overwhelmingly found that moderate drinking either reduced or had no effect on the risk of dementia or cognitive impairment. When all the ratios of risk from all the studies in phase II providing such ratios are entered into a comprehensive meta-analysis, the average ratio of risk for cognitive risk (dementia or cognitive impairment/decline) associated with moderate “social” (not alcoholic) drinking of alcohol is 0.77, with nondrinkers as the reference group. The benefit of moderate drinking applied to all forms of dementia (dementia unspecified, Alzheimer’s disease, and vascular dementia) and to cognitive impairment (low test scores), but no significant benefit against cognitive decline (rate of decline in test scores) was found. Both light and moderate drinking provided a similar benefit, but heavy drinking was associated with nonsignificantly higher cognitive risk for dementia and cognitive impairment. Although the meta-analysis also indicated that wine was better than beer or spirits, this was based on a relatively small number of studies because most studies did not distinguish among these different types of alcohol. Furthermore, a number of the studies that did make the distinction reported no difference among the effects of these different types of alcohol. Therefore, at present this question remains unanswered. Analysis also showed that the presence of the apolipoprotein E epsilon 4 allele eliminated the benefit of moderate drinking. However, this was based on a relatively small number of studies and several other studies have found a beneficial effect of the epsilon e4 allele. Further studies are necessary to settle this question. The benefit of moderate alcohol for cognition was seen in both men and women, although the amount and pattern of drinking is very different between the two sexes. Lastly, the finding of unaffected or significantly reduced cognitive risk in light to moderate drinkers was seen in 14/19 countries for which country-specific ratio data were available, with three of the five remaining countries showing nonsignificant reductions as well. Overall, light to moderate drinking does not appear to impair cognition in younger subjects and actually seems to reduce the risk of dementia and cognitive decline in older subjects.
Keywords: Alzheimer’s disease, dementia, drinking
Neuropsychiatric Disease and Treatment downloaded from https://www.dovepress.com/ by 118.70.13.36 on 25-Aug-2020
For personal use only.
Number of times this article has been viewed
This article was published in the following Dove Press journal: Neuropsychiatric Disease and Treatment
Dovepress
Neafsey and Collins
Introduction
What is the effect of moderate “social” (not alcoholic) drinking of alcohol on cognition? Does it impair cognition? Does it have no effect on cognition? Or does it enhance or preserve cognition? We have reviewed and analyzed results from studies from the late 1970s through June of 2011, comparing cognitive risk (including dementia, cognitive impairment, and cognitive decline) in moderate social drinkers (not alcoholics) with cognitive risk in nondrinkers.
Our interest in this topic arose from our finding that 6 days of moderate alcohol exposure protects rat organotypic hippocampal-entorhinal cortex brain slice cultures from the toxicity of amyloid-β,1 the protein that has been strongly implicated in the pathogenesis of Alzheimer’s disease (AD).2 We3–6 and others7,8 have hypothesized a mechanism in which alcohol “protects” by its “preconditioning” effect on neu-rons and glia, which involves upregulation of heat shock proteins and other cellular pro-survival mechanisms such as N-methyl-D-aspartate receptors, protein kinase C epsilon, and focal adhesion kinase. This line of research naturally led us to inquire whether there was any evidence that drinking alcohol may “protect” from AD and other forms of dementia or cognitive impairment. There was a large scientific literature addressing this question9–17 and our attempt to understand this literature led us to write this review.
Methods
Search strategies
The collection of studies reviewed here was assembled primarily by manual search using the bibliographies of each paper and was supplemented by literature searches using the PubMed database. Search terms used for database searches included alcohol or ethanol, dementia, AD, cognition, mild cognitive impairment (MCI), cognitive decline, and memory, all in various combinations. In addition, these terms were also combined with the names of more than 250 countries around the world. This strategy yielded studies providing ratios of risk from 19 countries (Australia, Brazil, Canada, China and Taiwan, Denmark, Finland, France, Germany, Greece, Hungary, Italy, Japan, Korea, the Netherlands, Nigeria, Spain, Sweden, the UK, and the US). Two additional countries (Ireland and Norway) were added to this list from “non-ratio” studies. (The total number increased by eleven if countries included in the Syst-Eur study18 were added [Belgium, Bulgaria, the Czech Republic, Estonia, Israel, Lithuania, Poland, Portugal, Romania, the Russian Federation, and
Slovakia], but in this study it was not possible to associate any particular country with its results.)
Unfortunately, studies in languages other than English were not reviewed. In addition, there is no doubt that the search missed some studies for a variety of reasons, and we apologize for these omissions.
Two types of studies
Two types of studies are distinguished in this review: (1) those providing ratios of risk, such as odds ratios (ORs), risk ratios (RRs), or hazard ratios (HRs) (collectively termed “XRs”); and (2) those that, instead of providing such ratios, could be interpreted in terms of whether some aspect of cognition was “worse,” “no different,” or “better” in moderate drinkers than in nondrinkers. Historically, the studies without ratios preceded those with ratios, and so that is the order of presentation.
Studies without ratios of risk
There were 69 studies without ratios of risk that could have results grouped into categories of (1) worse, (2) no different, and (3) better cognition in drinkers than in nondrinkers, or in heavy drinkers than in light drinkers. The data in these three categories were plotted as cumulative sum histograms of the numbers of studies accumulating each year from 1975 to 2011. (A cumulative sum is a sequence of partial sums of a given sequence; for example, the cumulative sums of the sequence 1,2,1 are 1,3,4.) These histogram plots provide valuable information on the history of the field, including when studies in each category occurred and for how long and at what rate they continued to accumulate in each category. Data concerning the type of cognitive testing employed and the age of the subjects in the studies are also plotted.
Studies with ratios of risk
There were 74 studies that provided various ratios of risk, including ORs, RRs, or HRs. Such numbers allowed for relatively direct comparisons among studies and were used for meta-analysis. The XRs were pooled and plotted together in forest plots because such ratios are roughly equivalent when describing events such as AD or MCI that are relatively rare or uncommon.19–22
The present review does not follow what has become the conventional method for meta-analysis in which only a subset of studies that meet certain criteria for quality are selected for analysis from a larger set of studies collected in a field.23–25 Instead, and perhaps closer to the original concept
Neuropsychiatric Disease and Treatment downloaded from https://www.dovepress.com/ by 118.70.13.36 on 25-Aug-2020
Dovepress Moderate alcohol consumption and cognitive risk
of meta-analysis, which called for liberal inclusion criteria that incorporate “all studies, good bad and indifferent”26 and for considering the unit of analysis to be all the findings from each study and not just one summary value for each study,26 we chose to “uncritically” collect data from as many studies as possible and thus present the “big picture,” both for its own value and as a complement and a context for more restricted or selective meta-analyses. Therefore, if a study reported 1 OR or 50, all were included in the analysis. The second reason is that several meta-analyses of the effects of moderate drinking on cognition that employed the conventional, more restricted sample method have recently been published.11,12
The normal meta-analysis method of presenting a forest plot and calculating an overall ratio with its 95% confidence intervals (CIs) was followed. Since such an “uncritical” meta-analysis includes the effects of moderate drinking on a broad spectrum of cognitive function – including dementia, cognitive impairment, and cognitive decline – and different methods of measuring cognition, the presence of significant “heterogeneity” or inconsistency among studies27–29 was determined. This was achieved by calculating the P-value (Qp) of the Q statistic (the weighted sum of squared differences between individual study effects and the pooled effect across studies) and the percentage of variability due to heterogeneity rather than chance (I2); these two numbers are reported in the forest plot figures and com-mented on in the text. The results of a random-effects model are always reported in the forest plots on the left-hand side of the figures. On the right-hand side of the figures are found plots of the “approximately normal”30 distributions of the logs of the ratios (log[XR] values), along with the results of a fixed- effects model. In addition, small inset quantile–quantile (Q–Q) plots of the log(XR) values are presented to better display any deviations from normality; small inset funnel plots are also presented, to aid detection of “publication bias.”31,32 The tops of the funnel plots are labeled with the P-values of two tests for funnel plot asymmetry, the regression test31 on the left and the rank correla-tion test33 on the right.
The open-source R statistical program34 and its metafor package, which can be obtained from http://www.r-project.org and http://www.metafor-project.org, respectively, were used to carry out the statistical meta-analysis and generate the plots.
Results
Does moderate drinking affect
cognitive risk?
Before answering this question, because the methods of measuring cognition and the ages of the subjects studied
have changed in important ways since 1977, it is important to describe the history of research in this field. This history begins with studies without ratios of risk, since the early work did not provide such ratios.
Cognition in studies without ratios of risk
Figure 1 and Table 1 summarize the results from these 69 studies, which included a total of 111,909 subjects (56,934 women and 54,906 men) and provided a total of 87 judgments of whether cognition was worse, no different, or better in drinkers than in nondrinkers or in heavy drinkers than in light drinkers (there are more judgments than studies because some studies reported results for men and women separately). Of these 69 studies, 46 were from the US, 13 from Europe (Denmark; Finland; France; the Netherlands; Ireland, Scotland, Norway; Sweden; and the UK), seven from Australia, two from Asia (China and Japan), and one from Canada. As seen in Figure 1, the 1977 study by Parker and Noble35 is considered the beginning of investigation of alco-hol’s effect on cognition in social drinkers. It reported worse cognition in social drinkers that was related to the quantity of alcohol consumed per occasion; this study is labeled along the x-axis as the first element on the “Worse” histogram (heavy, solid gray line). These authors concluded that their results supported the “continuity hypothesis” of Ryback36 that proposed, as summarized by Parsons and Nixon, that “there is a continuum of alcohol effects on the brain, ranging from the profound memory and abstracting impairment found in patients with Korsakoff’s disease, through the moderate cognitive impairments found in non-Korsakoff alcoholics, to mild cognitive impairments that might be present in heavy to moderate social drinkers.”37 However, within a few years studies reporting no difference (“NoDiff ” histogram; left, heavy black line) in cognition between drinkers and non-drinkers began to appear, and such studies have continued to accumulate up to the present (43 studies in total), while the “Worse” histogram plateaued and eventually stopped accumulating in 2003 (only 14 studies in total). In 1998 a third histogram (right, heavy black line) of studies reporting “Better” cognition in moderate drinkers began accumulating more rapidly (one study reporting “better” was seen earlier, in 1987), and this has continued up to the present (30 stud-ies in total).
Why did these studies finding “better” cognition in drinkers start appearing so late? There appear to be two reasons for the late appearance of better cognition in drinkers. First, more than 60% (18/29) of these “better” studies used some
Neuropsychiatric Disease and Treatment downloaded from https://www.dovepress.com/ by 118.70.13.36 on 25-Aug-2020
Dovepress
Neafsey and Collins
type of mental status exam (thin dotted line labeled b+mse in Figure 1), such as the Mini-Mental State Examination (MMSE), the Telephone Interview for Cognitive Status™ (TICS™), the TELE telephone interview, the Modified Mini-Mental State (3MS) examination, or the Cognitive Abilities Screening Instrument. Only one study employed a mental status exam before 1998;
therefore, the history of studies of alcohol and cognition in social drinkers (not alcoholics) can be divided into two phases, with phase II (1998–2011) being the “mental status” era, as labeled in Figure 1. Phase II is also characterized by more studies of older subjects ($55 years old, thin dashed line labeled gte55 in Figure 1) than in phase I.
Years
Cumulative sums of effects of moderate drinking on cognition
0 5 10 15 20 25 30 35 40 45
87 groups in 69 studies of moderate drinking and cognition
Worse
14 NoDiff
43
Better30
gte55 b+mse 19
Parker
and Noble 77 Parsons 86Review Parsons Nixon 98Review Phase 1
Neuropsychology Phase 2Mental status
75 77 79 81 83 85 87 89 91 93 95 97 99 01 03 05 07 09 11
USA 11 28 16
Australia 2
Scandinavia 1
2 4
Canada 0 1 0
UK 0
0 0
14
0
43
49 34
3 Other Europe
China 1
0 0
Japan 1
TOTAL
PERCENT 16
3 3 4
4
3
30 Worse NoDiff Better
Figure 1 Cumulative sum histograms (heavy lines) of numbers of studies that did not report various ratios or risk but instead reported “worse” (heavy solid gray line), “NoDiff” (left, heavy solid black line), or “Better” (right, heavy solid black line) cognition in “social” drinkers (not alcoholics) versus nondrinkers from 1975 to 2011. Thin dotted line at the lower right plots the cumulative sum histogram for studies that reported better cognition and used a MSe to evaluate cognition (b+mse). Thin dashed line plots the cumulative sum histogram for studies of subjects who were $55 years of age (gte55). Dashed vertical line at 1998 separates two phases of research on this question (phase i: neuropsychology; phase ii: mental status). inset table shows the breakdown by country of studies reporting worse, no different, or better cognition in drinkers. Abbreviations: CI, confidence interval; b, better; ge55, $55 years of age; HR, hazard ratio; MSe, mental status exam; NoDiff, no different; OR, odds ratio; RR, risk ratio; UK, United Kingdom; USA, United States of America.
Neuropsychiatric Disease and Treatment downloaded from https://www.dovepress.com/ by 118.70.13.36 on 25-Aug-2020
Dovepress Moderate alcohol consumption and cognitive risk
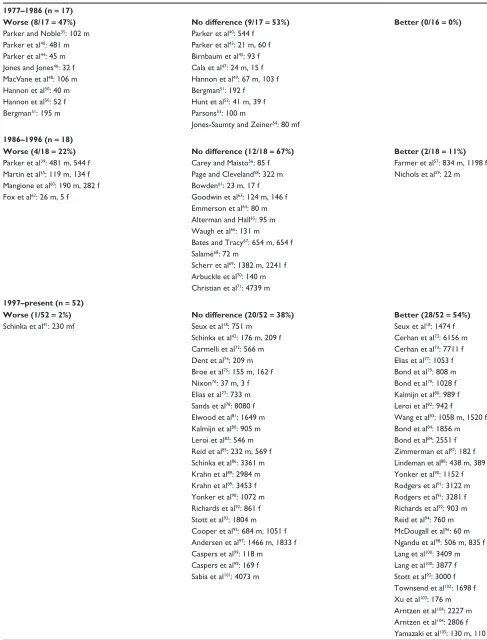
Table 1 Cognitive performance in drinkers in “non-ratio” studies, 1977–1986, 1986–1996, and 1997–present
1977–1986 (n = 17)
Worse (8/17 = 47%) No difference (9/17 = 53%) Better (0/16 = 0%)
Parker and Noble35: 102 m Parker et al40: 544 f Parker et al40: 481 m Parker et al43: 21 m, 60 f Parker et al44: 45 m Birnbaum et al45: 93 f Jones and Jones46: 32 f Cala et al47: 24 m, 15 f Macvane et al48: 106 m Hannon et al49: 67 m, 103 f Hannon et al50: 40 m Bergman51: 192 f
Hannon et al50: 52 f Hunt et al52: 41 m, 39 f
Bergman51: 195 m Parsons53: 100 m
Jones-Saumty and Zeiner54: 80 mf
1986–1996 (n = 18)
Worse (4/18 = 22%) No difference (12/18 = 67%) Better (2/18 = 11%)
Parker et al39: 481 m, 544 f Carey and Maisto56: 85 f Farmer et al57: 834 m, 1198 f Martin et al55: 119 m, 134 f Page and Cleveland58: 322 m Nichols et al59: 22 m Mangione et al60: 190 m, 282 f Bowden61: 23 m, 17 f
Fox et al62: 26 m, 5 f Goodwin et al63: 124 m, 146 f emmerson et al64: 80 m Alterman and Hall65: 95 m waugh et al66: 131 m Bates and Tracy67: 654 m, 654 f Salamé68: 72 m
Scherr et al69: 1382 m, 2241 f Arbuckle et al70: 140 m Christian et al71: 4739 m
1997–present (n = 52)
Worse (1/52 = 2%) No difference (20/52 = 38%) Better (28/52 = 54%)
Schinka et al41: 230 mf Seux et al18: 751 m Seux et al18: 1474 f
Schinka et al42: 176 m, 209 f Cerhan et al73: 6156 m Carmelli et al72: 566 m Cerhan et al73: 7711 f Dent et al74: 209 m elias et al77: 1053 f Broe et al75: 155 m, 162 f Bond et al79: 808 m
Nixon76: 37 m, 3 f Bond et al79: 1028 f
elias et al77: 733 m Kalmijn et al80: 989 f Sands et al78: 8080 f Leroi et al82: 942 f
elwood et al81: 1649 m wang et al83: 1058 m, 1520 f Kalmijn et al80: 905 m Bond et al84: 1856 m Leroi et al82: 546 m Bond et al84: 2551 f Reid et al85: 232 m, 569 f Zimmerman et al87: 182 f Schinka et al86: 3361 m Lindeman et al88: 438 m, 389 f Krahn et al89: 2984 m Yonker et al90: 1152 f Krahn et al89: 3453 f Rodgers et al91: 3122 m Yonker et al90: 1072 m Rodgers et al91: 3281 f Richards et al92: 861 f Richards et al92: 903 m Stott et al93: 1804 m Reid et al94: 760 m Cooper et al95: 684 m, 1051 f McDougall et al96: 60 m Andersen et al97: 1466 m, 1833 f Ngandu et al98: 506 m, 835 f Caspers et al99: 118 m Lang et al100: 3409 m Caspers et al99: 169 f Lang et al100: 3877 f Sabia et al101: 4073 m Stott et al93: 3000 f
Townsend et al102: 1698 f Xu et al103: 176 m Arntzen et al104: 2227 m Arntzen et al104: 2806 f Yamazaki et al105: 130 m, 110 f Notes: First section covers 17 studies without ratios from 1977 to 1986, reviewed by Parsons.38 second section covers 18 studies without ratios from 1986 to 1996, reviewed
by Parsons and Nixon.37 Third section covers 52 studies without ratios from 1997 to the present. Some studies provide separate results for men (m) and women (f).
Neuropsychiatric Disease and Treatment downloaded from https://www.dovepress.com/ by 118.70.13.36 on 25-Aug-2020
Dovepress
Neafsey and Collins
During phase I (1977–1997), in contrast, the studies measured various aspects of cognition primarily by a wide variety of neuropsychological tests, such as the Shipley Institute of Living Scale, the Wechsler Adult Intelligence Scale, the Wisconsin Card Sorting Test, various components of the Halstead–Reitan Neuropsychological Test Battery such as the Trail Making Test or the Category Test, the Stroop Color-Word Test, and others. For this reason, phase I is labeled as “Neuropsychology” in Figure 1. The results of phase I studies of the relationship between social drinking and cognition were summarized in two reviews authored by Parsons, one in 198638 and the other, authored with Nixon, in 1998.37 The earlier review concluded that “there are no stable or reproducible specific relationships” between drinking and performance on certain cognitive-perceptual tests and that “the results of studies to date are inconclusive.”38 The later review concluded that “heavy social drinkers had significantly worse performance on one or more cognitive tests than the light drinkers,” supporting the alcohol-causal-threshold hypothesis that “persons drinking five or six US standard drinks per day over extended time periods manifest some cognitive inefficiencies.” Therefore, light to moderate drinking was not consistently associated with any cognitive deficits, although the evidence continued to be “fragmentary and in need of replication.”37 This conclusion is further supported by the reanalysis by Parker et al39 of their earlier study.40 The reanalysis found that the cognitive deficits they had reported earlier were due to the effects of heavy drinkers (almost daily consumption of four drinks), since in lighter drinkers (two drinks/occasion, 1.6 times/week) “neither the quantity of alcohol consumed per occasion nor the frequency of consumption significantly predicted abstraction performance.”39
Table 1 lists the various studies that were included in Figure 1. The first and second sections of the table list studies during phase I, as discussed. The third section of Table 1 covers the period from 1997 to the present. Note that only 1/52 (2%) studies during this period found that social drinkers were cognitively worse than nondrinkers. In that study, of 230 male and female elderly African-Americans, Schinka et al41 reported that “medium intensity” (30–60 drinks/month) moderate drinkers (n = 25) had poorer general cognitive performance (3MS, Hopkins Verbal Learning Test, and Stroop test) than both nondrinkers (n = 116) and “high intensity” (.119 drinks/ month) heavy drinkers (n = 18). However, the same study’s hierarchical multiple regression analysis found drinking significantly “explained” variance in general cognition (2.4%), memory (4.8%), and executive function (4.9%), and the
overall influence was beneficial or “facilitatory” – ie, drinking improved scores. Therefore, although listed in Table 1 in the “Worse” column, this study could also have been listed under “Better.” Furthermore, Schinka et al41 point out their study is inconsistent with their own work using identical methods to study an elderly, mostly white sample42 in which no significant effects of drinking or drinking intensity on cognition were seen. Shifting to the other categories, in 20/52 (38%) of the studies no difference was seen between drinkers and nondrinkers, and, in contrast to earlier research, better cognitive performance was seen in 28/52 (54%) of the studies. Many of these studies reporting better cognition in drinkers used mental status exams to evaluate cognition and also studied older ($55 years old) subjects.
In summary, when “no ratio” studies are reviewed, it appears that, when evaluated by standard psychological tests in younger subjects (,55 years old), heavy drinking (4–6 drinks/day) is associated with cognitive impairment (the alcohol-causal-threshold hypothesis). However, there is no significant difference in cognition between light to moder-ate drinkers and nondrinkers. Interestingly, when various mental status exams are used to assess cognition, it appears that drinkers have a reduced risk of dementia or cognitive impairment compared with nondrinkers.
Cognition in studies with ratios of risk
As seen in the forest plot in Figure 2A and in Table 2, the 74 studies with ratios provided 446 ratios of risk (XRs) and included 253,791 subjects, including 173,970 women and 122,033 men. For 68 studies (92%), the subjects were aged $55 years, while for 52 studies (70%) the subjects were aged $65 years. About 87% of the ratios (388/446) were derived from studies that employed mental status exams as all or part of the measure of cognition. Eighty percent of these studies took place since 1998 and therefore can be considered part of the phase II mental sta-tus era. Of these 74 studies, 30 were from the US, 25 from Europe (Denmark, Finland, France, Germany, Greece, the Netherlands, Hungary, Italy, Spain, Sweden, and the UK), eight from Asia (China, Japan, Korea, and Taiwan), three from Australia, five from Canada, two from Africa (Nigeria), and one from South America (Brazil).
As seen in Figure 2A, the overall weighted mean value (XRwm) from a random-effects meta-analysis was 0.77, and the 95% CI was relatively narrow (0.73–0.80), showing a significantly reduced risk for dementia, cognitive impairment, or cognitive decline in the drinkers. Significant
Neuropsychiatric Disease and Treatment downloaded from https://www.dovepress.com/ by 118.70.13.36 on 25-Aug-2020
Dovepress Moderate alcohol consumption and cognitive risk
heterogeneity was present (I2= 83.1%; Qp = 0.0000). Since it is the log(XR) values that have an approximately normal distribution,30 Figure 2B shows a histogram and smoothed (solid line) plot of all log(XR) values. Although both low and high ends of log(XR) distribution diverge slightly from normal compared with a pure normal distribution created with the same mean and variance (dashed line), the plot illustrates nonetheless that the log(XR) distribution is close to normal, with a mean of −0.278. This normality is also seen in the small inset normal Q–Q plot at the lower left of the figure. The funnel plot at the lower right was relatively symmetric and did not indicate publication bias. Taking the antilog of the mean gives an XRm of 0.76 (almost identical to that seen for the weighted average random-effects analy-sis) with a relatively narrow 95% CI (0.71–0.81), showing a significant reduction in cognitive risk in drinkers. The basic normality of the log(XR) distribution is consistent with it being close to the actual population distribution;
therefore, it shows a real and beneficial effect of light to moderate drinking that reduces the risk of dementia, cog-nitive impairment, and cogcog-nitive decline in older adults by 20%–25%.
Does it make any difference if the reference group of nondrinkers includes former drinkers, who might be considered “sick quitters”?
One criticism of studies reporting lower risk or better outcome in light to moderate drinkers is that the reference group of nondrinkers or nondrinkers includes former drinkers who might be considered “sick quitters”; this may bias the results by making the reference group “sicker” than it really is and, by comparison, make drinkers appear better off than they really are.179–183 However, Figure 3 shows that 19 studies with 191 ratios excluded former drinkers from the reference group and still found a protective effect of drinking (XRwm= 0.79 [95% CI: 0.75–0.84]; XRm= 0.72 [95% CI: 0.66–0.80]).
RE Model
XR = OR, RR, HR (log scale) (N = 446, 74 studies)
Qp = 0.0000
I2 = 83.1%
All: XRwm = 0.77 (0.73, 0.80)
x x
A B
Log (XR)
Density
3 2 1 0 −1 −2 −3 100.00
10.00 1.00
0.10 0.01
0.00
0.0 0.2 0.4 0.6 0.8 1.0
Log (XR) x = −0.278
σ2 = 0.429
σ = 0.655 SEM = 0.034 n = 370
x
XR (± 95% CI) XR = 0.76 (0.71, 0.81) XR = ex
L95 = e(x − 1.96 SEM)
U95 = e(x + 1.96 SEM)
All: XRm = 0.76 (0.71, 0.81)
Log (XR) Probability Density
Log (XR) density
Ν (x, σ2)
−3 −1 1 3 −3 −2 −1 0 1 2
Normal QQ Plot
Log odds ratio
Standard erro
r
0.379
1.517
(0.83, 0.26)
-4.00 0.00 3.00
Figure 2 (A) Forest plot of all 446 XRs (white dots) plus or minus their 95% Cis (horizontal “whiskers”) from 74 studies providing ratios; ratios are listed in order from smallest to largest. XRwm is the weighted (wt = 1/SeM2) mean of all 446 ratios from a random-effects meta-analysis model with 95% Ci in parentheses. Mean value ±95%
CI is to the left of and significantly less than the thick solid vertical line at 1.00 that denotes no difference; this value indicated on the plot’s x axis with ±95% Ci (vertical dashed lines). (B) Histogram of the probability density of the log(XR) values with a superimposed smooth probability density curve (solid line) and a superimposed normal distribution density curve (dashed line) calculated using the mean and variance of log(XR). XRm is the simple (not weighted) antilog of the mean of all log(XR) values with
the 95% CI in parentheses; this value indicated on the plot’s x axis with ±95% Ci (vertical dashed lines). Small inset graph on left is a normal Q–Q plot showing normality and departures from normality of the log(XR) distribution. Small inset graph on right is funnel plot with P-values for regression (left) and rank correlation (right) tests for asymmetry across top. Note that XRm is identical to XRwm.
Abbreviations: CI, confidence interval; HR, hazard ratio; NoQuitters, no quitters; OR, odds ratio; Q–Q, quantile–quantile; RR, risk ratio; SEM, standard error of the mean;
wt, weight; XRs, hazard ratios, odds ratios, and risk ratios; XRwm, weighted mean ratio.
Neuropsychiatric Disease and Treatment downloaded from https://www.dovepress.com/ by 118.70.13.36 on 25-Aug-2020
Dovepress
Neafsey and Collins
Table 2 The 74 studies providing ratios of risk listed by decade
1980s (n = 4) 1990s (n = 14) 2000s (n = 53)
Heyman et al106 Hofman and van Duijn107 Cervilla et al108 French et al109 iliffe et al110 Commenges et al111 Amaducci et al112 Hebert et al113 Galanis et al114 Guralnik and
Kaplan115
ensrud et al116 Yoshitake et al118
Hébert et al117 Tyas et al119 Hendrie et al120 DeCarli et al121 Launer et al122 Zuccala et al123 Dufouil et al124 Huang et al125 Orgogozo et al126 Lindsay et al127 Tsolaki et al128 Ruitenberg et al129 edelstein et al130 Tanaka et al131 Carmelli et al132 Truelsen et al133 Harwood et al134 Bachman et al (USA)135 Leibovici et al136 Bachman et al (Nigeria)135
Mukamal et al137 Zhou et al138 Anttila et al139 Britton et al140 Larrieu et al141 Luchsinger et al142 espeland et al143 Ganguli et al144 Järvenpää et al145 Rozzini and Trabucci146 Stampfer et al147 Dai and Pruett148 Deng et al149 Ogunniyi et al151 Simons et al152 wright et al153 Yip et al154 McGuire et al155 Solfrizzi et al156 vincze et al157 wadley et al158 Kivipellto et al159 Mehlig et al160 Umegaki et al161 Barnes et al162 Cherbuin et al163 Peters et al164 Sabia et al165 Yaffe et al166 Chan et al167 Garcia et al168 Lobo et al169 Lopes et al170 Luck et al171 Smith et al172 virtaa et al173 Yen et al174 Au Yeung et al175 Gureje et al150 Kim et al176 Rusanen et al177 weyerer et al178 Note: Most (about 80%) of the studies took place after 1998 in the mental status era.
For example, Hendrie et al120 used lifetime nondrinkers as the reference group, thereby avoiding former drinkers. Zuccala et al123 attempted to compensate for the presence of sick quitters in the reference group of nondrinkers by adjusting for a comorbidity covariate. Ruitenberg et al129 reported that the HR for dementia in light to moderate drinkers when subjects with changed drinking patterns were excluded was 0.57 (95% CI: 0.36–0.89), which is virtually the same as the HR of 0.58 (95% CI: 0.38–0.90) when they were not excluded. Mukamal et al137 did not include either former drinkers or quitters in his reference group of nondrinkers, noting that “former drinkers and quitters had approximately 20% to 60% higher odds of dementia than long-term nondrinkers.” Anttila et al139 found an OR of 0.48 (95% CI: 0.24–0.95) for cognitive impairment in infrequent drinkers when compared with a reference group of “never” drinkers that did not include former drinkers. The ORs for poor cognitive performance from the study of Britton et al140 used a reference group of those who reported drinking within the past year but not in the past week, thereby avoiding questions associated with comparisons between former drinkers and nondrinkers. Similarly, when Ganguli et al144 compared the minimal drinking group with life-long nondrinkers (excluding quitters), the lower odds of decline on the MMSE of 0.05 (95% CI: 0.01–0.26) remained significant; this also was seen for the ratio for the moderate drinking group for decline on the MMSE of 0.27 (95% CI: 0.09–0.84). Stampfer et al147 excluded former drinkers or drinkers whose consumption greatly declined from the reference group of nondrinkers. Wright et al153 distinguished past drinkers from “never drinkers” and only included the latter in their reference group; likewise, Yip et al154 used never drinkers as the reference category. The HRs from Solfrizzi et al156 showing a lower hazard of progression from MCI to dementia in light drinkers of alcohol of 0.15 (95% CI: 0.03–0.78) and light drinkers of wine of 0.15 (95% CI: 0.03–0.77) used a nondrinkers reference group from which former drinkers were excluded. Wadley et al158 used life-long nondrinkers as the reference group. The reduced HR for dementia of 0.56 (95% CI: 0.38–0.82) in female wine drinkers seen in the study by Mehlig et al160 was maintained when former drinkers were included as drinkers rather than as nondrinkers. Lobo et al169 excluded former drinkers from the reference group of nondrinkers.
is there any common factor in the ratios that showed significantly worse cognition in drinkers?
Of the 446 ratios in Figure 2, 123 (28%) were significantly less than 1, indicating less risk or “better” cognition in drinkers; 300 (67%) were not significantly different than 1,
Neuropsychiatric Disease and Treatment downloaded from https://www.dovepress.com/ by 118.70.13.36 on 25-Aug-2020
Dovepress Moderate alcohol consumption and cognitive risk
indicating no difference in risk for drinkers and nondrinkers (“NoDiff ”); and only 23 (5%) were significantly greater than 1, indicating greater risk or “worse” cognition in drinkers. These 23 ratios from 18 studies are plotted in Fig-ure 4 and will be discussed in detail.
Of the 23 ratios in the “worse” group, twelve were associ-ated with heavy drinking, including three (1.58, 1.59, 1.93) for cognitive impairment from Zuccala et al123 in which sub-jects consumed more than 1 L/day of wine. The ratio of 1.80 for cognitive decline from the study in Hungary by Vincze et al157 was for “regular” (heavy) drinkers. The ratios of 2.40 for cognitive decline and 3.90 for dementia from a Finnish study by Järvenpää et al145 were both for heavy binge drinkers. The ratio of 2.50 for AD from Harwood et al134 was for white non-Hispanic subjects in the US consuming more than two drinks/day, which was considered heavy drinking. The ratio of 4.01 from the study in the US by Edelstein et al130 was for women drinking two drinks/day, which is considered heavy for women. The ratio of 4.99 from the study in China by Chan et al167 was from heavy drinkers (.4 drinks/day). The ratio of 6.09 from the study by Barnes et al162 was for heavy drinkers
(.2 drinks/day). The ratios of 7.07 for dementia from Anttila et al139 and 7.42 for dementia from Kivipelto et al159 were from subjects in Finland drinking frequently, often in binges, who also had the apolipoprotein E epsilon 4 (APOE ε4) allele. Lastly, although not related to heavy drinking, the ratio of 3.28 for AD was from subjects in the Canadian Study on Health and Aging127 with the APOE ε4 allele.
The remaining worse ratios were not clearly associated with heavy or binge drinking. The ratio of 1.46 for cognitive impairment from the study in China by Au Yeung et al175 was for light drinkers, and the same study also reported a ratio of 1.53 for ex-drinkers. The ratio of 2.34 for dementia from the study by Truelsen et al133 in Denmark was for beer drinkers compared with subjects who never or hardly ever drank beer. Similarly, the ratio of 2.47 for dementia from the study in China by Deng et al149 was for light to moderate beer drink-ers. The ratio of 3.39 for vascular dementia from Yoshitake et al118 was for a broad group of drinkers in Japan in which alcohol consumption was not quantified but simply categorized into nondrinkers and drinkers. The 3.47 ratio for cognitive impairment from the study in China by Zhou et al138 was for
A
RE Model
XR = OR, RR, HR (log scale) (N = 191, 19 studies)
Qp = 0.0000
I2 = 70.4%
No quitters: XRwm = 0.79 (0.75, 0.84)
x x
B
Log (XR)
Density
3 2 1 0 −2 −1 −3
100.00 10.00
1.00 0.10
0.01 0.00
0.0 0.2 0.4 0.6 0.8 1.0
Log (XR) x = −0.324
σ2 = 0.405
σ = 0.636
SEM = 0.049 n = 172
x
XR (± 95% CI) XR = 0.72 (0.66, 0.80) XR = ex
L95 = e(x − 1.96 SEM)
U95 = e(x + 1.96 SEM)
No quitters: XRm = 0.72 (0.66, 0.80)
Log (XR) Probability Density
Log (XR) density Ν (x, σ2)
−2 0 12 −3 −2 −1 0 1 2Normal QQ Plot
Log odds ratio
Standard erro
r
0.316
1.264
0.00 −3.00
(0.04, 0.20)
Figure 3 (A) Forest plot of 191 XRs (white dots) plus or minus their 95% Cis (horizontal “whiskers”) from 19 studies providing ratios with a reference group that did not include former drinkers. (B) Histogram of the probability density of the log(XR) values with a superimposed smooth probability density curve (solid line) and a superimposed normal distribution density curve (dashed line) calculated using the mean and variance of log(XR).
Notes: The XRwm in Figure 3A is close to that seen in Figure 2. Other conventions are as for Figure 2.
Abbreviations: CI, confidence interval; HR, hazard ratio; NoQuitters, no quitters; OR, odds ratio; Q–Q, quantile–quantile; RR, risk ratio; SEM, standard error of the mean;
XRs, hazard ratios, odds ratios, and risk ratios; XRwm, weighted mean ratio.
Neuropsychiatric Disease and Treatment downloaded from https://www.dovepress.com/ by 118.70.13.36 on 25-Aug-2020
Dovepress
Neafsey and Collins
subjects consuming an unknown amount of alcohol daily; the same study reported a ratio of 1.71 for weekly consumption of an unknown amount of alcohol. The ratio of 4.17 for AD from the University of British Columbia cohort in the study in Canada by Tyas et al119 was for any amount of alcohol use.
Finally, the ratio of 10.70 for AD from the study in France by Leibovici et al136 is for moderate wine drinkers in France only after adjustment for place of residence (community or institution); before adjustment the ratio was 0.13 (95% CI: 0.04–1.02), suggesting reduced risk. The authors explained
RE model
x x Worse: XRwm = 2.35 (1.94, 2.84)
Leibovici99-m-w-AD (DECO) -France Kivipelto08-h-a-D (MMSE < = 24+) -Finland Anttila04-h-bs- D( MMSE < = 24+) -Finland Barnes09-h-a-D (3 MS + DSST) -USA Chan10-h-a-CI (MMSE) -China
Tyas00-y-a-AD (NINCDS/ADRDA) -Canada Edelstein98-h-a-CI (MMSE + 8T) -USA Jarvenpaa05-b-a-D (TELE < 16) -Finland Zhou03-h-a-CI (MMSE + ADL) -China Yoshitake95-y-a-VaD (MMSE + HDS) -Japan Lindsay02-y-w-AD (3 MS < 78 +) -Canada Harwood99-h-a-AD (MMSE)-USA Deng06-lm-b-D (MMSE +) -China Jarvenpaa05-b-a-CD (TELE < 16) -Finland Truelsen02-l-b-D (MMSE +) -Denmark Zuccala01-h-w-CI (HAMT < 7) -Italy Gureje06-y-a-D (WDRT) -Nigeria Vincze07-h-a- (MMSE) -Hungary Zhou03-m-a-CI (MMSE + ADL) -China
10.70 [2.02, 56.62] 7.42 [1.51, 36.42] 7.07 [1.37, 36.54] 6.09 [2.81, 13.20] 4.99 [1.80, 13.83] 4.17 [1.69, 10.30] 4.01 [1.21, 13.24] 3.90 [1.61, 9.45] 3.47 [1.79, 6.72] 3.39 [1.32, 8.71] 3.28 [1.98, 5.44] 2.50 [1.01, 6.17] 2.47 [1.23, 4.96] 2.40 [1.10, 5.22] 2.28 [1.13, 4.60] 1.93 [1.21, 3.08] 1.92 [1.35, 2.73] 1.80 [1.09, 2.97] 1.71 [1.15, 2.54] 1.59 [1.24, 2.04] 1.58 [1.03, 2.43] 1.53 [1.12, 2.08] 1.46 [1.28, 1.66]
2.35 [1.94, 2.84] (N = 23, 18 studies) Qp = 0.0001I
2 = 65.4%
H H
H
H
H
H e4
H H
H H e4H e4H
0.00 0.01 0.10 1.00 10.00 100.00
XR = OR ,RR, HR (log scale)
Au Yeung11-x-a-CI (AMT < 8) -China
Au Yeung11-l-a-CI (AMT < 8) -China
Zuccala01-h-w-C I(HAMT< 7) -Italy Zuccala01-h-w-CI (HAMT < 7) -Italy
Figure 4 Forest plot of 23 XRs plus or minus their 95% CIs (horizontal “whiskers”) from 18 studies providing ratios where drinkers were significantly worse than
nondrinkers.
Notes: Uppercase “H” at left of vertical reference line at 1 indicates ratios from heavy drinkers; “e4” indicates presence of apolipoprotein e epsilon 4 allele. Other conventions as in Figure 2A. Note that the XRwm of 2.43 (95% CI: 1.95–3.03) is much larger than that seen in Figure 2 and is significantly greater than 1.
Abbreviations: ♀,female; ♂, male; 3MS, Modified Mini-Mental State examination; 8t, 8 additional tests; AD, Alzheimer’s disease; ADL, Activities of Daily Living; AMT, Abbreviated Mental Test; CI, confidence interval; D, dementia; DECO, Deterioration Cognitive Observee test; DSST, Digit Symbol Substitution Test; HAMT, Hodkinson
Abbreviated Mental Test; HR, hazard ratio; MMSe, Mini-Mental State examination; MSe, mental status exam; NiNCDS/ADRDA, National institute of Neurological
Communicative Disorders and Stroke/Alzheimer’s Disease and Related Disorders Association criteria for AD; NoDiff, no different; OR, odds ratio; RR, risk ratio; TELE,
telephone screen for cognitive impairment; wDRT, word Delay Recall Test; XRs, hazard ratios, odds ratios, and risk ratios; XRwm, weighted mean ratio.
Neuropsychiatric Disease and Treatment downloaded from https://www.dovepress.com/ by 118.70.13.36 on 25-Aug-2020
Dovepress Moderate alcohol consumption and cognitive risk
this dramatic ratio change from 0.13 to 10.70 as due, at least in part, to demented and institutionalized residents being classed as nondrinkers due to drinking being forbidden in their facility and therefore inflating the number of AD cases in the nondrinkers group. Although this is a plausible explana-tion, it has not been replicated in other studies that included institutionalization as a covariate. For example, Huang et al125 reported an OR for AD of 0.5 (95% CI: 0.3–0.7) in light to moderate drinkers after adjusting for age, gender, education, smoking, institutionalization (living place), and baseline MMSE score. In addition, when institutionalized subjects were excluded and the analysis repeated, the results did not change significantly. In fact, the study by McCallum et al184 reported that light to moderate alcohol significantly delayed the hazard of nursing home placement.
In summary, 13/23 ratios (57%) in the “worse” group were associated with either heavy drinking (12) or the APOE ε4 allele (1). The remaining ten ratios linking light, moderate, or unknown amounts of alcohol consumption with significantly increased risk of dementia or cognitive impairment represent only 2.2% (10/446) of the total.
Other questions
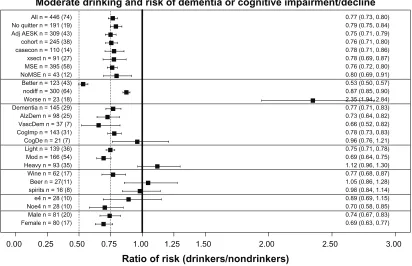
Similar meta-analyses were done for a number of other questions, which will be discussed in reference to Figure 5, which presents a summary plot of the various meta-analyses carried out. As already discussed, comparing the lines labeled “All” and “Noquitter” in Figure 5 shows that there was no significant difference between the overall XRwm values of 0.77 for “All” and 0.79 for no “sick quitters” in the reference group. In addition, the 23 ratios from 18 studies in the line in Figure 5 labeled “worse” have also been discussed in detail. (For reference, the overall XRwm values for “better” and “nodiff ” groups of ratios are also presented; note that the overall weighted mean for “nodiff ” of 0.88 was also significantly less than 1).
Does statistical adjustment for age, education, sex, and smoking change the effect of alcohol on cognitive risk?
Only including studies with these adjustments produced no significant change in alcohol’s effects, as seen for AdjAESK (0.75) in Figure 5.
Ratio of risk (drinkers/nondrinkers)
Female n = 80 (17) 0.69 (0.63, 0.77)
Male n = 81 (20) 0.74 (0.67, 0.83)
Noe4 n = 28 (10) 0.70 (0.58, 0.85)
e4 n = 28 (10) 0.89 (0.69, 1.15)
spirits n = 16 (8) 0.98 (0.84, 1.14)
Beer n = 27(11) 1.05 (0.86, 1.28)
Wine n = 62 (17) 0.77 (0.68, 0.87)
Heavy n = 93 (35) 1.12 (0.96, 1.30)
Mod n = 166 (54) 0.69 (0.64, 0.75)
Light n = 139 (36) 0.75 (0.71, 0.78)
CogDe n = 21 (7) 0.96 (0.76, 1.21)
CogImp n = 143 (31) 0.78 (0.73, 0.83)
VascDem n = 37 (7) 0.66 (0.52, 0.82)
AlzDem n = 98 (25) 0.73 (0.64, 0.82)
Dementia n = 145 (29) 0.77 (0.71, 0.83)
Worse n = 23 (18) 2.35 (1.94, 2.84)
nodiff n = 300 (64) 0.87 (0.85, 0.90)
Better n = 123 (43) 0.53 (0.50, 0.57)
NoMSE n = 43 (12) 0.80 (0.69, 0.91)
MSE n = 395 (58) 0.76 (0.72, 0.80)
xsect n = 91 (27) 0.78 (0.69, 0.87)
casecon n = 110 (14) 0.78 (0.71, 0.86)
cohort n = 245 (38) 0.76 (0.71, 0.80)
Adj AESK n = 309 (43) 0.75 (0.71, 0.79)
No quitter n = 191 (19) 0.79 (0.75, 0.84)
All n = 446 (74) 0.77 (0.73, 0.80)
Moderate drinking and risk of dementia or cognitive impairment/decline
0.00 0.25 0.50 0.75 1.00 1.25 1.50 2.00 2.50 3.00
Figure 5 Overall weighted mean ratios (XRwm) comparing cognitive function in drinkers and nondrinkers in the various groups analyzed. Group with number of ratios
(number of studies) indicated on left; XRwm (95% confidence interval) given on right. Note: See text for fuller description.
Abbreviations: AdjAESK, Adjusted for Age, Education, Sex, and Smoking; AlzDem, Alzheimer’s disease; casecon, case-control study; CogDec, cognitive decline; CogImp, cognitive
improvement; e4, epsilon 4; heavy, heavy drinkers; light, light drinkers; mod, moderate drinkers; MSe, mental status exam; nodiff, no different; Noe4, no epsilon 4; NoMSe, no mental status exam; Noquitter, no quitters; vascDem, vascular dementia; XR, hazard ratio, odds ratio, and risk ratio; XRwm, weighted mean ratio; xsect, cross-sectional study.
Neuropsychiatric Disease and Treatment downloaded from https://www.dovepress.com/ by 118.70.13.36 on 25-Aug-2020
Dovepress
Neafsey and Collins
Are there any significant differences among longitudinal cohort studies, case-control studies, or cross-sectional studies?
There was no significant difference in alcohol’s effects when the three different types of epidemiological studies were considered separately, as seen for cohort (0.76), casecon (0.78), and xsect (0.78) in Figure 5.
Are there any significant differences between studies using mental status exams and those using other methods for measuring cognition?
There was no significant change in alcohol’s effects when cognition was measured in these two ways, as seen for MSE (0.76) and NoMSE (0.80) in Figure 5. However, note that 90% of the ratio studies used mental status exams in some way in their measurement of cognition, so this question must also be answered by referring to the discussion of the plot in Figure 1, which shows that mental status exams were more often asso-ciated with finding “better” cognition in drinkers, while neu-ropsychological tests were more often associated with finding “nodiff ” in cognition between drinkers and nondrinkers.
Are there different effects of moderate drinking on general dementia, AD, and vascular dementia?
There were no significant differences between alcohol’s effects on the different types of dementia, as seen for Dementia (0.77), AlzDem (0.73), and VascDem (0.66) in Figure 5.
Are there specific effects of moderate drinking on cognitive impairment and cognitive decline?
Figure 5 shows the risk of cognitive impairment was similar to that for All and Dementia, but the risk for cognitive decline, which was measured in only 21 ratios from seven studies, did not remain significantly less than 1.0 (see CogImp [0.78] and CogDec [0.96]). The recent meta-analysis by Peters et al11 also failed to find a significant benefit of alcohol use against cognitive decline (RR = 0.89; 95% CI: 0.67–1.17).
Do light, moderate, and heavy drinking have different effects on cognitive risk?
Both light and moderate drinking were associated with significantly reduced cognitive risk, while heavy drinking was associated with increased cognitive risk, as seen in Figure 5 (light [0.75], mod [0.69, and heavy [1.13]]).
Do different types of alcohol (wine, beer, and spirits) affect cognitive risk in the same way?
Wine provided a significant reduction in cognitive risk, while beer and spirits did not, as seen in Figure 5 (wine
[0.77], beer [1.05], and spirits [0.98]). Consistent with this finding, in the Washington Heights-Inwood Columbia Aging Project (WHICAP) cohort Luchsinger et al142 found a reduced risk (RR = 0.45) of AD only in those consum-ing up to three daily servconsum-ings of wine who also lacked the APOE ε4 allele; there was no significant reduction of risk in those consuming beer (RR = 1.47) and spirits (RR = 1.51). However, this conclusion must be qualified in two ways. First, it is based on a relatively small number of ratios from a small number of studies. Second, a number of studies explicitly looked for but did not find a difference between types of alcohol. For example, Huang et al125 found that light to moderate drinkers had a significantly reduced risk of developing dementia compared with nondrinkers (RR = 0.50), regardless of the type of alcohol consumed. Likewise, the Rotterdam Study129 found a significantly reduced risk (HR = 0.58) of dementia in moderate (#3 drinks/day) drinkers of any type of alcohol. In addition, when Ruitenberg et al129 used the HR for dementia of wine drinkers as the reference (1.00), they found the HR for beer was 0.64 (95% CI: 0.25–1.61) and for spirits was 1.32 (95% CI: 0.77–2.26), yielding no significant differences between these types of alcohol. However, male and female drinkers were combined for this analysis, and the two sexes have dif-ferent drinking patterns, which may have masked genuine differences among types of alcohol.160
Does the APOe ε4 allele alter the effect
of alcohol on cognition?
The presence of the APOE ε4 allele appeared to eliminate the significantly reduced cognitive risk effect of moderate drinking, as seen for e4 (0.89) and noe4 (0.70) in Figure 5. Consistent with this conclusion, in the WHICAP cohort Luchsinger et al142 found a reduced risk (RR = 0.45) of AD only in those without the APOE ε4 allele who were drinking up to three daily servings of wine. Similarly, in Canada, Lindsay et al127 reported an increased risk (OR = 3.28) for AD for drinkers (any amount) with the APOE ε4 allele. Likewise, the study in Finland by Anttila et al139 found that infrequent (,1 drink/month) “binge” drinkers without the APOE ε4 had a nonsignificantly reduced risk of dementia (RR = 0.45) compared with nondrinkers, while infrequent “binge” drinkers with APOE ε4 had a large and significant increase in the risk of dementia (RR = 2.30). The same study reported an increased risk (OR = 7.07) for dementia in heavy (frequent) drinkers with the APOE ε4 allele. Furthermore, Harwood et al185 reported that those with the APOE ε4 allele have an earlier onset of AD by an average of 2.6 (for one ε4) or 5.3 (for two ε4s) years.
Neuropsychiatric Disease and Treatment downloaded from https://www.dovepress.com/ by 118.70.13.36 on 25-Aug-2020
Dovepress Moderate alcohol consumption and cognitive risk
In contrast, the Rotterdam Study129 reported the HR was reduced in subjects with the APOE ε4 allele, but the sample and the difference were both small. Likewise, Carmelli et al132 found that light drinking (#1 drink/day) by white male veterans was associated with a significantly reduced risk (OR = 0.60) of poor cognitive function using the MMSE, particularly among those with the APOE ε4 allele. Similarly, Tanaka et al131 reported an OR of 1.60 (1.00, 2.55) for AD in moderate drinkers without the APOE ε4 allele.
Lastly, no effect of APOE ε4 was found in the Nurses’ Health Study147 in which women drinking moderately (1 drink/day) had a significantly reduced risk of cognitive decline (RR = 0.85), as measured by being in the worst 10% of the distribution of decline on the TICS.
In conclusion, although analysis found that the presence of APOE ε4 allele eliminated any significant “protective” effect of moderate ethanol on cognitive risk, a number of other studies have found an opposite effect and our results are based on a relatively small number of ratios from just ten studies, leaving this question unsettled.
Does the sex of the drinker alter the effect of alcohol on cognition?
There was no difference in alcohol’s effects between sexes, as seen in Figure 5 (male, 0.74; female, 0.69), despite the fact that men and women have very different drinking patterns. In general, male drinkers drink more than female drinkers and prefer beer and spirits, while female drinkers prefer wine.77,89,129,133,137,140
Does the effect of alcohol on cognition vary with country?
The beneficial association of moderate drinking with reduced cognitive risk was found in almost all countries studied (see Figure 6). These analyses were first done using all the ratios from each country, including ratios from heavy drink-ers or those carrying the APOE ε4 allele. This “all ratios” approach found a significant benefit in the US (USA), the United Kingdom (UK), France, Italy, Spain, Germany, the Netherlands, Sweden, Australia, Brazil, and Korea (as seen above the heavy dashed line running horizontally in Figure 6), although for some countries (those below the same line in Figure 6) the approach failed to find a significant benefit. However, if ratios from heavy drinkers or those car-rying the APOE ε4 allele were excluded, the country’s ratio then showed a significant benefit. For example, compare the canada and canada-ne4 (no ε4) lines, or the finland and finl-ne4h (no ε4 and no heavy drinkers) lines. In Denmark the initial analysis (denmark) showed no benefit, but a benefit
was seen if only wine drinkers were included (denmark-wn). Similarly, China and Taiwan (chinat) initially showed no significant benefit, but if heavy drinkers were excluded (chinat-nh) a significant benefit was found. However, this strategy did not succeed in identifying a significant benefit for Hungary (compare hungary and hungary-nh lines) or for Japan (compare japan and japan-nh lines). However, in the case of Japan it should be noted that two studies of Japanese Americans (japan-amer)114,148 did find a significant benefit of alcohol, suggesting failure to find a significant benefit in the studies in Japan may not have a genetic basis. In addition, one “no ratio” study of Japanese Americans found better cognition in moderate drinkers.79 No overall benefit was seen in two studies from Nigeria, although one of the studies did have an OR significantly lower than 1151 while the other did not150 (solid dots indicate these two ORs in Figure 6). Two studies of African-Americans did find nonsignificantly reduced risk in drinkers.135,151 Lastly, one study in Greece128 reported a nonsignificantly reduced risk in drinkers.
The absence of studies from Eastern Europe and Rus-sia is notable, but a 2009 paper with a large number of Russian authors stated: “To our knowledge, there are no published or ongoing population-based studies designed to estimate the prevalence of AD and other forms of dementia in Russia.”186
General discussion
Summary
The history of research on moderate drinking and cognition can be divided into two eras: 1977–1997 and 1998–present. Phase I (1977–1997) was the era of neuropsychological evaluation involving mostly young to middle-aged (18–50 years old) subjects. Although initial studies indi-cated moderate drinking impaired cognition, many later studies failed to confirm this, instead finding no difference in cognition between drinkers and nondrinkers. Phase II (1998–present) was and is the era of mental status exam evaluation involving mostly older ($55 years old) subjects. These studies overwhelmingly found that moderate drinking either reduced or had no effect on the risk of dementia or cognitive impairment.
When all the ratios of risk from all the studies in phase II providing such ratios are entered into a comprehensive meta-analysis, the average ratio of risk for cognitive risk (dementia or cognitive impairment/decline) associated with moderate “social” drinking of alcohol is 0.77, with nondrinkers as the reference group. This value is similar to the values obtained by two recent and much more selective meta-analyses (Anstey et al overall RR = 0.74; Peters et al overall RR = 0.73).
Neuropsychiatric Disease and Treatment downloaded from https://www.dovepress.com/ by 118.70.13.36 on 25-Aug-2020
Dovepress
Neafsey and Collins
The benefit of moderate drinking applied to all forms of dementia and to cognitive impairment, but no significant benefit against cognitive decline was found.
Both light and moderate drinking provided a similar benefit, but heavy drinking was associated with nonsignificantly higher cognitive risk for dementia and cognitive impairment.
Although the meta-analysis also indicated that wine was better than beer or spirits, this was based on a relatively small number of studies because most studies did not distinguish among these different types of alcohol. Furthermore, a number of the studies that did make this distinction reported no differ-ence between the effects of these different types of alcohol. Therefore, at present this question remains unanswered.
Analysis also showed the presence of the APOE ε4 allele eliminated the benefit of moderate drinking. However, the analysis was based on a relatively small number of studies, and several other studies have found the opposite effect. Further studies are necessary to settle this question.
The benefit of moderate alcohol was seen in both men and women, although the pattern of drinking is very different between the two sexes, with male drinkers drinking much more than female drinkers and women tending to prefer wine over other forms of alcohol.129,160
Overall, light to moderate drinking does not appear to impair cognition in younger subjects and actually seems to reduce the risk of dementia and cognitive decline in older subjects. This basic finding was the same in many different countries, particularly when results from heavy drinkers or subjects with the APOE ε4 allele were excluded.
Mental status exams
The MMSE,187 which has been the “workhorse” of the mental status era, is considered to have several weaknesses, including relatively poor assessment of executive function and floor and ceiling effects because it has only 30 possible points.188,189 These limitations were reviewed in a recent meta-analysis of the MMSE, which concluded it was best for “ruling-out a diagnosis of dementia in community and primary care” and that “for all other uses it should be com-bined with or replaced by other methods.”190 Nonetheless, the very fact of the MMSE’s widespread use means that “the same ruler” has been applied to measuring cognition in many studies, making the consistent results of a benefit of moderate drinking plausible. In addition, in about 60% of the 67 studies with and without ratios that used some type of mental sta-tus exam, the stasta-tus exam was combined with one or more
Ratio of risk (drinkers/nondrinkers)
Greece n =1 (1) 0.56 (0.26, 1.21)
Afr-Amer n = 2 (2)Nigeria n = 2 (2) 0.68 (0.39, 1.21)1.36 (0.60, 3.09)
Japan-Amer n = 4 (2) 0.67 (0.55, 0.81)
Japan-nh n = 5 (3)Japan n = 9 (3) 1.09 (0.60, 1.98)1.21 (0.89, 1.64) Hungary-nh n = 1 (1)Hungary n = 2 (1) 0.90 (0.70, 1.30)1.24 (0.63, 2.43) Chinat-nh n = 21 (5)Chinat n = 35 (5) 0.65 (0.47, 0.89)0.91 (0.70, 1.19) Denmark-wn n = 3 (1)Denmark n = 12 (1) 0.42 (0.26, 0.68)1.07 (0.74, 1.52) Finl-ne4 h n = 13 (4)Finland n = 31 (4) 0.77 (0.57, 1.04)1.22 (0.95, 1.57) Canada-ne4 n = 4 (1)Canada n = 11 (3) 0.70 (0.56, 0.88)0.91 (0.56, 1.46) Korea n = 8 (1)Brazil n = 8 (1) 0.49 (0.39, 0.63)0.67 (0.49, 0.93) Australia n = 11 (3)Sweden n = 8 (2) 0.61 (0.54, 0.71)0.63 (0.48, 0.84)
Holland n = 39 (2) 0.63 (0.54, 0.74)
Germany n = 19 (2)Spain n = 18 (2) 0.68 (0.60, 0.77)0.64 (0.49, 0.82)
Italy n = 31 (4) 0.79 (0.67, 0.94)
France n = 23 (5) 0.73 (0.61 ,0.88)
UK n = 18 (5) 0.75 (0.68, 0.82)
USA n = 159(27)All n = 446 (74) 0.77 (0.73, 0.81)0.77 (0.73, 0.80)
Geography: Moderate drinking and risk of dementia or cognitive impairment/decline
0.00 0.25 0.50 0.75 1.00 1.25 1.50 2.00 2.50 3.00
Figure 6 Overall weighted mean ratios (XRwm) comparing cognitive risk in drinkers and nondrinkers by country. Country with number of ratios (number of studies) indicated
on left; XRwm (95% confidence interval) given on right.
Abbreviations: afr-amer, African-Americans; australia, Australia; brazil, Brazil; canada, Canada; canada-ne4, Canada, no epsilon 4; chinat, China and Taiwan; chinat-nh, China
and Taiwan, no heavy drinkers; denmark, Denmark; denmark-wn, Denmark, wine drinkers; finland, Finland; finl-ne4h, Finland, no epsilon 4, no heavy drinkers; france, France;
germany, Germany; greece, Greece; holland, the Netherlands; hungary, Hungary; hungary-nh, Hungary, no heavy drinkers; italy, italy; japan, Japan; japan-amer, Japanese Americans; japan-nh, Japan, no heavy drinkers; korea, Korea; nigeria, Nigeria; spain, Spain; sweden, Sweden; UK, United Kingdom; USA, United States of America; XR, hazard ratio, odds ratio, and risk ratio.
Neuropsychiatric Disease and Treatment downloaded from https://www.dovepress.com/ by 118.70.13.36 on 25-Aug-2020
Dovepress Moderate alcohol consumption and cognitive risk
other measurements of cognition, making the judgment of dementia or cognitive impairment more reliable.
Comparison with other cognitive
risk reducers
How does an overall ratio of 0.77 compare with ratios of risk associated with other “treatments” or activities that have shown some benefit against dementia and cognitive decline? Those who eat a Mediterranean diet – which includes high intake of vegetables, fruits, cereals, fish, olive oil, and wine – have an OR for dementia of 0.60.191 Similarly, Gu et al192 reported that the HR for AD was 0.62 (95% CI: 0.43–0.89) after multivariable adjustment for subjects in the highest third of conformity to a specific dietary pattern associ-ated with reduced AD risk. Likewise, more years of education and the associated fuller participation in social and intellec-tual life193 provide a benefit of similar magnitude (overall RR of 0.84), perhaps by producing a “cognitive reserve” that results in a more gradual rate of cognitive decline.194 Gardening has also been associated with a reduced risk (HR = 0.64) of AD.152 Therefore, the reduced cognitive risk from moderate drinking is similar in size to the reduced risk associated with other factors.
Other beneficial outcomes
of moderate drinking
Mukamal et al195 found that low to moderate alcohol consumption (5–30 g/day) further reduced the risk (OR = 0.38; 95% CI: 0.16–0.89) of myocardial infarction in men (8867 subjects), even if they were also nonsmokers who were active $30 min/day and had a body mass index of ,25. Similarly, in the Healthy Aging: a Longitudinal study in Europe project, low to moderate alcohol consumption was found to have a similarly beneficial effect on risk of mortality (HR = 0.78) to a Mediterranean diet (HR = 0.77), physical activity (HR = 0.63), and nonsmoking (HR = 0.65), with the combination of all four beneficial factors reducing the risk of mortality to 0.35.196 Imhof et al197 found that low to moderate drinking reduced a variety of biomarkers of inflammation, including C-reactive protein, fibrinogen, white blood cell count, and plasma viscosity. Britton et al198 found that a cardio-protective benefit of moderate drinking was found among those with poor health behaviors (little exercise, poor diet, and smok-ing), but no additional cardioprotective benefit of alcohol was found in those with the healthiest behavior profile. French and Zavala199 found that current moderate drinkers had the highest odds (OR = 1.27 for men, OR = 2.03 for women) of report-ing above-average health status compared with nondrinkers.
Karlamangla et al200 found that light to moderate drinking was associated with a reduced risk for incident disability or death over 5 years compared with abstention (OR = 0.77). Tien et al201 found that low to moderate blood alcohol level at the time of a traumatic brain injury is associated with reduced risk of mortality (OR = 0.76; 95% CI: 0.52–0.98). Overall, then, the reduced cognitive risk associated with moderate drinking is comparable with the reduced risk for death, cardiovascular disease, and other morbidities.
Conclusion
Heavy drinking (.3–4 drinks/day) is associated with an increased risk of dementia and cognitive impairment, in addition to all the other horrible and devastating consequences of alcohol abuse and alcoholism for the individual and their family and friends, and society in general. However, light to moderate drinking (#2 drinks/day for men, #1 drink/day for women) by adults does not increase the risk of dementia, cognitive decline, or cognitive impairment – a conclusion also reached by a recent comprehensive review.13 In fact, notwithstanding the conclusion in a recent article that “no evidence of even moderate scientific quality exists to support the association of any modifiable factor … with reduced risk for Alzheimer disease,”202 there is substantial evidence that light to moderate drinking (as defined in the National Institute on Alcohol Abuse and Alcoholism’s position paper on moderate drinking203), particularly of wine, reduces the risk of dementia and cognitive impairment.
Acknowledgments
Support of the authors’ research by NIH (AA013568) is acknowledged.
Disclosure
The authors report no conflicts of interest in this work.
References
1. Belmadani A, Kumar S, Schipma M, et al. Inhibition of induced neurotoxicity and apoptosis by moderate ethanol preconditioning.
Neuroreport. 2004;15:2093–2096.
2. Golde TE. Alzheimer disease therapy: can the amyloid cascade be halted?
J Clin Invest. 2003;111:11–18.
3. Collins MA, Neafsey EJ, Mukamal KJ, et al. Alcohol in moderation, cardioprotection, and neuroprotection: epidemiological considerations and mechanistic studies. Alcohol Clin Exp Res. 2009;33:206–219. 4. Collins MA, Neafsey EJ, Wang K, et al. Moderate ethanol preconditioning
of rat brain cultures engenders neuroprotection against dementia-inducing neuroinflammatory proteins: possible signaling mechanisms. Mol
Neurobiol. 2010;41:420–425.
5. Mitchell RM, Neafsey EJ, Collins MA. Essential involvement of the NMDA receptor in ethanol preconditioning-dependent neuroprotection from amyloid-beta in vitro. J Neurochem. 2009;111:580–588.
Neuropsychiatric Disease and Treatment downloaded from https://www.dovepress.com/ by 118.70.13.36 on 25-Aug-2020